ORIGINAL RESEARCH ARTICLE
FINANCIAL STATEMENT ANALYSIS OF OPTCL, BBSR
*Bikash Narayan Naik and Suman Mishra
Department of Business Management, Central University of Orissa
ARTICLE INFO ABSTRACT
This work dealt with the financial analysis of a company, OPTCL. The purpose of this thesis was to assess the financial situation of the company in the years between 2012 and 2017, by using various tools of financial statement analysis in order to recommend necessary precaution for company’s economic improvements. The whole work consisted of two parts: theoretical and analytical. The first part described importance and methods of financial statement analysis as well as its users. The second section contained basic information about the company and numerous financial analyzing tools as comparative statement analysis, trend analysis and ratio analysis. Based on the result of financial analysis, there are some proposed recommendations to improve the company’s financial situation.
Copyright © 2018,Bikash Narayan Naik and Suman Mishra. This is an open access article distributed under the Creative Commons Attribution License, which permits unrestricted use, distribution, and reproduction in any medium, provided the original work is properly cited.
INTRODUCTION
The basis of financial planning analysis and decision making is the financial information (Statements). Financial statements are needed to predict, compare and evaluate a firm’s earning ability. It is also required to aid in economic decision making investment and financing decision making. The financial information of an enterprise is contained in the financial statements. The use of financial statement analysis in investment decision has been addressed by a series of authors. John Myer, a renowned authority on Financial Statements Analysis, has referred that in the initial years of 20th century, the bankers and securities exchange authorities were extensively relying on the financial statements of the companies for analysis, monitoring and control of the activities and performance of businesses. The history, principles and financial statement analysis has been referred by another authority also: Kennedy and McMullen. According to Gautam, U. S. (2005) Financial Statement is generally explained as financial information which is the information relating to financial position of any firm in a capsule form. Financial statement, according to J. A. Ohison (1999) was defined as a written report that summarizes the financial status of an organization for a stated period of time.
*Corresponding author: Bikash Narayan Naik
Department of Business Management, Central University of Orissa
It includes an income statement and balance sheet or statement of the financial position describing the flow of resources, profit and loss and the distribution or retention of profit. According to Pandey, I.M. (2005 Financial management) profitability is the ability of an entity to earn income. It can be assessed by computing various relevant measures including the ratio of net sales to assets, the rate earned on total assets etc. According to Meigns et al. (2001), Financial Statement simply means a declaration of what is believed to be true and which, communicated in terms of monetary unit. It describes certain attributes of a company that is considered to fairly represent its financial activities. Meigs and Meigs (2003) stated that the rate of return on investment (ROI) is a test of management’s efficiency in using available resources. Furthermore, Gopinathan (2009) has presented that the financial ratios analysis can spot better investment options for investors as the ratio analysis measures various aspects of the performance and analyzes fundamentals of a company or an institution. Andrew and Schmidgall (1993) in their study classified financial ratios into five categories “liquidity ratios, solvency ratios, activity ratios, profitability ratios, and operating ratios”. They indicated that financial ratios themselves do not provide valuable information about a firm’s performance, Andrew (1993) in his study conducted on automobile industry investigated the leverage ratio of companies and suggested that a value-maximizing capital structure. Hitchings (1999), in his study
ISSN: 2230-9926
International Journal of Development Research
Vol. 08, Issue, 09, pp.23132-23145, September,2018
Article History:
Received 19th June, 2018 Received in revised form 26th July, 2018
Accepted 04th August, 2018
Published online 30th September,2018
Available online at http://www.journalijdr.com
Key Words:
Financial analysis,
Comparative statement analysis, Trend analysis, Ratio analysis.
ORIGINAL RESEARCH ARTICLE
OPEN ACCESS
realized that ratio analysis is a sensitive and valuable tool in credit assessment which is to forecast the ability of a borrower to meet its debt obligations.
Objectives of the Study
To know the status of the company in terms of
profitability, liquidity, solvency and efficiency.
To judge the utilization of its resources.
To find out the different relationship between the
different item of the balance sheet and profit and loss account.
To know the ability of the organization to meet the
current obligation.
To know the ability of the organization to meet the
long-term obligation.
To know the changes in the financial position of the
organization over a period.
RESEARCH METHODOLOGY
No research is completed until it has formulated a specific problem. The problem of the study is to analyze the financial
performance and financial status of OPTCL (BBSR). In the
present study, an attempt has been made to measure, evaluate and compare the financial performance of OPTCL (BBSR). The study is based on secondary data that has been collected from annual reports of the respective company, magazines, journals, documents, online database and other published information. The study covers the period of 6 years i.e. from year 2012-13 to 2017-18 used in this report have been taken from financial statements i.e., the PROFIT & LOSS ACCOUNT, BALANCE SHEET for the relevant years. The procedural details have been collected from the respective manuals, booklets etc.
Primary Data: The source of primary data was collected through the discussion with the concerned executives of the organization.
Secondary Data: The secondary source of data includes official records, various publications of the organizations and annual reports audited financial statement and company websites. To examine the result for determined objectives of the study accounting analysis has been used. The performance of the company has been analyzed on the basis of Profitability, Liquidity, Solvency and Efficiency.
Introduction: Finance is the life blood of any business. A firm communicates the financial information to the users through financial statement and reports. The financial performance of a firm may not be very well gauged by merely scanning the figures in financial statements. Financial statements contain summarized information of the firm’s financial affairs, organized systematically. They are the means to present the firm’s financial situation to the users. Financial statement analysis not only helps largely in finding the goal division of a business enterprise but also guides, ensuring, effective and efficient utilization of available resources both physical and financial. The financial statement analysis is the starting point for making plans, before using any sophisticated forecasting and planning procedures.
Today a large section of people, who have minimal financial literacy, are keen to know the financial performance status of
the companies where their deposits are vested. They may be as an investor, manager, employee, owner, lender, customer, government and public at large. Financial performance is not airily available from the records and files in any organization. It has to be derived by the usage of financial statement analysis techniques. The selection and usage of technique is subject to the option of the user. Financial Analysis is the process of assessing the financial position of a company by analyzing its stability, viability and profitability. One of the primary objectives of financial analysis is to recognize changes in financial trends, to help measure the progress made by an enterprise and identify a relationship to draw a logical conclusion on the performance of the company. Another major aspect of a financial analysis is comparing the performance of the company with its competitors.
Profitability and financial performance could be defined as a measurement of the results of a firm’s polices and operations in monetary terms. In assessing the overall financial condition of a company, the income statement and the balance sheet are important reports, as the income statement captures the company's operating performance and the balance sheet shows its net worth. Financial performance could be assessed using the key measures which are important to assess the current financial position and performance. These are descriptive and analytical measures of financial position and performance. That includes current assets, current liabilities, total assets, stockholders equity, total revenues, total expenses and net income. And analytical measures of financial position and performance could include profitability measures. The ever changing, external & internal environment in which the organization operates to achieve its goal has often leaded to change in the financial structure of the firm. This change may be in the assets structure, capital structure or any other such type of the change have often been found out of bring changes in the liquidity position, level of activity & profitability of organization. To be aware of various positions parties concerned with the organization often go for the various type of analysis one of them being financial analysis, that is done to know about the present performance of the firm in which they are either going to invest or do business, with. The responsibility of management to look after the effective & efficient utilization of resources of the overall sound financial situation of the organization, increase their requirement to have a detailed report on probably each & every aspect of financial position which may be liquidity, activity, profitability.
Company Profile
Odisha Power Transmission Corporation Limited (OPTCL), one of the largest Transmission Utility in the country was incorporated in March 2004 under the Companies Act, 1956 as a company wholly owned by the Government of Orissa to undertake the business of transmission and wheeling of electricity in the State.
Started commercial operation from 01.04.2005 only as
a Transmission Licensee. (a deemed Transmission Licensee under Section 14 of Electricity Act, 2003)
Notified as the State Transmission Utility (STU) by the
State Govt. and discharges the State Load Dispatch functions.
and field units are spread all over the State. OPTCL became fully operational with effect from 9th June 2005 consequent upon issue of Orissa Electricity with OPTCL. The Company has been designated as the State Transmission Utility in terms of Section 39 of the Electricity Act, 2003. Presently the Company is carrying on intra state transmission and Reform (Transfer of Transmission and Related Activities) Scheme, 2005 under the provisions of Electricity Act, 2003 and the Orissa Reforms Act, 1995 by the State Government for transfer and vesting of transmission related activities of GRIDCO wheeling of electricity under a license issued by the Orissa Electricity Regulatory Commission. The Company is also discharging the functions of State Load Dispatch Centre. The Company owns Extra High Voltage Transmission system and operates about 9550.93ckt kemps of transmission lines at 400 kV, 220 kV, 132 kV levels and 81 nos. of substations with transformation capacity of MVA. The day-to-day affairs of the Company are managed by the Managing Director assisted by whole-time Functional Directors as per the advice of the Board of Directors constituted. They are in turn assisted by a team of dedicated and experienced professionals in the various fields.
Swot Analysis of Optcl
Strength
OPTCL is the only transmission utility in the state of
Odisha, there is no competition from any other transmission corporation limited.
The strong transmission network is having 81 grid
substations spread throughout the state, is a great asset of OPTCL.
Weakness
In the absence of any competition there is a likelihood
that the performance of the employee may go down.
As there is no recruitment has taken place since last 2-3
years, the performance of the remote grid substation has gone down due to lack of proper manpower.
Opportunity
There is enough scope for creating network for both
inter as well as intra state in the absence of any competitors.
Availability of technical persons [electrical engineers]
within the state in a large number is an opportunity in the organization for fresh recruitment.
Threats
Continuous operation and maintenance of grid
substation and extra high voltage [EHV] transmission lines has become a challenge to the organization: unless properly maintained it will break down of the entire system.
As per electricity act 2003 a new transmission company
may come up in the future which may pose a threat for the existing company.
Analysis of Comparative Statements
The non-current liabilities have decreased in terms of
[image:3.595.307.558.68.172.2]borrowings, and other non-current liabilities. But in total the non-current liabilities have increased to 4.85%.
Fig. 1.
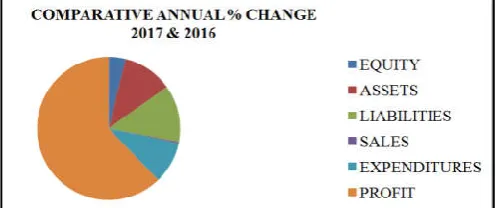
The current liabilities have also increased with a higher
rate of growth of 42.21%. The increase in amount of trade payables, financial liabilities and other current liabilities has contributed a major portion in the overall increase of the current liabilities.
With respect to the increase in the current liabilities of
the company, the total liabilities also increased to 23.65%.
The non-current assets like loans and advances have
decreased in the financial year 2017 by 9.86%. But the other non-current assets have decreased significantly to 27.06 crores from 344.12 crores.
The cash and cash equivalents have increased
significantly to 97%. The trade receivables have decreased indicating the credit policy of the firm to be a strict one.
The total assets have also increased to 42%.
The increase in the revenue from sales is quite
minimum but the revenue from other operations is quite significant. The increase in sales is only 0.56% but the increase in other incomes is 82.35%.
The expenses of the company have overally increased
by 17.43%.
The employee expenses have increased by 16.36% in
the current year.
Due to the increase in the value of fixed assets the
amount of depreciation has also increased by 20%.
There is a high increase in the profits of the company in
the financial year 2017. The profits have increased by 114%. It indicates that the company is reviving from the losses incurred in the previous year.
Fig. 2.
In the year 2016 there is no decrease in the liabilities of
the concern.
The current liabilities of the organization has increased
to 805.57 crores i.e., 35.07%.
[image:3.595.319.564.583.719.2] Most of the non-current assets have decreased in this financial year except plant & equipment and other non-current assets.
The non-current assets overally increased due to the
increase of two items viz, plant & equipment and other non-current assets.
Among the current assets, the inventories have
increased to 30%.
The company started short term investments in this
financial year.
In comparison to the increase in current liabilities the
current assets have not increased significantly. They have increased by only 18.81%. The revenue from operations has increased by a minimum of 4.12% which indicates the organisation is struggling to increase its sales.
Although there is no high rate of increase in the total
expenses of the company but it has affected the profitability of the company.
The overall profits of the company have decreased by
Rs. -33.71crs.
In the financial year 2016 the company has suffered a
loss of Rs. 2.55 crores. This is because of the high expenses of the organisation which could not be compensated by the revenue of the organisation.
Fig. 3.
In this financial year the non-current liabilities have not
increased significantly. Their rate of change is quite minimal i.e., 4.82%.
The inventories in this year have decreased by 13.76%.
The amount of cash and cash equivalents has increased
by 14.67%.
The trade receivables have increased during this year
indicating a liberal credit policy of the company. The revenue from operations has increased by 5% while the revenue from other incomes has decreased by 30% thus decreasing the total income of the company.
The employee costs during this year have increased by
39% which have reduced the net profit of the company.
There is very minimal change in the earnings per share
of the company during this year.
The provisions for to meet the contingent liabilities
have decreased in the year 2015 by 15.98%.
There is no significant increase in the liabilities of the
company in this year. Because the current liabilities have not increased much.
The non-current assets have increased in terms of every
individual item. Overally the non-current assets have increased by 6.60%.
There is no change found in the amount of inventories
during this year.
The total current assets increased by 58.56% in which
the major contribution is of the increase in the amount of cash and cash equivalents. The rate of increase in the sales i.e., the revenue from operations is 8.21%.
Fig. 4.
The total income of the company is increased maximum
because of the increase in other income by 42.50%.
The expenses of the company have decreased by
various individual items but the finance costs for the organization has led to an overall increase in the total expenses of the concern.
The overall increase in the expenses is 7.96%.
There is noticeable change in the earnings per share in
[image:4.595.323.560.101.223.2]both the basic and diluted earnings. The basic earnings per share are increased by 6.75% while the diluted earnings per share have increased by 13.54%.
Fig. 5.
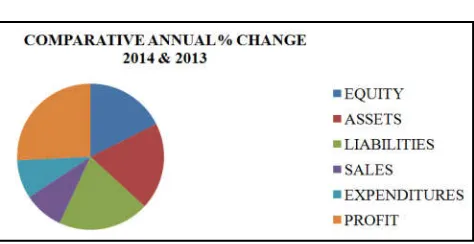
The non-current liabilities have increased mainly due to
the increase in provisions made to meet the contingent liabilities of the company. it has increased by 11.18%.
In the year 2013 the trade payables have decreased thus
decreasing the amount of current liabilities. The trade payables decreased by 58.60%.
The long term investments have decreased highly. The
company has the least investment in short term securities and other avenues in this year. In the year 2013 the sales have decreased by 3.79%. But the income from other sources has made the company to manage its total expenses. The other income in this year has increased by 26.73%.
All the expenses have decreased in this financial year.
But the amount of depreciation and amortization has increased by 19.96%.
The profits of the company for this financial year also
decreased due to the decrease in the net sales and increase in the amortization costs by 33.01%.
Trend Analysis
Fig. 6.
The above graph indicates the trend of all the components. It can be seen that sales have a flat growth during the 6 years. The profit after tax and the fixed assets have a similar trend. They started to rise in between during the mid 2016 but again had a downward trend and later again revived.
In case of sales, it can be seen that there is a positive
growth in the sales during the year 2012-2017. Although there is no significant growth in the sales but there is a steady growth.
The profit after tax shows a variable trend i.e., during
the year 2013 there is a decrease in the profit after tax and has a negative growth. But during the year 2014 the company earned more profit as compared to the previous year. The trend of profit after tax has a variable growth. In the year 2016 the company suffered a loss and the trend of the PAT has a downfall. But in the year 2017 the profit after tax has increased significantly indicating a positive growth and increasing efficiency of the management.
The fixed assets of the company have increased every
year. There is a steady and continuous growth in the value of the fixed assets.
Though there is a slow rate of growth in the fixed assets
of the company, but the current assets of the company
during the year 2012-2017 have a high rate of growth. The graph line of the current assets is highly elevated.
The current liabilities in the year 2015 and 2016 have
increased at a super normal rate. The company’s current liabilities in these two years have increased due to the high rate of growth in the amount of financial and other liabilities of the company.
From all the components studied the current assets and the current liabilities have an upward trend which is indicating a higher rate of growth. In comparison to current assets the current liabilities are increasing at a higher rate. This increase in the current liabilities may affect the company’s liquidity in the long run.
Ratio Analysis
Profitability Ratios: Under this sector, we’ll be focusing on profitability ratios based on investments. Return on Investment is the most important ratio of all. It is the percentage of return on funds invested in the business by its owners. In short, this ratio tells the owner whether all the effort put into the business has been worthwhile.
1. Return on Capital employed
The return on capital employed ratio gives a clear picture of the return the company earned from the total investments made. It gives an idea about the overall profitability of the company. As per the theoretical practice higher the ratio, better is the liquidity. The ROCE of OPTCL shows a satisfactory result during the years 2012-2015. In the year 2016 the ROCE is decreased as compared to the previous years The main reason for decrease in ROCE in the year 2016 is the increase in the total capital employed in the organization. With the increase in the capital employed an increase in the net profit is
[image:5.595.101.495.485.721.2]generally anticipated but in OPTCL the net profit during the year remained same without any growth. This resulted in the decrease in the ROCE ratio. In the year 2017 the ROCE of OPTCL has increased significantly. The ROCE for the current financial year is satisfactory.
Table 1.
Year 2012 2013 2014 2015 2016 2017
Ebit 85.47 67.56 98.07 95.33 74.4 84.91
Total assets 2622.76 2815.4 3431.52 4067.93 5042.32 6360.93 Current liablities 282.72 297.72 305.71 1041.43 1524.1 2637.37 Capital employed 2340.04 2517.68 3125.81 3026.5 3518.22 3723.56
Roce 3.65 2.68 3.14 3.15 2.11 2.28
Fig. 7.
It indicates the relationship between the net profit & sales. It establishes the efficiency of the management in manufacturing, selling, administrative & other activity of the firm. The net profit ratio of the company shows a decrease in the profitability of the company indicating inefficient management of the company during the years 2013 and 2014. In the year 2015 the net profit ratio of the company shows a positive growth indicating the efficiency and profitability of the company. But in the very next financial year it has zero growth because of the loss incurred. In the current financial year the net profit ratio has a upward trend showing good performance of the organization.The return on assets shows the efficiency of the company over its total assets. In OPTCL the ROA has a variable position. In the year 2013 it is not satisfactory as it shows a downward trend in its ratio. The reason for this is due to the increase of expenditures and reduction in the net profit of the company.
But in the year 2014 and 2015 the ROA remains same having an upward trend as compared to the previous years. In the year 2016 due to the loss incurred by the company the ROA is zero. In the current financial year the company has successfully increased the profits and the ROA is also growing. According to convention, current ratio should be 2:1, i.e., every current liability of Re. 1 should be backed by current asset of Rs. 2. If the ratio is more than this, it means the working capital position is sound. If current ratio is less than this, i.e., 2:1, there is a need to investigate whether the position is satisfactory or not. As a matter of fact, a ratio higher than 2:1 may be unsatisfactory from the point of view of profitability though it may be satisfactory from the viewpoint of solvency. Here, the year 2014 had satisfactory current ratio; in the years 2012 to 2015 the company had an average current ratio; whereas, in the year 2016 and 2017, the company had an unsatisfactory current ratio.
2. Net profit Ratio
Table 2.
YEAR 2012 2013 2014 2015 2016 2017
NET PROFIT AFTER TAXES 27.64 20.78 26.68 31.16 -2.55 17.97
NET SALES 570.54 549.73 598.89 634.34 661.58 665.31
NET PROFIT RATIO 0.05 0.04 0.04 0.05 0.00 0.03
Fig. 8. 3. Return on Assets
Table 3.
Year 2012 2013 2014 2015 2016 2017
EAT 27.64 20.78 26.68 31.16 -2.55 17.97
Total Assets 2,622.76 2,815.40 3,431.52 4067.93 5042.32 6360.93
Average total assets 1311.38 1407.7 1715.76 2033.97 2521.16 3180.47
[image:6.595.43.553.81.577.2]ROA 0.02 0.01 0.02 0.02 0.00 0.01
2. Liquidity Ratios
[image:7.842.39.803.142.238.2]1. Current Ratio
Table 4.
CURRENT ASSET(in Rs. crore) CURRENT LIABILITY(in Rs. crore)
2012 2013 2014 2015 2016 2017 2012 2013 2014 2015 2016 2017
(a)Current Investments 7.31 8.41 2 (a)Trade payables 51.15 32.25 48.15 163.3 190 207
(b)Inventories 130.41 141 140 123.7 179.4 179 (b)Other Current Liabilities 78.1 96.9 93.82 190.3 368 739
(c)Trade Receivables 78.05 64.18 57.1 113 119.3 202 (c)Short term provisions 153.47 168.6 163.7 136.3 138 140 (d)Cash & Cash Equivalents 38.58 60.61 389.59 456.58 21.95 990.38 (d) Deferred income 33.59 23 19.3
(e) bank balances 725.1 555 (e) Other current liabilities 518 806 1532
(f)Short Term Loans and Advances 51.3 14.39 75.4 5.03 7.15 5.62
(g)Other Current Assets 3.19 1.96 10.9 208.6 109.3 338
TOTAL 301.53 282.1 680.3 906.9 1170.16 2272 231.57 265.5 257.6 878.1 1334 2430
Table 5.
YEAR 2012 2013 2014 2015 2016 2017
Total CA 301.53 282.1 680.3 906.9 1170.16 2272
Total CL 231.57 265.5 257.6 878.1 1334 2430
CURRENT RATIO 1.30 1.06 2.64 1.03 0.88 0.93
Fig. 10.
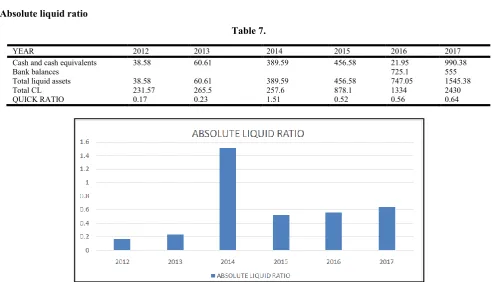
These ratio shows that company carries a small amount of cash. But there is nothing to be worried about the lack of cash because company has reserve, borrowing power & long term investment. In India, firms have credit limits sanctioned from banks and can easily draw cash. The absolute liquid ratio of the company shows that there is high liquidity in the company and it is able to manage the cash requirements as and when required. Initially the absolute liquid ratio is not much satisfactory but 2014 onwards the absolute liquid ratio of the company is very much satisfactory. This ratio indicates extent of working capital, which should be always moderate.
The decline in working capital indicates that either working capital is in excess of requirements or there is operational inefficiency. Here, in the year 2013 and 2015 the company had very high working capital and in 2014, the company had a very bad working capital turnover ratio resulting in a wide fluctuation; whereas in the years 2012, the company maintained a moderate working capital. The negative working capital turnover ratio indicates the operational inefficiency of the company. The years 2016 and 2017 has a negative working capital turnover ratio which is not beneficial for the organisation. Normally, the higher ratio indicates better inventory management.
2. Quick Ratio
Table 6.
YEAR 2012 2013 2014 2015 2016 2017
Total CA 301.53 282.1 680.3 906.9 1170.16 2272
Inventories 130.41 141 140 123.7 179.4 179
Quick asset (Total CA - Inventories) 171.12 141.1 540.3 783.2 990.76 2093
Total CL 231.57 265.5 257.6 878.1 1334 2430
[image:8.595.46.552.81.653.2]QUICK RATIO 0.74 0.53 2.10 0.89 0.74 0.86
Fig. 11.
3. Absolute liquid ratio
Table 7.
YEAR 2012 2013 2014 2015 2016 2017
Cash and cash equivalents 38.58 60.61 389.59 456.58 21.95 990.38
Bank balances 725.1 555
Total liquid assets 38.58 60.61 389.59 456.58 747.05 1545.38
Total CL 231.57 265.5 257.6 878.1 1334 2430
QUICK RATIO 0.17 0.23 1.51 0.52 0.56 0.64
[image:8.595.53.551.356.638.2]Low ratio means that sales require to be pushed up and action is called for. At times even high ratio should convey a danger signal. It means customers’ demand cannot be met properly and thus it indicates that profitable opportunities are not being fully utilized. Here, in all the five years from 2012 to 2016, the company maintained a satisfactory inventory turnover ratio. In the year 2017 the inventory turnover ratio has decreased as compared to the previous years. In the current year the inventories could not be properly converted into sales. The sales of the company are required to be pushed up. This type of ratio is based upon sales. A concern may sell goods on cash as well as on credit.
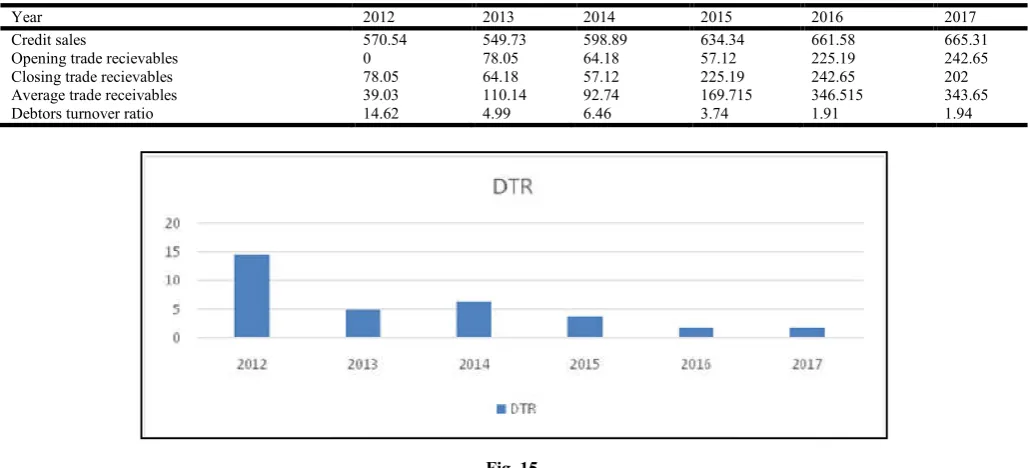
Debtor means ordinary debtors and bills receivable. The higher the values of debtor’s turnover the values of debtor’s turnover the more liquid are the debts. The lower the values of debtor’s turnover the less liquid are the debts. This ratio indicates the speed with which debtors are being converted into sales. The higher the values of debtors turnover, the more efficient is the management of credit. But in the company the debtor turnover ratio is varying from year to year. In the years 2012 to 2014, the ratio had an upward trend showing the efficiency of the company in converting the debts into cash. But 2015 onwards the ratio has gone down. This shows that company is not utilizing its debtor’s efficiency.
3. ACTIVITY RATIOS
1. Working capital turnover ratio
Table 8.
YEAR 2012 2013 2014 2015 2016 2017
Total CA 301.53 282.1 680.3 906.9 1170.16 2272
Total CL 231.57 265.5 257.6 878.1 1334 2430
Working capital 69.96 16.6 422.7 28.8 -163.84 -158
Sales 570.54 549.73 598.89 634.3 661.58 665.31
[image:9.595.46.544.131.632.2]Working Capital Turnover 8.16 33.12 1.42 22.02 -4.04 -4.21
Fig. 13.
2. Inventory turnover ratio
Table 9.
YEAR 2012 2013 2014 2015 2016 2017
Sales 570.54 549.73 598.89 634.34 661.58 665.31
Opening inventory 114.43 130.41 140.95 140.39 123.71 178.5
Closing Inventories 130.41 140.95 140.39 123.71 178.5 178.56
Average inventories 179.64 200.89 211.15 202.25 212.96 267.78
Inventory Turnover Ratio (in times) 3.18 2.74 2.84 3.14 3.11 2.48
Fig. 14.
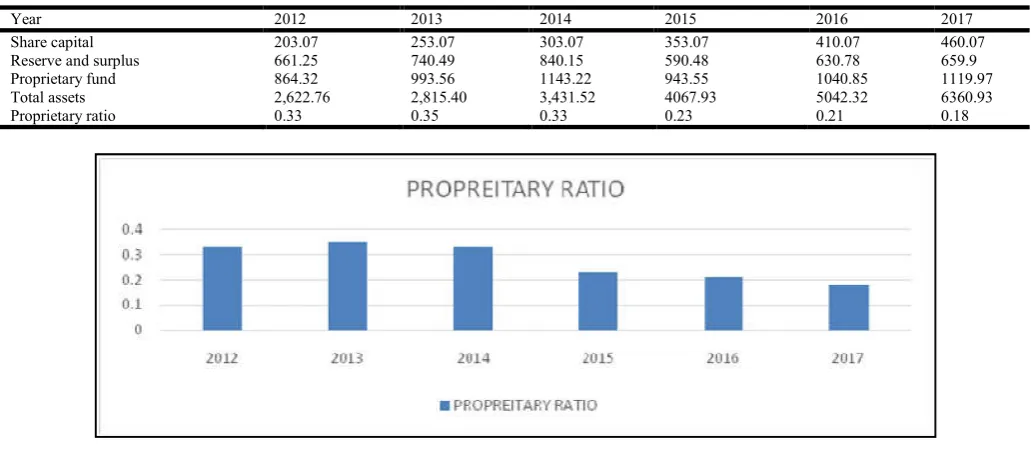
[image:9.595.47.561.396.634.2]Now their credit policy has become liberal as compare to previous year.But in the year 2017 the company has again made its credit policy a bit strict and is able to convert the debtors into cash. The debt-equity ratio of the company shows the proportion of debt capital and equity capital in the total capital structure of the company. It has been seen that in OPTCL the debt capital has the maximum portion in the total capital structure of the company. During the years 2012-2017 the debt-equity ratio is having a higher rate of growth.It is seen that the debt portion of the company has a rapid growth but the equity of the capital has a constant growth during those years. As the maximum proportion of capital is provided by the creditors the share holders will be at a benefit through the high debt to equity ratio. The proprietary ratio shows the contribution of stockholders’ in total capital of the company.
A high proprietary ratio, therefore, indicates a strong financial position of the company and greater security for creditors. A low ratio indicates that the company is already heavily depending on debts for its operations. A large portion of debts in the total capital may reduce creditors interest, increase interest expenses and also the risk of bankruptcy. The proprietary ratio of the company shows a variable position of the company. The years 2013 have a strong financial position while from the year 2015 the company have a very weak financial position. This is due to the higher proportion of debt equity in the company. The fix interest debts may lead the company to incur more expenses which will affect the company’s profitability and liquidity. Capital gearing ratio is a useful tool to analyze the capital structure of a company and is computed by dividing the common stockholders’ equity by
[image:10.595.46.562.99.333.2]3. Debtors Turnover Ratio
Table 10.
Year 2012 2013 2014 2015 2016 2017
Credit sales 570.54 549.73 598.89 634.34 661.58 665.31
Opening trade recievables 0 78.05 64.18 57.12 225.19 242.65
Closing trade recievables 78.05 64.18 57.12 225.19 242.65 202
Average trade receivables 39.03 110.14 92.74 169.715 346.515 343.65
[image:10.595.43.563.102.595.2]Debtors turnover ratio 14.62 4.99 6.46 3.74 1.91 1.94
Fig. 15.
4. Solvency Ratios
[image:10.595.39.566.353.585.2]1. Debt to equity ratio
Table 11.
Year 2012 2013 2014 2015 2016 2017
Total liabilities 1,758.44 1,857.84 2,288.30 3,124.38 4001.47 5240.96
Stock holders equity 203.07 253.07 303.07 353.07 410.07 460.07
Debt-equity ratio 8.66 7.34 7.55 8.85 9.76 11.39
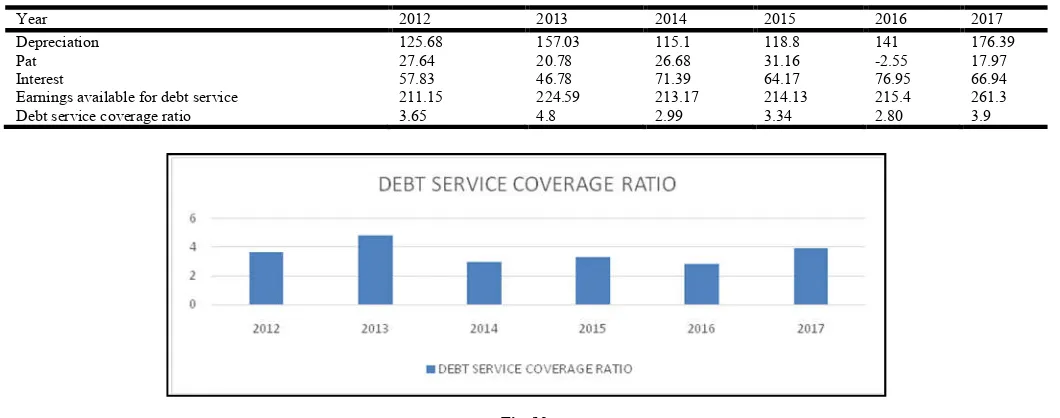
fixed interest or dividend bearing funds. Analyzing capital structure means measuring the relationship between the funds provided by common stockholders and the funds provided by those who receive a periodic interest or dividend at a fixed rate. A company is said to be low geared if the larger portion of the capital is composed of common stockholders’ equity. On the other hand, the company is said to be highly geared if the larger portion of the capital is composed of fixed interest/dividend bearing funds. From the above capital gearing ratio it can be seen that OPTCL is low geared. Debt service coverage ratio is used to judge the firm’s ability to pay off current interest and installments. Generally, higher the ratio better is the firm’s ability to meet the interest installments.
The debt service ratio is higher in the year 2013 which indicates the firm’s ability to meet the liabilities of fixed interest. The debt coverage ratio of OPTCL is satisfactory. In the present year also the company’s debt service coverage ratio has improved and is satisfactory. Generally, a high interest coverage ratio means that an enterprise can easily meet its interest obligations even if earnings before interest and taxes suffer a considerable decline. A lower ratio indicates excessive use of debt or inefficient operations. The interest coverage ratio for OPTCL is favorable for the year 2015 as it is the highest. As compared to previous years 2017 has a lower interest coverage ratio. In the year 2016 the proportion of debt increased which resulted to a lower ratio.
2. Proprietary Ratio
Table 12.
Year 2012 2013 2014 2015 2016 2017
Share capital 203.07 253.07 303.07 353.07 410.07 460.07
Reserve and surplus 661.25 740.49 840.15 590.48 630.78 659.9
Proprietary fund 864.32 993.56 1143.22 943.55 1040.85 1119.97
Total assets 2,622.76 2,815.40 3,431.52 4067.93 5042.32 6360.93
[image:11.595.41.557.101.327.2]Proprietary ratio 0.33 0.35 0.33 0.23 0.21 0.18
Fig. 17.
3. Capital gearing ratio
Table 13.
Year 2012 2013 2014 2015 2016 2017
Short term borrowings 78.1 96.9 93.82 190.26 368.06 739.4
Long term borrowings 748.34 699.06 724.82 544.09 669.35 638.22
Fixed interest bearing funds 826.44 795.96 818.64 734.35 1037.41 1377.62
Reserves and surplus 661.25 740.49 840.15 590.48 630.78 659.9
Share holders equity 203.07 253.07 303.07 353.07 410.07 460.07
Common stock holders equity 864.32 993.56 1143.22 943.55 1040.85 1119.97
Capital gearing ratio 1.05 1.25 1.40 1.28 1.00 0.81
Fig. 18.
[image:11.595.39.558.171.615.2] [image:11.595.49.558.388.628.2]The management has turned to be inefficient to manage the increased fixed interest expenses. In the current financial year the company is able to meet its interest obligations with a higher interest coverage ratio.
Analysis and interpretation of cash flow statement for the current financial year
Cash flows from operating activities: As compared to the previous year the cash flows generated from operating activities is more in the current year. This increase in cash flows can be a result of the movements in working capital. Items in working capital like increase in deferred revenue and increase in other liabilities have a significant change in the current year as compared to that of previous year. It can be noticed that the cash flows from operating activities is highly affected by the movements in working capital than that of adjustments.
Cash flows from investing activities: It can be seen that for investing activities the cash used has decreased in the current year than that of the previous year.
A very amount has been paid to acquire property, plant and equipment. As compared to previous year the proceeds from sale of financial assets, interest from banks and proceeds from disposal of property are more in the current year. The reduced use of cash in investing activities is due to the reduction in the payment towards term deposits.
Cash flows from financing activities: The cash flows from financing activities have a variable behaviour. In the previous year cash was generated from financing activities in a heavy amount. But in the current year cash is used in financing activities. This major change is due to the proceeds from borrowings. In the previous year the proceeds were positive which increased the cash inflows but in the current year the proceeds are negative.
Changes in trade receivables: The trade receivables of the organisation in the current year have decreased while it had increased in the previous year. It indicates that the company has adopted a strict credit policy for the current year.
Changes in inventories: The inventories in the current year have increased but not to a large extent. In the previous year
4. Coverage Ratios
1. Debt service coverage ratio
Table 14.
Year 2012 2013 2014 2015 2016 2017
Depreciation 125.68 157.03 115.1 118.8 141 176.39
Pat 27.64 20.78 26.68 31.16 -2.55 17.97
Interest 57.83 46.78 71.39 64.17 76.95 66.94
Earnings available for debt service 211.15 224.59 213.17 214.13 215.4 261.3
[image:12.595.39.569.112.321.2]Debt service coverage ratio 3.65 4.8 2.99 3.34 2.80 3.9
Fig. 19.
2. Interest coverage ratio
Year 2012 2013 2014 2015 2016 2017
Ebit 85.47 67.56 98.07 95.33 74.4 84.91
Interest 57.83 46.78 71.39 64.17 76.95 66.94
[image:12.595.50.554.356.528.2]Interest coverage ratio 1.48 1.44 1.37 1.49 0.97 1.27
there was a high increase in the inventories but the company adopted a slower approach in increasing the inventories for the current year. The reduced increase in the inventories can be analysed as two sides of the same coin. It indicates a positive decision for the company because the sales of the organization is not high during this year, the inventories would have been an over investment and inefficient cash management. It also indicates a negative decision as it can be assumed that due to the lack of sufficient amount of inventories the production was hampered which led to a reduced sales figure.
Changes in trade payables: The trade payables have increased in both the years but the increase is less in the current year as compared to that of the previous year. It indicates that the purchase policy of the organisation has been made strict. The company has reduced its credit purchases which strengthens the liquidity position of the organisation.
Changes in net income: The net income of the company has a significant difference for both the years. In the previous financial year the company suffered a loss which affected many aspects of the organisation like ROA and Net Profit Ratio. On the contrary, the net income of the organization increased to higher extent giving a positive effect on all aspects of the organisation. These increased profits made the company sound in terms of profitability, liquidity and solvency.
FINDINGS
The Analysis & interpretation of profit and loss is essential to bring out the mystery behind the figures in the profit & loss. This analysis is an attempt to determine the significance and meaning of the profit & loss data. So that forecast may be made of the future earnings, ability to pay the interest and debt maturities, profitability and sound dividend policy.
The net sale of the company increased in the current
year than the previous year, but there is no significant increase.
The profit in both figure and percentage has decreased
in the year 2016 as compared to the previous year to a heavy amount. It indicates a lower profitability standard. In the current financial year the company is capable to earn sufficient amount of profits thus maintaining a good liquidity position.
There is a continuous growth in the amount of equity
capital during the six years. The equity capital is growing every year at the rate of 10% per annum.
The comparative statement of OPTCL shows the
financial strength and weakness. The comparative balance sheet reveals that, current asset have increased and the fixed asset have also increased. It indicates that the financial position of the firm is good.
The company is increasing its portfolio in non-current
investments from the year 2015. The company started to invest in short term securities and other investments from the year 2016.
The liquid assets of the organisation viz., cash and cash
equivalents and bank balances have a high growth during the six years. The company is increasing its liquid assets to meet the immediate cash requirements.
The analysis implies that the company has a good
liquidity position.
From the analysis it has been found that the current
liabilities of the company have a very high growth. Although the company is maintaining a good liquidity position but this increase will affect the company’s liquidity and profitability in the long run.
The company is suffering from negative working
capital turnover during the financial years 2016-17 and 2017-18. This negative ratio indicates an operational inefficiency.
In the current year the company failed to increase its
sales which led to an unfavourable inventory turnover ratio.
According to the analysis, the company is having a
variable credit policy. Sometimes it follows a strict policy and coverts the debtors into cash and sometimes it lacks in converting the debtors into cash.
From the analysis it can be seen that the company has
higher proportion of debt as that of equity. A higher proportion of equity will lead the company to incur more expenses which will be fixed in nature. And also they are required to be met first which may affect the company’s solvency position in the long run.
The company’s fixed interest bearing funds are more
than the common stakeholder’s fund. As per the capital gearing ratio, that the company is a low geared company.
In the current year the company is marinating a strict
purchase policy and a strict credit policy thus reducing its amount of trade payables and trade receivables.
The company’s working capital movements have
affected the cash flows generated from the operating activities.
The cash position of the company is much more
satisfactory in the current year than that of the previous year.
Conclusion
OPTCL is the soul of Odisha’s power transmission network and is playing a pivotal role in making surplus power after meet the demand of the state through efficiently administering the system of transmission. For improvement of organization’s profitability, much emphasis is needed to improve the better working capital management by decreasing the current liabilities through reducing of unplanned overhead expenses. In such process, current assets position will be improved through collection of revenue from power transmission as well as recovery of past dues from DISCOMS, Govt. and other agencies etc. The company should give more attention on increasing its collection of revenue from wheeling charges under the head of account revenue from operation and should give more emphasis to curtail unplanned expenses to increase the further profit.
The working capital of an organization has a great
importance in their day-to-day activities. So it is suggested to take remedial measures to improve the working capital of the company.
The organization must take necessary steps to raise the
interest on loans and advances in order to increase the revenue sources of OPTCL.
To control expenditure.
To maintain a good current ratio and try to increase the
amount of current assets.
The organization has to be strict to its debtors by reducing the credit period allowed to as to improve its efficiency by managing the operation.
The management should generate a systematic financial
plan for better working capital management. There should be better and proper guidelines for working capital management. It should get detailed view of the operations; find out the financial requirement on accounts of operation after taking into consideration the different financial statements.
The corporation should invest more in current assets
instead of gross block. If the corporation will give emphasis on investment in current assets then it will increase the liquidity position of the corporation.
There must be a systematic plan to collect the
outstanding payments still due from the distribution companies.
There should be more capital inclusion in this
corporation by the government of Odisha, Department of Energy, because it will increase the working capital and also the capital in OPTCL. As in this stage it needs more capital for its day to day operation and strengthening the transmission lines all over Odisha.
The management should more concentrate on
management of current assets & minimize current liabilities.
The management should concentrate more on better
utilization of funds.
In order to increase the profitability of this concern if
govt. increases the tariff rate, then this corporation as well as other power sector corporations will get more profit in the future. So that they can meet with the demand side.
REFERENCES
Book References
Gupta, Sashi, “Financial Management”, 4th Edition, 2007,
Kalyani Publisher, New Delhi.
Kothari S.P., Ball R., “Financial Statement Analysis”
Maheswari Dr S. N “Financial Management”, Ninth Edition, 2006 Sultan Chand & Sons, New Delhi.
Pandey I. M., “Financial Management”, Vikas Publishing
House Pvt. Ltd. 8th Edition 1999.
Prasanna Chandra, “Financial Management”, Fourth Edition 1999, Tata McGraw Hill Publishing Company Ltd, New Delhi.
Sinha G., “Financial Statement Analysis”
Subramanyam K.R., “Financial Statement Analysis”
Research Articles
An Empirical Analysis of the Quality of Corporate Financial Disclosure, Surendra S. Singhvi and Harsha B. Desai An Empirical Investigation of the Extent of Corporate
Financial Disclosure in the Oil and Gas Industry, David Malone, Clarence Fries, Thomas Jones
Corporate social and financial performance- A Meta-Analysis, Marc Orlitzky, Frank L. Schmidt, Sara L. Rynes.
Corporate Financial Statements, A Product of the Market and Political Processes, Ross L. Watts
Financial ratios, discriminant analysis and the prediction of
corporate bankruptcy, Edward I. Altman
Financial statement analysis, P. A. Griffin
Web References
www.google.com www.optcl.co.in www.osou.ac.in www.slideshare.com www.wikipedia.com