Full Length Research Article
ANALYSIS AND COMPARATIVE STUDY OF ENERGY MANAGEMENT IN INDIA
*
Vaibhav Jain
Research Scholar, College of Tech. and Engineering, Maharana Pratap University of Agri. & Tech., Udaipur, India
ARTICLE INFO ABSTRACT
Electricity demand is increasing exponentially and due to the limitations in the generation of electricity by conventional methods the generation and demand gap has largely increased. This paper focuses on the energy management area by taking different sectors as a load and comparing them on the basis of their consumption. We took lighting as a important category for each sector and prepare its consumption data in respective sector. The mathematical analysis provides the prove for the replacement of existing standard lighting equipment by the efficient lighting equipment which must provide large benefits to customers in reducing their electricity bills.
Copyright © 2015 Vaibhav Jain.This is an open access article distributed under the Creative Commons Attribution License, which permits unrestricted use, distribution, and reproduction in any medium, provided the original work is properly cited.
INTRODUCTION
Electricity demand of India is increasing exponentially and due to the limitations in the generation of electricity by conventional methods the generation and demand gap has largely increased. By realizing the problems and constraints with the conventional sources of generation we can work on the management of energy demand at consumer’s end by appropriate planning without increasing the generation. Filling the consumer’s demand without increasing the generation or installation capacity of power plants arises the thought of the Energy Management concept. The countries like Japan, China, Europe etc. are already working and implementing this concept and drawing benefits out of it but a country like India (having 2nd largest population and per capita consumption of 778.63 kwh according to Government of India) (http://pib.nic.in/newsite/erelease.aspx?relid=84206, ?) still require to largely work on this concept and to achieve technical advancements in the field of electricity.
*Corresponding author: Vaibhav Jain
Research Scholar, College of Technology and Engineering, Maharana Pratap University of Agri. & Tech., Udaipur, India
Energy demand management is also known as demand side management (DSM), is the modification of consumer’s demand for energy through various methods such as financial incentives and education. Usually, the goal of demand side management is to encourage the consumer to use less energy during peak hours, or to move the time of energy use to off-peak times such as nighttime and weekends. Peak demand management does not necessarily decrease total energy consumption, but could be expected to reduce the need for investments in networks and/or power plants for meeting peak demands. An example is the use of energy storage units during off-peak hours and discharge them during peak hours. Nowadays, DSM technologies become increasingly feasible due to the integration of information and communications technology and power system (Christopher, 2014), resulting in a new term: Smart Grid, due to which penetration of renewable sources along with DSM are also coming in roles and resulting in new term Distributed Generation. Demand Response is reactive or preventative method to reduce, flatten or shift peak demand. It includes all intentional modifications to consumption patterns of electricity of end user customers that are intended to alter the timing, level of instantaneous demand, or the total electricity consumption.
ISSN: 2230-9926
International Journal of Development Research
Vol. 5, Issue, 04, pp. 4055-4060, April,2015
DEVELOPMENT RESEARCH
Article History: Received 13th January, 2015
Received in revised form 16th February, 2015 Accepted 20th March, 2015
Published online 29th April, 2015
Key words: Energy Management, Demand Side Management, Compact Florescent Light, Light Emitting Diode, Bureau of Energy Efficiency, Carbon mono Oxide, Council of Energy Agency,
Demand Response refers to a wide range of actions which can be taken at the customer side of the electricity meter in response to particular conditions within the electricity system (such as peak period, network congestion or high prices).
Technology Assessment for Energy Management
The technology assessment is structured to provide a comprehensive insight into the energy management (EM) technology segment like lighting that is deployed end-use wise across different power consuming sectors. Since there are various alternatives available within this end- use technology segment, a set of metric is defined for segment. This is to classify and assess the alternatives in order to get a comparative set of data for ease of deployment. Figure 1 provides the research methodology adopted in the paper. The “Why-What & How” model is used in order to understand the “Why” (the rationale for the paper), decide the “What” (the content of the paper) and plan the “How” (the steps used in structuring the paper) in the context of the paper (Demand side Management in India, 2014).
[image:2.595.342.503.87.220.2]The objective of this paper is to provide a detailed characterization of the DSM technology segment rather than that of all individual technology alternatives available within each segment. This will provide a resource for the DSM implementing agencies for selecting an appropriate technology that fits their DSM program requirements based on the targeted customer sector, and investment required.
Figure 2 shows the sector wise electrical energy consumption share of different sectors in the country. The current peak demand shortage is14% and the energy deficit is about 8.4%. In such scenarios efficient use of electricity necessitates persistent energy conservation efforts through reduction in energy usage in a specific product without affecting output or
user comfort levels (Demand side Management in India, 2014).
Fig. 2. Energy consumption share in different sectors
Peak Load Reduction
The actual reduction in peak load reflects the change in demand for electricity that results from a utility energy management (EM) program that is in effect at the time that
[image:2.595.66.523.310.567.2]the utility experiences its actual peak load as opposed to the potential installed peak load reduction capacity. Differences between actual and potential peak reduction result from changes in weather, economic activity and other variable conditions (Mihaela Ghicajan, ?). Energy Efficiency refers to programs that are aimed at reducing the energy used by specific end-use devices and systems, typically without affecting the services provided. These programs reduce overall electricity consumption, often without explicit consideration for the timing of program-induced savings. Such savings are generally achieved by substituting technically more advanced equipment to produce the same level of end-use services (e.g., lighting, heating, motor drive etc.) with less electricity.
EM Technology Overview
A. Sector and End-Use Technology Mapping
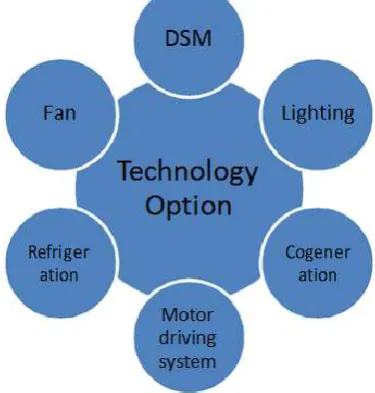
[image:3.595.37.561.80.181.2]It is imperative to identify the spread of end-use EM technologies across the different load categories in order to develop the framework for assessing these technologies using appropriate metrics. These end-use technology segments, spread across different load categories, comprises of lighting, ceiling fans, refrigerators, HVAC, cogeneration systems, motor driven equipment, water heaters and Demand Response as shown in Table 4 and Figure 3. Each of these end-use segments has a number of technology variants (for example lighting has CFL, LED etc). These technologies differ from each other in several parameters viz., efficiency, wattage, cost, colour rendering index etc. and also based on application (Rangan Banerjee, 2005).
Table 4. Sector Vs End-use Technology Options for EM
Segments Agricu
Lture Indus
Trial Com Merci
Muni Cipal
Resid Entail
Water Heating N N Y N Y
Cogeneration N Y N N N
Demand Response N Y Y Y Y
Motor driven system Y Y N Y N
AC N Y Y N Y
Refrigeration N Y N N Y
Fan N N N N Y
Lighting N Y Y Y Y
Lighting
From primitive ages, lighting is an essential requirement for people in their daily needs. Lighting consumes a minimum
of 5 to 15% of total energy consumption for residential users and 30% for commercial users, and these values increases with the end user requirements. In certain small and medium retail business models, lighting accounts for 80% of total energy usage. Table 5 shows the percentage contribution of different sectors in the total electricity consumption in the country with the percentage share of lighting component in that contribution. Lighting component for some manufacturing and processing industrial sectors can be 15% of industry’s total electricity consumption. Similarly, for IT sector, which comes under commercial sector, lighting could account to 40 % or more in total electricity consumption
[image:3.595.135.458.212.274.2]Figure 3. End-Use Technology Options for EM in India
Table 1. Rationale for DSM – Perspective of Utility, customer and society
Utility Customers Society
Reduction in cost of operations due to avoided peak power purchase.
Reduction in cost of operations due to avoided peak power purchase.
Reduced greenhouse gases emissions owing to avoided construction of fossil fuel based power plants.
Improved customer satisfaction and operating efficiency.
Energy efficient appliances available at subsidized rates and through appliance exchange schemes
DSM promotes sustainable energy development through practice of resource optimization of depleting fossil fuels and efficiency in energy conversion.
Avoided capital expenditure on building new power plants, distribution and transmission networks.
Reliable power supply due to reduced power cuts and outages
[image:3.595.84.513.301.381.2]Reduction in power outages enables equity in power distribution
Table 2. Energy consumption for various sectors
Sector Energy consumption (in units) Energy consumption (in %)
Industrial 1604.71 TWh 43.62
Residential and Commercial 505.09 TWh 13.73
Agriculture 269.12 7.32
Others 1299.54 35.33
Table 3. Cost analysis and saving by EM
Reduction in Peak load (MW) Energy Saved (Million KWh) DSM Program cost (Thousand dollars) Energy Efficiency By EM Total
2000 12.8 10.0 22.9 53.7 1.56
2001 13.0 11.9 24.9 53.9 1.63
2002 13.4 9.5 22.9 54.0 1.62
2003 13.5 9.3 22.9 50.2 1.29
2004 14.2 9.2 23.5 54.7 1.55
[image:3.595.340.528.542.739.2] [image:3.595.40.288.617.709.2]Table 5. Lighting component in total electricity used in various sectors
Sector Electricity Consumption (in %) Lighting Component (in %)
Domestic 10 50-90
Commercial 17 4-5
Industry 49 4-5
Others 24 2
[image:4.595.41.288.238.396.2](Demand side Management Energy Efficiency and Energy, 2014). As per the 18th Electric Power Survey of CEA, the estimated energy consumption in Indian public lighting sector with 2009-10 as the base year is about 8478 million kWh in 2012-13. This sector is expected to grow at 7% annually during the XII and XIII plan periods. This trend is shown in Figure 4.
Fig. 4. Growth in Public lighting demand
As per BEE estimates, there are over 400 million lighting points in India using incandescent lamps which if replaced with CFLs would reduce approximately 6000-10000 MW and if replaced by LEDs would reduce about 10000-15000 MW of the electricity demand. India’s installed capacity of power generation is about 232, 164 MW and peak demand deficit is currently around 9 %. This means that with proper deployment of energy efficient lighting technologies, a significant capital investment can be avoided. Combined GHG emission savings on replacing an estimated 400 million GLSs with CFLs would also result in reducing about 20 million tonnes of (CO) from grid-connected power plants. The large contribution of (domestic, commercial and street) lighting demand to peak load also makes it attractive for the utility to offer incentives for the adoption of efficient lighting practices by consumers. This would result in reduction of costly peak-load power procurement. With improvement in LED technologies, the lighting sector as a whole has immense potential to pursue energy efficiency options. Moreover, strategies for conserving energy in lighting loads will require both technology and design expertise. Use of energy efficient lamps should be complemented with appropriate lighting design for a specific installation point or facility in order to meet the energy conservation goals (Demand side Management Energy Efficiency and Energy, 2014).
Case Study
In this case study, the annual cost of saved energy is calculated when an energy efficient technology is replacing existing
(conventional) one. In the present case, replacement of GLS with CFL and LED is illustrated. Table 6 gives the input data required for the analysis (Demand side Management Energy Efficiency and Energy, 2014).
Equations for calculation
ECEE=WEE*H* (1) ECStd= WStd*H*D (2)
In eq. (1) and (2), ECEE is the electricity consumption of energy efficient option and ECStd is the electricity consumption of standard option WEE/WStd is wattage of energy efficient and standard option respectively H and D are for working hours per day and working days per year respectively.
Eq.-(3-6) should be before table-6
C1= EC*UC (3)
In eq. (3) UC is unit cost of electricity consumption, EC is for electricity consumption and C1 is cost1.
C2=EqpC*N (4)
Where, EqpC is the equipment cost, N no. of equipments required for working years and C2 is the cost2.
TAE=C15+C25 (5)
Where TAE is total annual expenses for five yrs C15&C25 are costs for five yrs.
ANS=TAEEE-TAEStd where ANS is annual net saving in rs.
ASU=ANS/UC (6)
Where ASU is annual saved Units
Cost Saving Calculation
Approximations
life of LED is 15 yrs and GLS is 1 yr. data is taken from Table-6.
analysis is carried out for 5 yrs.
Analysis is carried out for a single equipment.
Table 6. Data for the Calculation of Cost of Saved Energy (CSE)
Comparison Parameters Unit LED CFL GLS Luminous
Efficiency
Lumens/ Watt
120 50 12
Rated wattage Watt 6 14 60
Luminous flux lumens 720 700 800
Cost/unit Rs. 1200 150 15
Avg. operating hr/day
Hrs 10 10 10
Operating day/year
days 330 330 330
Unit rate Rs/kwh 5 5 5
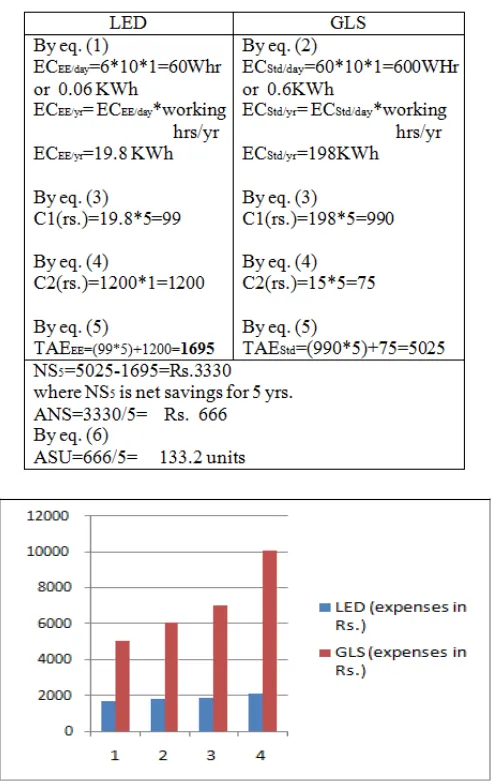
[image:4.595.318.549.628.734.2]Table 7. Calculation of Saved Cost of Energy (CSE) for energy efficient lighting replacements
[image:5.595.41.288.82.474.2]Fig. 5. Variation of expenses cost of energy consumption with various years (GLS vs. LED)
Table 8. Cost comparison in Rs. between GLS and LED for different years
Electricity Consumption
Years
Electricity Cost by GLS (Tungsten Incandescent)
in RS.
Electricity Cost by LED
in Rs.
5 5,025 1,695
6 6,030 1,794
7 7,035 1,893
10 10,050 2,090
15 15,075 2,685
Option 1: Replacement of GLS with LED
Replacement of GLS with LED is most popular EM technique in India. This has also passed the benefit and cost analysis tests. The cost of saved energy by replacing GLS with LED is calculated for various working hours and unit rates. The results are plotted in Figure 5 between cost v/s years. It can be seen that with increase in working hours (usage) of the energy efficient equipment, saved energy increases and saving amount increases hence makes the technology option viable, in the present case it is replacement of GLS with LED In the
fig. 5. Comparison graph of electricity consumption by LED and GLS is shown.
Option 2: Replacement of CFL with LED
[image:5.595.314.550.275.416.2]Now-a-days LEDs are becoming popular in domestic sector and are seen as future replacement of CFLs. It can be seen that the cost of saved energy is higher for case with higher discount rate and low working hours, in such cases replacement of CFL with LED is unviable. However, with LED technology promising working hours of 50,000 (approximately) this situation may not arise. It can be seen from Figure 6 that for high working hours (>5000) LED is going to be a good choice (for a discount band of 10-50%). It is also clear from the figure that investment in energy efficient technology becomes more cost effective with increase in the hours of operation for the same investor or stakeholders with same discount rate.
Fig. 6. Variation of cost of saved energy with discount rate and hours of operation (CFL vs. LED)
Conclusion and Future Scope
Energy efficient measures need to be implemented by agencies that have a attractive schemes or lower discount rate. When the market penetration is increased (with time) owing to reduction in the price of energy efficient technology and awareness, such measures will automatically become cost effective to implement for consumers. Once the consumer starts to consider electricity saving as an important part of their life, the probability of making this sector a profitable one will also starts. LED Village campaign project by BEE, covering 27 villages across the country are efforts in this direction. To implement the EM the initiative can be taken by the government by creating one department responsible for implementing EM techniques state wise which can provide growth to the country in the perspective of energy sector.
REFERENCES
Buchholz, B. and Schluecking, U. Jun. 2006. “Energy management in distribution grids European cases,” in Proc. IEEE Power Eng. Soc. Gen. Meet.
[image:5.595.49.274.544.622.2]CME World Energy Council – Energy Efficiency A Worldwide Review, 2006.
Demand side Management Energy Efficiency and Energy Conservation/ch 5/12th plan/2014.
Demand side Management in India: Technical Assessment/ Shakti sustainable energy foundation/report/2014.
http://pib.nic.in/newsite/erelease.aspx?relid=84206
Mihaela Ghicajanu, Univ. Lecturer Dr. Ec., University of petrosani, programs of energy efficiency – demand side Management
Rangan Banerjee, 2005. “Energy Efficiency and Demand Side Management (DSM)”, IIT Bombay Background paper submitted to Integrated Energy Policy Committee, Govt of India.