www.hydrol-earth-syst-sci.net/13/1567/2009/ © Author(s) 2009. This work is distributed under the Creative Commons Attribution 3.0 License.
Earth System
Sciences
Landscape scale patterns in the character of natural organic matter
in a Swedish boreal stream network
J. Temnerud1,*, A. D ¨uker1, S. Karlsson1, B. Allard1, S. K¨ohler2, and K. Bishop3 1Man-Technology-Environment Research Centre, ¨Orebro University, ¨Orebro, Sweden 2Dept. of Applied Geosciences, Technical University of Graz, Graz, Austria
3Dept. of Aquatic Sciences and Assessment, Swedish University of Agricultural Sciences, Uppsala, Sweden *present address: Dept. of Aquatic Sciences and Assessment, Swedish University of Agricultural Sciences,
P.O. Box 7050, 75007 Uppsala, Sweden
Received: 27 March 2009 – Published in Hydrol. Earth Syst. Sci. Discuss.: 17 April 2009 Revised: 19 August 2009 – Accepted: 19 August 2009 – Published: 3 September 2009
Abstract. This paper defines landscape-scale patterns in the character of natural organic matter (NOM) and tests for rela-tionships to catchment soil, vegetation and topography. The drainage network of a boreal catchment, subcatchment size 0.12–78 km2, in Northern Sweden was sampled in August 2002 during a period of stable low water flow. The NOM was characterized with UV/Vis spectroscopy, fluorescence, XAD-8 fractionation (%humic substances), gel permeation chromatography (apparent molecular weight), and elemental composition (C:N). The largest spatial variation was found for C:N, absorbance ratio, and specific visible absorptivity. The lowest variation was in fluorescence index, %humic sub-stances and molecular retention time. The variation in to-tal organic carbon (TOC), iron and aluminium concentration was more than twice that of C:N. Between headwater and downstream sites no significant changes were distinguished in the NOM character. At stream reaches, junctions and lakes little change (<10%) in NOM character was observed. Com-mon factor analysis and partial least squares regression (PLS) revealed that the spatial variation in surface coverage of lakes and mires could explain some of the variation of TOC and NOM character. Our suggestion is that the mosaic of land-scape elements (different amounts of water from lakes, for-est soil and mires) delivers NOM with varying characteristics to a channel network that mixes conservatively downstream, with possible small changes at some stream reaches, junc-tions and lakes.
Correspondence to: J. Temnerud
(Johan.Temnerud@vatten.slu.se)
1 Introduction
Natural organic matter (NOM) has a large impact on en-vironmental water chemistry because of its many functions (e.g. Stumm and Morgan, 1996; Schwarzenbach et al., 2003). Aquatic ecosystem structures are significantly affected by the presence of NOM with different characteristics (Wet-zel, 2001). When the influential River Continuum Concept (RCC) was introduced (Vannote et al., 1980), downstream changes in NOM character were presented as an important feature of the continuum. Few studies, however, have ex-amined the changes of character from headwaters via most stream junctions to the outlet at the mesoscale, along this continuum.
Information on patterns of landscape-scale NOM charac-ter, especially high resolution spatial data, combined with water flow data that allows for a quantification of NOM-contributions from different landscape elements in the boreal region are scarce. An effort has recently been made to quan-tify the spatial patterns of TOC-concentration in a 78 km2 bo-real catchment stream network (stream order 4) in Northern Sweden (Temnerud and Bishop, 2005). That survey found that the pattern of downstream concentration changes dif-fered markedly between the two main branches of the stream network, with significant downstream declines in TOC on one branch, but not the other. These patterns were related to the mosaic of the landscape elements: forests, wetlands and lakes. The synoptic sampling strategy used in that study provided an opportunity to examine the character of NOM as well. Character measures used included optical proper-ties, C:N, fluorescence, and molecular weight. Many of these were applied on both whole water samples and fractions iso-lated using XAD resins or gel permeation chromatography. While high flows and especially spring flood transport most of the NOM, summer base flow was selected for the sam-pling to afford a good opportunity to observe character dif-ferences in the stream network with relatively stable flow conditions, high biological activity and long channel resi-dence time during which in-stream processes, such as photo-oxidation could influence TOC. The low flow conditions are also what the biota experiences most of the time, and favour detection of point-sources of TOC to the stream water net-work, e.g. high concentrations from mires.
The aim of this study is to define spatial patterns and downstream changes in NOM character during summer base flow as well as to examine the relationship to catchment soil, vegetation and topography. With increasing subcatch-ment size, and longer in-stream retention time we hypothe-sized that NOM character would change from headwaters to downstream sites towards lower C:N ratios, lower molecular weights and less aromaticity per TOC (cf. Kothawala et al., 2006; Larson et al., 2007). This is because larger subcatch-ments are more influenced by older groundwater and lakes, in combination with more chemical and biological reactions occurring along the stream network (Pettersson et al., 1994). The presence of large lakes is also expected to have a large affect on the NOM character.
2 Characteristics of the study site
[image:2.595.311.543.62.421.2]The catchment Ottervattsb¨acken (78 km2) is located in the River ¨Ore basin, Northern Sweden (Fig. 1). The catchment elevation ranges from 196 to 370 m a.s.l. with the outlet at 64◦020N and 19◦060E. The headwater (first-order) catch-ments vary in size from 0.11 to 3.4 km2with a median area of 0.81 km2. Downstream sites range in size from 0.61 to 78 km2with a median area of 13 km2. The bedrock consists mainly of biotite-rich gneisses of sedimentary origin; the tills
Fig. 1. The catchment Ottervattsb¨acken (O) is situated in Northern Sweden, with the western branch O1 and the eastern branch O2. Sites not in O1 and O2 are denoted O3. Open circles are sampling sites, for easier visualization only one circle is shown for the three samples taken upstream and downstream at each stream junction. Sites marked with X are samples which were also analyzed for FLD, %HS and C:N, see Methods for more details. The open star is the site with a known stage-discharge relationship. Broad solid lines are surface water.
are mostly silty-sandy to sandy-silty (Ivarsson and Karlsson, 1992). Till is the dominant soil material (>60%) in these catchments, followed by peat (17 to 26%). The most com-mon soil type is podzol with a mean humus layer thickness of 7 cm (Ivarsson and Karlsson, 1992). The riparian zone is of-ten comprised of peat of varying thickness. The mean annual temperature is 1.0◦C, the precipitation is 650 mm (30–45% as snow) with an annual mean discharge of 350 mm and a calculated evapotranspiration of 300 mm (Alexandersson et al., 1991 and subsequent unpublished data).
polyhumic oligotrophic lakes. The dominant forest types are mixed stands of Norway spruce (Picea abies) and Scots pine (Pinus silvestris) with a minor contribution of hardwoods, mainly birch (Betula spp.). There is little overt human influ-ence beyond low-intensity forestry. The landscape has soil frost during winter, but the extent of soil frost varies be-tween years and is heterogeneously distributed in the land-scape (Nyberg et al., 2001).
The Ottervattsb¨acken stream (O) has two main branches, the western Hammonsb¨acken (O1, area 28 km2)and the east-ern Marrab¨acken (O2, area 22 km2) (Fig. 1). About one third of the catchment (30%) is situated above the highest post-glacial coastline at approximately 232 m a.s.l. Minor amounts of fine grained materials, clay-silt, are found down-stream from the highest post-glacial coastline. The area of arable land is small (1.6%) and lies downstream of O1 and O2, and does not influence O1 and O2. The two branches dif-fer slightly with respect to lakes, soils and land-use: O1 has a greater percentage of lake surface coverage (4%) and sand (8%) than O2; which has 2% lakes and 0% sand. The O2 branch has a greater percentage of wetland (25%) and peat (26%) than O1, which has 10% wetland and 19% peat. Head-waters had higher median TOC-concentration (24 mg L−1) than downstream (15 mg L−1). For more details of catchment characteristics see Table 1 in Temnerud and Bishop (2005).
3 Methods
3.1 Sampling
The stream network of the Ottervattsb¨acken catchment was sampled during 19–22 August 2002. Sampling was per-formed approximately 10 m upstream and downstream of al-most every stream junction (90% of those identified on the national 1:50 000 land-use maps and with running waters). A total of 63 sites were included, 19 of which were head-waters. Of these 63 sites, 31 were from O1 (10 of which were headwaters) and 27 were from O2 (9 of which were headwaters). Sites not in either O1 or O2 are denoted O3 (5 sites). On each sampling day, the runoff was measured at a site with a known stage-discharge relationship (H. Ivars-son, personal communication, 2000) close to the outlet of O (marked with a star in Fig. 1). This was complemented with discharge measurements at 41 sites using salt dilution where feasible immediately after the water sample was taken. Dis-charges for the remaining 22 sites were modelled (Temnerud et al., 2007).
3.2 Chemical analysis
Samples were stored in the dark at 4◦C prior to analysis. Analyses were performed within one week, with the excep-tion of those related to XAD fracexcep-tionaexcep-tion. Those more time-consuming analyses were performed within one month. The
samples were run in a random order. The pH was mea-sured without stirring with an electrode designed for low ionic strength waters (Orion model 9272). Both pH and elec-tric conductivity (conductivity meter SDM 2010) were mea-sured at 20◦C (water bath) on the day of sampling. Unfil-tered samples for metal analysis were preserved by addition of concentrated nitric acid (re-distilled from reagent grade acid) to a final concentration of 1% v/v (0.14 M). Metals were analyzed using ICP-MS (Agilent 4500) equipped with an ultrasonic nebulizer (U-6000 AT+, CETAC). Alkalinity was measured according to a slight modified international standard by end-point titration with HCl (0.02 M) to pH 5.6 (international standard is pH 5.4 (EN ISO 9963-2)). The concentrations were quantified with a Shimadzu TOC-V (combustion at 680◦C) within a week after sampling. It has previously been shown that dissolved organic carbon (DOC) and TOC differ by less then 5% in the region of the River ¨Ore (Ivarsson and Jansson, 1994a; K¨ohler et al., 1999), so TOC is essentially identical to DOC in these waters. Please note that samples for TOC and NOM characterization were not acid-ified or frozen. Storage of samples from boreal headwater sites has been found not to affect TOC concentrations when protected from light even when stored at room temperature for 12 days (cf. K¨ohler et al., 2002a).
3.2.1 UV/Vis spectra
UV/Vis absorbance spectra in the range 190–1100 nm (1 nm interval) were recorded with a HP-DAD (diode array detec-tor) 8453 E spectrophotometer using a 1 cm quartz cuvette. Before measurement, the filtered (0.22µm, Osmonics, the polycarbonate filters were pre-rinsed with water) samples were diluted 1:1 with 50 mM sodium phosphate buffer, pH 6.8 (Pettersson et al., 1994). The stability of the instrument was checked by running a reference solution of water after every 10 samples.
Specific Absorption Ratio (SAR) is the ratio between the absorbance at 254 (A254) and 420 (A420) nm (cf. Vogt et
al., 2004). The natural logarithm of the absorbance coeffi-cients between 254–550 nm plotted versus wavelength can be approximated by a linear function (Davies-Colley and Vant, 1987), and the slope,S, is used to characterize NOM (Bertilsson and Tranvik, 2000). The aromaticity can be es-timated spectrophotometrically from the specific ultraviolet absorbance (SUVA) or the molar absorptivity (εa). SUVA is A254normalised by the TOC-concentration (Reckhow et al.,
1990). The molar absorptivity at 280 nm was also used (Chin et al., 1994). The absorbanceA420 was also normalised by
Table 1. Map material used in FA- and PLS-analysis.
Abbreviation Explanation
Land-use map Scale 1:20 000
Arable Arable field (%) Clear cuts Forest clear cuts (%)
Forest Coniferous and mixed forest coverage (%) Lake Lake surface coverage (%)
Open land Other open land (%) Pasture (%) Pasture (%)
Mire Mire (%)
Soil map Scale 1:50 000
Clay Clay, glacial/post glacial clay (%)
Gravel Gravel (%)
Peat Wetland, peat bog and mud (gyttja) (%) Rock Archaean rock (%)
Sand Sand (%)
Silt Silt glacial/postglacial/unspecified (%) Thin soil Thin or incoherent soil surface (%) Till Till with clay content less than 15% (%)
kNN-database
Birch The volume of birch within the subcatchment (m3ha−1) F Age The age of the forest stand (years)
F Height Average height of the forest (m)
Pine The volume of Scots pine within the subcatchment (m3ha−1) Spruce The volume of Norwegian spruce within the subcatchment (m3ha−1)
Constructed variables
Highest coastline Percentage of catchment above the highest postglacial coastline (%) Mean elevation Mean elevation for the subcatchment (m a.s.l.)
Drainage density Stream length divided by area (km−1)
Highest elevation Highest elevation for the subcatchment (m a.s.l.) Lowest elevation Lowest elevation for the subcatchment (m a.s.l.)
Sinuosity Stream length divided by the shortest distance between sites Stream length Stream length for the subcatchment (km)
Slope Slope across the actual stream length (%)
Slope B Slope across the shortest distance between sites (%) Total stream length The total stream length (km)
3.2.2 Gel permeation chromatography
Gel permeation chromatography (GPC) was performed with an HP Series 1100 (HPLC) equipped with a TosoHaas silica gel column (TSKgel G 2000 SW 7.5×300 mm, guard col-umn 7.5×75 mm) and a mobile phase of 50 mM sodium phosphate buffered at pH 6.8. Each sample was filtered (0.22µm) and the filtrate was diluted (in the vials) 1:1 with the mobile phase. The solutions were then run in duplicates, with an injection volume of 100µl, a flow 0.6 ml min−1and a column temperature of 20◦C. The chromatograms were recorded with a diode array detector (HP G1315A DAD, nominal resolution 1 nm, sampling frequency 2 Hz). Ab-sorbance at 254 nm was used to detect NOM. After every
analysis of the Siikajoki standard indicated that these mea-surements were reproducible within an acceptable precision. Median of the ten subsamples (each 50 mg L−1), with robust
coefficient of variation (CV, for explanation see Statistical methods section) in parentheses: GPC-time 18.7 min (0.3), GPC-area 53 mV ml (8.6), GPC-height 13 mV (9.1), Mp 2.22 kDa (1.3),Mn 1.30 kDa (2.5), Mw 2.33 kDa (0.9) and polydispersity 1.79 (3.0).
To measure the GPC fluorescence index, GPCFLD, defined
as the ratio of emission intensity at 450 and 500 nm, excita-tion at 370 nm (McKnight et al., 2001), a fluorescence detec-tor (HP G1321A FLD) was appended to the DAD. The emis-sion spectrum between 400 nm and 550 nm was recorded (step 2 nm and read time 3.1 s per spectrum). The fluores-cence readings were corrected for background Raman scat-tering. The elution time with the highest emission at 400 nm was used.
3.2.3 Analyses at the INSTAAR-lab
Characterization involving XAD-8 fractionation, total dis-solved nitrogen (TDN) analysis, and fluorescence spec-troscopy (Excitation-Emission-Matrix EEM) were con-ducted on a subset of 28 samples (marked with X in Fig. 1) at the University of Colorado Institute of Arctic and Alpine Research laboratory (INSTAAR-lab). All samples analyzed at INSTAAR-lab were filtered through precombusted (475◦C for 4 h) Whatman GF/C glass fibre filters (1.2µm) before further preparation. TDN was analyzed using chemilumi-nescent emission (Antek 9000 N Nitrogen Analyser). 3.2.4 Fluorescence spectra
A Spex FluoroMax-2 fluorospectrophotometer was used for fluorescence measurements. All samples were diluted to 5.0 mg L−1 DOC with water. The samples were excited in the range of 250–400 nm at 15-nm increments. The result-ing emissions were recorded in the range 400–550 nm at 1-nm increments. Variations in xenon lamp intensity were ac-counted for by normalizing the fluorescence signal to a ref-erence signal, the xenon emission peak at 467 nm. The emis-sion spectrometer was calibrated using the emisemis-sion of water at a wavelength of 397 nm after excitation at 350 nm. The in-tensity of the water Raman scatter peak (Ex/Em 275/303 nm) obtained daily was used to normalize the spectra to account for the decay in lamp intensity over time. Fluorescence index (FLD) is the ratio of emission intensity (450 nm:500 nm) at 370 nm-excitation (McKnight et al., 2001).
3.2.5 XAD-8 fractionation
Operationally, humic substances (HS) can be defined as the DOC fractions which adsorb on XAD-8 (a macroporous non-ionic resin) at low pH, and desorb at high pH (e.g. Aiken, 1985). The fractions not adsorbed on the XAD-8 are de-noted non-humic substances (NHS). XAD-8 analysis was
performed according to Malcolm (1991) with some modifi-cations. Samples were acidified with concentrated H3PO4to
pH 2 and sparged for 10 min with He(g) through a glass frit-ted bubbler prior to fractionation. The XAD-8 was replaced with DAX-8, as recommended by Peuravuori et al. (2001). Before each sample run the resin was reconditioned with 0.1 M NaOH at a flow rate of 4 ml min−1 until the eluting solution became alkaline. Then, the column was treated with 0.1 M HCl until acidic. This was repeated two more times. Before analysis, the samples were filtered through pre-combusted Whatman GF/C glass fibre filters (1.2µm) and analyzed for DOC on a Shimadzu TOC-5050A. The same amount of DOC was run on each column. The first bed volume (12 ml) of effluent was labelled the NHS-fraction. The HS-fraction was then eluted by back-flushing the column with at least 60 ml 0.1 M NaOH at a flow rate of 2 ml min−1.
The NHS and HS fractions were weighed, and then analyzed for DOC. The median recovery was 93% (robustCV of 10). 3.3 Map material
To relate NOM-character to catchment character, we used land-use maps on the scale 1:20 000 (SNLS, 2002) and 1:50 000 soil maps (SGU, 2001), along with the kNN-database of vegetation that contains forestry variables esti-mated from Landsat 2000 satellite photos (Reese et al., 2003) (Table 1). The variable “organic soil type” is referred to as “peat” in the study. The percentage of each variable on each catchment from the land-use map and soil map were used in the modelling. In addition to the data read directly from the map, six variables were calculated from the map infor-mation: stream length (km), drainage density (km−1),
sinu-osity, slope (%), percentage above the highest coastline (%) and elevation (m). Drainage density is the ratio of the to-tal length of streams within a catchment to the toto-tal area of the catchment. Sinuosity (a measure of meandering) is given by dividing the stream length with the shortest distance be-tween two sampling sites. A stream with the sinuosity of 1 is completely straight with no bends, and with a ratio over 1.4 the stream has numerous closely spaced bends i.e. very meandering. For more information see Temnerud (2005). 3.4 Statistical methods and tests for transformation of
NOM
As an estimate of variables variability robust coefficient of variation (CV) is used, robust CV = 100 × normalised IQR/median, where IQR is interquartile range (75–25 per-centile), and normalised IQR is IQR multiplied by 0.7413 (PTA, 2006). The factor 0.7413 makes IQR comparable to standard deviation, if the distribution is normal, normalised IQR values would equal standard deviation. Since the data is not normally distributed and there are generally few samples, normalised IQR will be used.
Statistical power analysis was performed using GPOWER (version 2, Erdfelder et al., 1996). The post hoc analysis of the difference in means between headwaters and downstream using the two-tailed Student t-test was run in accuracy mode calculation. H0was that there is no different between
head-water and downstream sites. H1was that there is a difference.
The statistical power (1-β)gives the probability that the hy-pothesis is correctly rejected. Statistical power above 80% indicates that the H0was correctly rejected.
Bootstrap, with replacements, was performed for the pa-rameters that were indicated to have a significant difference between headwaters and downstream sites using Wilcoxon W. Of the 44 downstream sites 19 cases (same number as headwaters) were randomly chosen 1000 times and the ran-domizations were compared to the original headwater val-ues using Student’s t-test. The same procedure was done for the branches O1 and O2. If both the statistical power anal-ysis (>80%) and more than 80% of the t-tests based on the bootstrapping sampling procedure indicate a significant dif-ference between headwater and downstream sites, the differ-ence was deemed to be strong and valid.
Common factor analysis (FA) was performed to check for latent structures between TOC, NOM character and physi-cal parameters, using the oblique (non orthogonal) rotation method Oblimin (δ = 0.6) and Kaiser normalisation (SPSS for Windows v16.02). In FA the variance of a single vari-able is decomposed into common variance that is shared by other variables included in the model and unique variance that is unique to a particular variable (Gauch, 1982). Prin-cipal component analysis (PCA), a similar multivariate pro-cedure, considers the total variance and makes no distinc-tion between common and unique variance (Gauch, 1982). Oblique rotation allows the factors to correlate, if the factors are truly uncorrelated, orthogonal and oblique rotation pro-duces similar results (Costello and Osborne, 2005). Partial least square regression (PLS) was used to check which phys-ical parameters (Table 1) could be use to model TOC and the NOM character (SIMCA for Windows v10.5, Umetrics) (Geladi and Kowalski, 1986). All data were centred by mean normalization and weighted by dividing the variables with the standard deviation prior to PLS. To prevent negative val-ues of predictions and to normalize the distribution of each variable all the variables were natural logarithm transformed. The results of the prediction were tested using cross valida-tion, with three randomly chosen sites omitted 20 times.
The criteria for testing the models were the differences be-tween measured and modelled values. The root mean square error (RMSE) is a measure of the average difference between measured and predicted values. The maximum RMSE for an acceptable model was set to the value of the 5th percentile for the whole data matrix for each variable. Besides the RMSE, we also required an acceptable model to reproduce the ob-served variability. This was evaluated by the slope of the regression line between measured and modelled values. Val-ues between 0.7 and 1.3 were considered to be acceptable. The Pearson correlation coefficient,r, between measured and modelled values is another measure of model performance. Values above 0.6 were considered to indicate a good model. The Pearson correlation for the calibration is denoted as R and for the validation Q. For the models derived using PLS the variance in the data matrix explained by the 1st and 2nd principal component (PC) can be used as a measure of how good the model is. A value above 60% was set as the limit for an acceptable model. In the first model all physical pa-rameters were included, but only variables with significant contribution (α= 0.05, Hotelling T2) to the model were used in the final model for that variable.
3.4.1 Stream junctions
At 14 stream junctions in O, including 7 from branch O1 and 6 from branch O2, the percentage difference between two upstream tributaries and the sampling site immediately below the confluence was determined as the deviation from volume-weighted conservative mixing of the tributaries. Volume-weighted differences in TOC, Fe and Al have been published (Temnerud et al., 2007). A negative difference indicate a de-crease in that variable. The relative differences in catchment size were calculated, the tributary with the smallest catch-ment size divided by the combined size of the two tributaries catchments. The same approach was used for discharge, with the smallest site discharge being compared to the sum of both.
3.4.2 Stream reaches
Fig. 2. Optical properties: UV/Vis data at pH 6.8 and 50 mM NaPO4 (GPC-buffer): (a) SUVA (254 nm/TOC) (b) SVA (420 nm/TOC) (c)S (absorbance 250–550 logarithmic slope) and (d) SAR (254/420 nm) variation with catchment size. Apparent molecular weight from GPC-data at pH 6.8 and 50 mM NaPO4: (e) polydispersity, (f)Mw, (g)Mnand (h)Mpvariation with catch-ment size. See Methods for more details and abbreviations. Data for catchment O, with the branches O1 () and O2 (4), and O3 ().
3.4.3 Lakes
The inputs from all measured streams draining to each lake were compared to the lake outlet. The percentage difference between inlets and outlet were the ratio of the conservative mixing of inlets based on respective discharges. Negative differences indicate a decrease in that variable. Such com-parisons have already been presented for TOC, Fe and Al (Temnerud et al., 2007). Five lakes were investigated in O, three of which were in O1 and one in O2.
4 Results
The weather was warm and sunny, without any rain, during the sampling period. The groundwater table was low, which is common at that time of year. The specific discharge (q) was rather different between the two branches, due to differ-ences in the occurrence of lakes (Temnerud et al., 2007). O1 had a median q of 2.1 L s−1km−2, while in O2 the median value was 0.45 L s−1km−2. Median stream temperature was 17◦C in O1 and 15◦C in O2. The streams had low electric conductivity with a median of 0.003 S m−1.
Fig. 3. Aquatic humic substances (n= 28): (a) Percentage aquatic humic substances (HS) of DOC (%HS), (b) Fluorescence index (FLD) is the ratio of emission intensity (450 nm: 500 nm) at 370 nm-excitation and (c) C:N variation with catchment size. Data for catchment O, with the branches O1 () and O2 (4), and O3 (). See Methods for more details and abbreviations.
4.1 Variability of chemical variables
Considering the whole catchment the robustCV for Fe, Al and TOC were 123, 120 and 80, respectively. GPC-height, -area,A420 andA254 had robustCV’s similar to those for
TOC, with a median of 78. The robustCV (value in paren-theses) for other NOM character measured and pH was in decreasing order: C:N (32), SVA (22), SAR (15),Mn (14), Mw (14), εa (11), polydispersity (10), S (7.1), pH (7.1), SUVA (6.4), Mp (4.9), GPCSUVA (4.4), FLD (4.0), HS%
(3.9), GPCFLD (1.5) and GPC-time (1.0). For each branch,
when the catchment size surpassed approximately 5 km2, the TOC, Fe and Al concentration were less variable (TOC vi-sualized in Fig. 2, Temnerud et al., 2007). The variability in NOM character did not noticeably lessen when the catchment size for each branch surpassed 5 km2(Figs. 2–3). The robust CV was lower at downstream sites compared to headwater sites for q, Fe, Al, SAR,S, SVA,Mn, Mw, polydispersity, GPCSUVA, GPCFLDand FLD (Table 2). For the other NOM
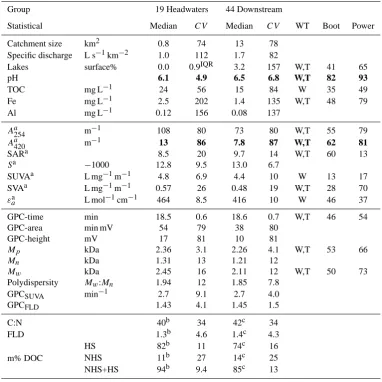
[image:7.595.304.540.68.335.2]Table 2. NOM character and associated parameters for the stream Ottervattsb¨acken (O). Median values with robust coefficient of variation (CV) grouped into headwaters and downstream. Bold values are significance difference with statistical power analysis>80%.
Group 19 Headwaters 44 Downstream
Statistical Median CV Median CV WT Boot Power
Catchment size km2 0.8 74 13 78
Specific discharge L s−1km−2 1.0 112 1.7 82
Lakes surface% 0.0 0.9IQR 3.2 157 W,T 41 65
pH 6.1 4.9 6.5 6.8 W,T 82 93
TOC mg L−1 24 56 15 84 W 35 49
Fe mg L−1 2.5 202 1.4 135 W,T 48 79
Al mg L−1 0.12 156 0.08 137
Aa254 m−1 108 80 73 80 W,T 55 79
Aa420 m−1 13 86 7.8 87 W,T 62 81
SARa 8.5 20 9.7 14 W,T 60 13
Sa −1000 12.8 9.5 13.0 6.7
SUVAa L mg−1m−1 4.8 6.9 4.4 10 W 13 17
SVAa L mg−1m−1 0.57 26 0.48 19 W,T 28 70
εaa L mol−1cm−1 464 8.5 416 10 W 46 37
GPC-time min 18.5 0.6 18.6 0.7 W,T 46 54
GPC-area min mV 54 79 38 80
GPC-height mV 17 81 10 81
Mp kDa 2.36 3.1 2.26 4.1 W,T 53 66
Mn kDa 1.31 13 1.21 12
Mw kDa 2.45 16 2.11 12 W,T 50 73 Polydispersity Mw:Mn 1.94 12 1.85 7.8
GPCSUVA min−1 2.7 9.1 2.7 4.0
GPCFLD 1.43 4.1 1.45 1.5
C:N 40b 34 42c 34
FLD 1.3b 4.6 1.4c 4.3
m% DOC
HS 82b 11 74c 16
NHS 11b 27 14c 25
NHS+HS 94b 9.4 85c 13
Index a denotes absorbance at pH 6.8 and 50 mM NaPO4(GPC-buffer). Index b indicates 17 headwaters and index c indicates 11 downstream sites. Index IQR = normalised interquartile range (since median is null). HS = Humic Substances, NHS = non humic substances. m% DOC = mass percentages HS and NHS of whole-water sample DOC. Entries in column “WT” denotes a significant difference (α= 0.05) between headwater and downstream for respective catchments using Wilcoxon W (W), or Student’s t-test independent sample test assuming unequal variances (T). Boot is bootstrapping with replacement, 100% is all randomizations (1000) that have a significant difference using Student t-test (α= 0.05). Power is statistical power analysis in percentage. For more details see Methods.
4.2 FA- and PLS-analysis
In the factor analysis, the first factor identified was a cluster of NOM character parameters including TOC concentration, absorbance (A254andA420), absorptivity (SUVA, SVA and
εa), most of the apparent molecular weight measurements (GPC-height, GPC-area,Mn,Mw,Mp) and HS% that were positively clustered together along the first factor (Fig. 4a). Hereafter this cluster is termed FAChar1+. The C:N ratio also
fell along this axis, but not as far from the origin. Nega-tively correlated to FAChar1+, at the other end of the first
fac-tor axis, were SAR,S, GPC-time and GPCFLD (FAChar1-).
These clusters were the easiest to identify. At the positive end of the second factor (opposite of FAChar1) were
poly-dispersity and GPCSUVA (Fig. 4a), closer to the origin than
GPCSUVA was FLD. When adding the physical parameters
(Table 1 plus q and catchment size) to the NOM character matrix a different pattern was revealed (FLD, C:N and HS% was omitted from analysis since they made the matrix indef-inite, i.e. the eigenvalues were not positive). Along the first factor forest, lake, thin soil, rock, highest height and q were clustered together with FAChar1−(Fig. 4b). At the other end
Using PLS-models the available physical parameters (lake and mire coverage) were able to predict TOC satisfacto-rily (see Methods for criteria, Fig. 5). None of the NOM-characters were modelled to the same high degree as TOC: this means thatR2, Q2and regression slope between 0.4– 0.5, RMSE above the 5th percentiles for that variable, and that PC1 and PC2 explained between 60–40%. Of the NOM character measured SAR was modelled best (mire and al-titude, Fig. 5), followed by SVA, S, Mw, Mp and HS%. PLS-models did not work out for SUVA,εa,Mn, polydis-persity, GPCSUVA, GPCFLD, FLD and C:N. The significant
parameters that were most common in each PLS-model were (in decreasing order): lake surface coverage, mire cover-age, stream drainage density, forest coverage and altitude. Lake surface coverage itself could explain more than 20% of the variation in SVA, HS%,Mp,Mn,Mw, TOC, SAR and GPC-time. For the last three of these parameters the correla-tion was negative, i.e. with increasing lake surface coverage, TOC, SAR and GPC-time values were lower. Mire surface coverage could also explain over 20% ofA420, SVA, HS%,
SAR and FLD. The last two parameters had negative correla-tions. Forest coverage itself explained more than 20% of the variation in FLD, and the correlation was positive.
4.3 Headwaters compared to downstream
No significant differences between headwater and down-stream sites were observed for the NOM character variables (Figs. 2–3). When headwaters were compared with down-stream sites pH was higher andA420nm lower downstream
(using bootstrapping and power analysis) (Table 2). When examining the stream branches separately branch O1, TOC and Fe showed a significant decrease in concentration down-stream, while pH increased (using bootstrapping and power analysis). No significant changes were observed in O2 for any measured chemical or NOM character variables.
4.4 Stream junctions
When tributaries met, the smaller one was in median 72% of the size of the larger tributary and the specific discharge was 84% of the larger tributary (Table 3). At the four sites with large loss of TOC (volume weighted median difference −33%, from Temnerud et al., 2007), there was a decrease in absorbance (A420 andA254 by−51 and−50%,
respec-tively), GPC-height (−47%) and GPC-area (−46%). The other NOM character changes were small at these four sites, as well as for all NOM character variables at the other ten junctions (change under 10%, mostly under 5% and not sig-nificant), and the direction (+/−) of the character change var-ied (Table 3).
Temnerud et al. 2009
[image:9.595.308.546.71.398.2]875
Fig. 4 876
46
Fig. 4. Common factor analysis plots (based on the structure matrix using Oblimin rotation,δ= 0.6) for (a) TOC and NOM character where the factor 1 explains 52% and factor 2, 12% of the variation and (b) physical parameters (from Table 1 plus specific discharge (q) and catchment size) together with TOC and NOM character where factor 1 explains 30% and factor 2, 12% of the variation. See Methods for more details and abbreviations.
[image:9.595.310.545.519.631.2]Table 3. NOM character and associated parameters for the stream Ottervattsb¨acken (O). Median percentage differences, with robustCV, between the NOM character variables (1) along stream reaches, (2) of tributaries entering a junction compared to that of water downstream from that stream junction and (3) between the water entering a lake and the outlet of that lake. The ratio of the mixing is based on discharge. No significant differences in character were observed below junctions, reaches or lakes. For details of the statistical tests used, see the Methods section.
Group (1) (2) (3)
Reaches 19 Junctions 14 Lakes 5
Numbers Median CV Median CV Median CV
Catchment size km2 4.7 121 72 60 64 291
Specific discharge L s−1km−2 −1.9 −1291 84 125 24 482
pH 0.0 3.5IQR 0.5 222 3.4 128
TOC mg L−1 0.9 709 −3.8 −531 −17 −143
Fe mg L−1 2.8 1334 −12 −313 −24 −313
Al mg L−1 4.1 577 −13 −308 −4.2 −1712
Aa254 m−1 0.9 2380 −6.4 −569 −12 −228
Aa420 m−1 −0.6 -6504 −6.1 −846 −17 −245
SARa 2.1 493 −2.0 −412 5.3 738
Sa −1000 2.0 616 −0.1 −4390 3.0 885
SUVAa L mg−1m−1 −4.5 311 0.5 1878 3.6 263
SVAa L mg−1m−1 0.6 833 1.7 1387 0.2 16815
εaa L mol−1cm−1 0.2 2449 1.5 790 1.8 637
GPC-time min −0.1 −1033 −0.1 −1021 0.8 95
GPC-area min mV −0.9 −3897 −5.5 −838 −10 −271
GPC-height mV −1.6 -2512 −6.9 −662 −12 −226
Mp kDa 0.4 544 0.2 1611 −4.0 −97
Mn kDa 3.0 524 0.7 1402 −6.5 −198
Mw kDa 0.3 2883 0.1 8780 −13 −134 Polydispersity Mw:Mn −1.4 −547 −1.7 −687 −6.9 −124
GPCSUVA min−1 −0.1 −1785 0.2 4054 −1.6 −156
GPCFLD 0.8 668 0.2 906 0.19 2879
Index a denotes absorbance at pH 6.8 and 50 mM NaPO4(GPC-buffer). Index IQR = normalised interquartile range (since median is null). For more details see Methods.
4.5 Stream reaches
The median catchment size increased by 4.7% and specific discharge decreased by−1.9%, along stream reaches (Ta-ble 3). The median distance between sites along stream reaches was 661 m. For NOM character parameters the per-cent changes along reaches were small (under 10%, mostly under 5% and not significant), and the direction (+/−) of the character change varied (Table 3). Four reaches had increases in both TOC concentration (median 35%) and flux (96%) that were more than 10% (Temnerud et al., 2007). These reaches also had increases in absorbance (median 40% forA420and
A25436%) and in GPC-height (19%). At two reaches there
were decreases in TOC concentration (−28%) and small in-creases in flux (10%) (Temnerud et al., 2007). These also had decreases in absorbance (−34% forA420 andA254−29%),
GPC-height (−25%) and GPC-area (−22%). At those six stream reaches just mentioned no other large changes were observed in NOM character.
4.6 Lakes
The increase in catchment size between the incoming streams and the outlet of each lake was in median 64%, while specific discharge increased by 24%. Downstream from the lakes the concentration was less but the flux increased for Al, Fe and TOC (Temnerud et al., 2007). For most NOM character pa-rameters the percent changes at lakes were small (under 10%, mostly under 5% and not significant), and the direction (+/−) of the character change varied (Table 3). Exceptions were the following parameters that had roughly the same percentage decreases (∼ −14%): absorbance (A254 andA420),
5 Discussion
With increasing subcatchment size, and longer hydraulic re-tention time, we hypothesized that if the NOM character changes from headwaters to downstream sites it would re-sult in lower C:N ratio, lower molecular weight and less aromaticity per TOC. Using both bootstrapping analysis and power analysis no significant differences in the character of NOM were detected between headwaters and downstream sites in O (Table 2). Instead we were able to identify at which catchment size (>5–10 km2) it is possible to identify NOM character values that are representative for the average NOM that is mobilized in this stream network. If the mobilization mechanism of NOM of specific character is of interest then a detailed sampling campaign as this one may help to identify landscape mosaics. If instead the average NOM character of a larger landscape is to be obtained, sampling of NOM at small streams is of little value and the sampling effort should be concentrated on the higher order streams.
The variation in Fe, Al and TOC concentration was also more than twice (robust CV range 123 to 80) the varia-tion compared to all measured NOM characteristics not di-rectly related to TOC concentration (range 32 to 1). Earlier work on TOC concentrations had found declines along the O1 branch, but not on the O2 branch (Temnerud and Bishop, 2005; Temnerud et al., 2007). There were significant down-stream increases in pH along O and the branch O1, while A420decreased in O and TOC, Fe, C:N,A254 andA420
de-creased downstream along O1. Lack of powerful significant differences in many NOM characters between headwater and downstream along both O1 and O2 is an initial suggestion that in-stream processes are not shaping the boreal landscape variation of NOM character at the mesoscale (Figs. 2–3). We speculate that the cause of some changes in one branch but not the other was associated with the significant decrease of TOC and Fe concentration in lakes, since there were more lakes higher up in the O1 stream network than along O2. We do not find any support, either in our data or in the literature (e.g. Lara et al., 1998; K¨ohler et al., 2002a), for photochemi-cal breakdown of NOM along stream reaches or interactions with the hyporheic zones in first order boreal streams, but they can not be ruled out either. However, soil water that just enters the stream is more sensitive to photochemical break-down of NOM (K¨ohler et al., 2002a). The residence time of TOC in surface water is much higher in the catchments with lakes.
5.1 Comparison of the NOM character
The range of character observed on O is consistent with val-ues from other studies in the boreal zone. The valval-ues ofS (median 13) and SAR (median 9.5) are in line with those found by earlier studies (Blough and Green, 1995; Vogt et al., 2004). The SUVA (median 4.6) in the present study is similar compared to other studies which usually report
values between 4–5 (Pettersson et al., 1994; Vogt et al., 2004). Data from 11 large catchments (catchment size 21– 2939 km2) in the River ¨Ore basin, sampled at 5 occasions (C. Pettersson, personal communication, 2002) were ana-lyzed for SUVA and %HS using similar methods as in this study. Due to the seasonal variation in this region (Ivars-son and Jans(Ivars-son, 1994b), data from Petter(Ivars-son’s (2002) sam-pling in August 1995 was chosen for comparison (TOC 5 to 11 mg L−1, SUVA 4.4 to 4.9, %HS 79 to 89%). These Au-gust data indicate no clear character change with catchment size either.
The results from our study could have been different if we had sampled at high flow. The detailed information nec-essary for a quantitative and meaningful interpretation of varying the sources of water during high flow however is not available for our study. However an indication of how this flow variation affects character can be found in a study from this region evaluating the temporal variation of SUVA and A254/A365(similar to SAR), in nine different catchments
(with one lake) ( ˚Agren et al., 2008). SUVA was high in mire streams and decreased during spring flood, forest streams had lower SUVA which increased during spring flood compared to base flow (winter and summer). The opposite pattern was observed for the absorbance ratio A254/A365. The ratio was
higher in forest streams and increased during spring flood in forest streams. Mire streams had lower absorbance ratio and it increased during spring flood. These observations of SUVA and A254/A365could be coupled to temporal variation
in molecular weight (Scott et al., 2001) and different tempo-ral responses were found in mire and forest streams. Thus while there were distinct changes in TOC concentration and NOM character as flow rates changed, the spatial variation of TOC (Buffam et al., 2008) and to some extent even NOM character ( ˚Agren et al., 2008); has been found to be less dur-ing high discharge situations than durdur-ing low flow.
5.2 NOM character clusters
In most comparisons, A420, A254, GPC-height and -area
showed the same spatial pattern as TOC, such as at head-water vs. downstream sites, stream junctions, reaches and lakes. These analyses are essentially measuring the same quantity, the concentration of TOC. In this study SAR and S positively correlate with GPC-time and negatively with SUVA, SVA, εa, Mn, Mw, Mp polydispersity and HS% (Fig. 4a). This suggests that low SAR is expected for NOM with high molecular weight, which is consistent with other studies (Hautala et al., 2000).
Weishaar et al. (2003) observed a correlation between SUVA and the degree of aromaticity, measured by13C NMR. Peuravuori and Pihlaja (1997) concluded thatεa correlated better to aromaticity than SUVA. In this study SUVA, εa and SVA are all used to estimate the degree of aromaticity. An increase in SVA could reflect a less aromatic and more aliphatic character of the NOM (Vogt et al., 2004). C:N and FLD are not clustered close by each other (Fig. 4a), although they are both an estimate of the degree of terrestrially derived NOM. Higher values for C:N indicate a more terrestrial ori-gin (approximately>30), while lower values indicate a more aquatic origin of the organic matter (Campbell et al., 2000; Lovett et al., 2000). In this study median C:N was 41, in-dicating most NOM was terrestrial. The FLD ratio in this study indicates that most of the TOC in the streams is terres-trially derived (median 1.34), the same level of FLD (median 1.30) as observed by McKnight et al. (Table 2, 2001) in 4 watercourses in the USA. Higher FLD (∼1.9) reflect a more aquatic derived NOM. It is interesting to note that FLD and GPCFLD were clustered together (Fig. 4a), while GPCSUVA
is orthogonal to SUVA in Fig. 4a.
5.3 Transformations of NOM
The present study did not indicate any systematic NOM char-acter change along the stream reaches. This also fits with the idea that in-stream changes are not large. Kothawala et al. (2006) and Wu et al. (2007) found that the NOM char-acter changed at beaver ponds but were stable downstream from the ponds. The theoretical hydraulic retention time in-stream was estimated to one day during this sampling pe-riod (with very low specific discharge), from headwater to the outlet of O (Temnerud et al., 2007). At higher flows, the residence times will be even shorter. The riparian zone was often shaded by forest. This, in combination with short re-tention time, limits the possibility of solar radiation affecting the NOM character along stream reaches. It has been argued that in-stream processes begins to dominate over the TOC inputs in watercourses larger than stream order 6 (Naiman et al., 1987; Ford et al., 1990). The outlet in Ottervattsb¨acken is stream order 4.
At sites with longer retention time, lakes with TOC con-centration (and absorbance, GPC-time and -area) decrease (>10%), the only decrease larger then 10% in NOM charac-ter was forMw but this was not significant. In lakes, biolog-ical transformations as well as photochembiolog-ical breakdown of NOM have more time to act (Algesten et al., 2004). Solar radiation could effect the utilization of NOM, and influence different size classes of NOM in different ways (Brisco and Ziegler, 2004). The small change in NOM character could result from a combination of chemical precipitation, solar ra-diation and biological transformation but their combined ef-fect does not significantly influence the NOM character in this study.
At sites with fast mixing zones such as stream junctions, no change in NOM character was observed (Table 3), not even at the four sites which showed decreases of more than 30% in TOC. The factor analysis was made separately on the differences above and below stream junctions, reaches and lakes (data not shown). These showed essentially simi-lar clusters of NOM character at junctions and reaches as for all 63 sites, but above and below lakes, there were differences compared to the others. The lack of significant difference be-tween headwater and downstream sites, in combination with the different clusters of NOM character for stream junctions, reaches and lakes, indicate that either there were no strong in-stream processes in the catchment or that the processes at stream junctions, reaches and lakes even out their effect on NOM character at the mesoscale.
5.4 Mosaic of the landscape
As mentioned in the Introduction, lake surface coverage was one of the most important factors governing TOC, but this holds true only to a smaller degree for the NOM character. The presence of lakes in O1 has a significant effect on the concentration of TOC and Fe, but only for one of the NOM character measures (C:N) not directly related to TOC con-centration. Another unexpected feature was the lack of sig-nificant decrease in absorptivity (SUVA, SVA andεa), es-pecially downstream from the lakes (Meili, 1992; Larson et al., 2007). Although the lakes in the catchments are polyhu-mic both TOC and absorbance (A254andA420) were lower
below the lakes (the absorbance for higher wavelengths de-creasing more), absorbance decreased just slightly more rela-tive to TOC, leading to small changes in absorptivity (SUVA andεa).
found to correlate to absorbance ratio (A254/A365). That
ab-sorbance ratio is similar to SAR in this study where SAR was modelled better by mire coverage than forest (as in Berggren et al., 2007). The sampling was done during a dry sum-mer, and forest areas contribute more stream water during wet situations/high discharge (K¨ohler et al., 2008; ˚Agren et al., 2008).
Lakes increased the specific discharge (Fig. 4b), but q is also influenced by mires (mire is negatively correlated to q in Fig. 4b). The spatial variations of the very low specific dis-charge were correlated with the NOM character (absorptivity and C:N) but not with the TOC-concentration in the mire rich branch O2. This would be consistent with an older TOC at lower flow, with lower SUVA and C:N (Hood et al., 2006). Mires have also been found to exhibit a temporal variation in the influence on the molecular weight in streams, with higher apparent molecular weight during summer (Scott et al., 2001). During the dry summer 2002 there was a decrease in specific discharge (power analysis 76% and bootstrapping 48%) between headwaters and downstream sites along O2, which coincided with decreases in SUVA, SVA andεa, as well as for C:N, but not in molecular weight. However, no systematic decrease in absorptivity was observed along stream reaches in O2.
TOC concentration was better modelled by map informa-tion than NOM character in this study, which is similar to the findings of Frost et al. (2006). We were not able to create sat-isfactory PLS models of SUVA andεa, though PLS-models worked out better for SVA in O. To some degree this could be due to smaller variation (robustCV) in SUVA andεa com-pared to SVA (Table 2). Mire and forest coverage are the second most important factors in PLS-modelling after lakes. In this boreal landscape these three factors (lakes, forest and mires) are the dominant landscape features and have been shown to govern TOC in watercourses (Bishop et al., 2004; Laudon et al., 2004), SUVA and A254/A365 ( ˚Agren et al.,
2008), as well as the bioavailable fraction of DOC (Berggren et al., 2007). It is our belief that if we could model TOC and NOM character in the headwaters we could better model NOM character downstream, where water usually is used by society (e.g. for drinking purposes).
6 Conclusions
The sampling period during summer with very low specific discharge provided a good opportunity to observe the influ-ence of different boreal landscape elements on the charac-ter of NOM. No significant changes were observed in most NOM characteristics between headwaters and downstream. The variability of Fe, Al and TOC concentration was more than twice of that of NOM character measures, such as C:N and SAR. At stream junctions, along stream reaches, and up-stream/downstream lakes, NOM character changes were less than 10% relative to what would be predicted by
conserva-tive mixing, even at those sites which had TOC decreases of greater than 10%. The lack of significant downstream changes in NOM character could be due to lack of strong in-stream processes or that processes (in combination with inputs of new NOM downstream) at these different stream junctions, reaches and lakes affect NOM character in differ-ent ways so their effects even out. Even though there are no consistent downstream trends, the variability that does ex-ist derives from the mosaic of landscape elements (the mix of water originating from lakes, forest soil and mires) that provides a range of NOM characteristics to a boreal stream network where there are small net in-stream changes in char-acter at some stream reaches, junctions and lakes.
Acknowledgements. Financial support for this research was provided by the Knowledge Foundation, and Johan’s travel to USA was supported by The Royal Swedish Academy of Sciences. We are very grateful for Diane McKnight giving us the opportunity to use the INSTAAR-lab; especially Rose Cory and Kurt Chowanski are deeply appreciated for their expert help in the laboratory. We thank our fellow collaborators for excellent field- and laboratory work: Rose Cory, Tobias Eriksson, Evastina Grahn, Matthias Heinz, Ulf Juto, Anna Stenberg and Rasmus Sørensen. Many thanks also to Mats Jansson, and co-workers, as well as Anders L¨ofgren with family for making it possible to use the “ ¨Ortr¨ask laboratory facilities”. Earlier drafts of the manuscript improved after discussions with Ishi Buffam. Catharina Pettersson is acknowledged for sharing her data with us and Ulf Grandin for statistical advice.
Edited by: A. Ghadouani
References
˚
Agren, A., Buffam, I., Jansson, M., and Laudon, H.: Importance of seasonality and small streams for the landscape regulation of dissolved organic carbon export, J. Geophys. Res.-Biogeo., 112, G03003, doi:10.1029/2006JG000381, 2007.
˚
Agren, A., Buffam, I., Berggren, M., Bishop, K., Jansson, M., and Laudon, H.: Dissolved organic carbon characteristics in bo-real streams in a forest-wetland gradient during the transition between winter and summer, J. Geophys. Res.-Biogeo., 113, G03031, doi:10.1029/2007JG000674, 2008.
Aiken, G. R.: Isolation and concentration techniques for aquatic humic substances, in: Humic Substances in Soil, Sediment, and Water, edited by: Aiken, G. R., McKnight, D. M., Wershaw, R. L., and MacCarthy, P., John Wiley, New York, USA, 363–385, 1985.
Alexandersson, H., Karlstr¨om, C., and Larsson-McCann, S.: Tem-peraturen och nederb¨orden i Sverige. Referensnormaler. (Tem-perature and precipitation in Sweden 1961–90, Reference nor-mals, in Swedish with an English summary), Swedish rological and Hydrological Institute, Norrk¨opingReport Meteo-rologi nr 81, 88, 1991.
Baker, A., and Spencer, R. G. M.: Characterization of dissolved organic matter from source to sea using fluorescence and ab-sorbance spectroscopy, Sci. Total Environ., 333, 217–232, 2004. Berggren, M., Laudon, H., and Jansson, M.: Landscape regula-tion of bacterial growth efficiency in boreal freshwaters, Glob. Biogeochem. Cycle, 21, GB4002, doi:10.1029/2006GB002844, 2007.
Bertilsson, S., Stepanauskas, R., Cuadros-Hansson, R., Graneli, W., Wikner, J., and Tranvik, L.: Photochemically induced changes in bioavailable carbon and nitrogen pools in a boreal watershed, Aquat. Microb. Ecol., 19, 47–56, 1999.
Bertilsson, S. and Tranvik, L. J.: Photochemical transformation of dissolved organic matter in lakes, Limnol. Oceanogr., 45, 753– 762, 2000.
Bishop, K., Seibert, J., K¨ohler, S., and Laudon, H.: Resolving the Double Paradox of rapidly mobilized old water with highly vari-able responses in runoff chemistry, Hydrol. Process., 18, 185– 189, 2004.
Blough, N. V., and Green, S. A.: Spectroscopic characteristics and remote sensing of nonliving organic matter, in: Role of Nonliv-ing Organic Matter in the Earth’s Carbon Cycle. Report from the Dahlem Workshop in Berlin 1993, 12–17 September, edited by: Zepp, R. G. and Sonntag, C., Environmental Sciences Research Report ES 16, John Wiley, Chichester, UK, 23–45, 1995. Bourbonniere, R. A.: Distribution pattern of dissolved organic
matter fractions in natural waters from eastern Canada, Org. Geochem., 14, 97–107, 1989.
Brisco, S. and Ziegler, S.: Effects of solar radiation on the uti-lization of dissolved organic matter (DOM) from two headwater streams, Aquat. Microb. Ecol., 37, 197–208, 2004.
Buffam, I., Laudon, H., Seibert, J., M¨orth, C.-M., and Bishop, K.: Spatial heterogeneity of the spring flood acid pulse in a boreal stream network, Sci. Total Environ., 407, 708–722, 2008. Campbell, J. L., Hornbeck, J. W., McDowell, W. H., Buso, D. C.,
Shanley, J. B., and Likens, G. E.: Dissolved organic nitrogen budgets for upland, forested ecosystems in New England, Bio-geochemistry, 49, 123–142, 2000.
Chin, Y. P., Aiken, G., and Oloughlin, E.: Molecular-weight, poly-dispersity, and spectroscopic properties of aquatic humic sub-stances, Environ. Sci Technol., 28, 1853–1858, 1994.
Costello, A. B., and Osborne, J. W.: Best practices in exploratory factor analysis: four recommendations for getting the most from your analysis, Practical Assessment, Res. Evaluat., 10, 1–9, 2005.
Davies-Colley, R. J. and Vant, W. N.: Absorption of light by yellow substances in freshwater lakes, Limnol. Oceanogr., 32, 416–425, 1987.
Dillon, P. J., and Molot, L. A.: Effect of landscape form on export of dissolved organic carbon, iron, and phosphorus from forested stream catchments, Water Resour. Res., 33, 2591-2600, 1997. Ephraim, J. H., Pettersson, C., and Allard, B.: Correlations between
acidity and molecular size distributions of an aquatic fulvic acid, Environ. Int., 22, 475-483, 1996.
Erdfelder, E., Faul, F., and Buchner, A.: GPOWER: A general power analysis program, Behav. Res. Meth. Ins. C., 28, 1–11, 1996.
Fisher, H., Sachse, A., Steinberg, C. E. W., and Pusch, M.: Dif-ferential retention and utilization of dissolved organic carbon by bacteria in river sediments, Limnol. Oceanogr., 47, 1702–1711,
2002.
Ford, T. E., Ford, S. A., Lock, M. A., and Naiman, R. J.: Dissolved organic-carbon concentrations and fluxes along the Moisie River, Quebec, Freshw. Biol., 24, 35–42, 1990.
Frost, P. C., Larson, J. H., Johnston, C. A., Young, K. C., Maurice, P. A., Lamberti, G. A., and Bridgham, S. D.: Landscape predic-tors of stream dissolved organic matter concentration and physic-ochemistry in a Lake Superior river watershed, Aquat. Sci., 68, 40–51, 2006.
Gauch Jr., H. G. : Multivariate Analysis in Community Ecology, Cambridge studies in ecology ; 1, Cambridge University Press, Cambridge, UK, 298 pp., 1982.
Geladi, P., and Kowalski, B. R.: Partial least-squares regression - a tutorial, Anal. Chim. Acta, 185, 1–17, 1986.
Hautala, K., Peuravuori, J., and Pihlaja, K.: Measurements of aquatic humus content by spectroscopic analyses, Water Res., 34, 246–258, 2000.
Heikkinen, K.: Organic matter, iron and nutrient transport and na-ture of dissolved organic matter in the drainage basin of a boreal humic river in northern Finland, Sci. Total Environ., 152, 81–89, 1994.
Hood, E., Williams, M. W., and McKnight, D. M.: Sources of dis-solved organic matter (DOM) in a Rocky Mountain stream using chemical fractionation and stable isotopes, Biogeochemistry, 74, 231–255, 2005.
Hood, E., Gooseff, M. N., and Johnson, S. L.: Changes in the char-acter of stream water dissolved organic carbon during flushing in three small watersheds, Oregon, J. Geophys. Res.-Biogeosci., 111, G01007, doi:10.1029/2005JG000082, 2006.
Hope, D., Billett, M. F., and Cresser, M. S.: A review of the export of carbon in river water – fluxes and processes, Environ. Pollut., 84, 301–324, 1994.
Ivarsson, H., and Karlsson, L.-I.: Geological and geochemical con-ditions in the River ¨Ore drainage basin, Northern Sweden, Geog-raphy Department, Ume˚a University, Ume˚aGerum report nr.15, 1992.
Ivarsson, H., and Jansson, M.: Regional variation of dissolved or-ganic matter in running waters in central Northern Sweden, Hy-drobiologia, 286, 37–51, 1994a.
Ivarsson, H., and Jansson, M.: Temporal variations in the concen-tration and character of dissolved organic matter in a highly col-ored stream in the coastal zone of Northern Sweden, Arch. Hy-drobiol., 132, 45–55, 1994b.
K¨ohler, S., Hruˇska, J., and Bishop, K.: Influence of organic acid site density on pH modelling of Swedish lakes, Can. J. Fish. Aquat. Sci., 56, 1461–1470, 1999.
K¨ohler, S., Buffam, I., Jonsson, A., and Bishop, K.: Photochemical and microbial processing of stream and soilwater dissolved or-ganic matter in a boreal forested catchment in Northern Sweden, Aquat. Sci., 64, 269–281, 2002a.
K¨ohler, S., Hruˇska, J., J¨onsson, J., L¨ovgren, L., and Lofts, S.: Eval-uation of three organic equilibrium models using an in-situ titra-tion of an organic rich stream in Northern Sweden., Water Res., 36, 4487–4496, 2002b.
Kothawala, D. N., Evans, R. D., and Dillon, P. J.: Changes in the molecular weight distribution of dissolved organic carbon within a Precambrian shield stream, Water Resour. Res., 42, W05401, doi:10.1029/2005WR004441, 2006.
Lara, R. J., Rachold, V., Kattner, G., Hubberten, H. W., Guggen-berger, G., Skoog, A., and Thomas, D. N.: Dissolved organic matter and nutrients in the Lena River, Siberian Arctic: Charac-teristics and distribution, Mar. Chem., 59, 301–309, 1998. Larson, J. H., Frost, P. C., Zheng, Z., Johnston, C. A., Bridgham,
S. D., Lodge, D. M., and Lamberti, G. M.: Effects of upstream lakes on dissolved organic matter in streams, Limnol. Oceanogr., 52, 60–69, 2007.
Laudon, H., K¨ohler, S., and Buffam, I.: Seasonal TOC exports from seven boreal catchments in Northern Sweden, Aquat. Sci., 66, 223–230, 2004.
Lovett, G. M., Weathers, K. C., and Sobczak, W. V.: Nitrogen satu-ration and retention in forested watersheds of the Catskill Moun-tains, New York, Ecol. Appl., 10, 73–84, 2000.
Malcolm, R. L.: Factors to be considered in the isolation and char-acterization of aquatic humic substances, in: Humic Substances in the Aquatic and Terrestrial Environment. Proceedings of an International Symposium in Link¨oping, Sweden, August 21–23, 1989, edited by: Allard, B., Bor´en, H., and Grimvall, A., Lecture Notes in Earth Sciences 33, Springer-Verlag, Berlin, Germany, 9–36, 1991.
McKnight, D. M., Boyer, E. W., Westerhoff, P. K., Doran, P. T., Kulbe, T., and Andersen, D. T.: Spectrofluorometric characteri-zation of dissolved organic matter for indication of precursor or-ganic material and aromaticity., Limnol. Oceanogr., 46, 38–48, 2001.
Meier, M., Chin, Y. P., and Maurice, P.: Variations in the compo-sition and adsorption behavior of dissolved organic matter at a small, forested watershed, Biogeochemistry, 67, 39–56, 2004. Meili, M.: Sources, concentrations and characteristics of organic
matter in softwater lakes and streams of the Swedish forest re-gion., Hydrobiologia, 229, 23–41, 1992.
Mulholland, P. J.: Large-scale patterns in dissolved organic carbon concentration, flux, and sources, in: Aquatic Ecosystems: Inter-activity of dissolved organic matter, edited by: Findlay, S. and Sinsabaugh, R., Academic Press, San Diego, USA, 139–159, 2003.
Naiman, R. J., Melillo, J. M., Lock, M. A., Ford, T. E., and Reice, S. R.: Longitudinal patterns of ecosystem processes and commu-nity structure in a subarctic river continuum, Ecology, 68, 1139– 1156, 1987.
Nyberg, L., St¨ahli, M., Mellander, P.-E., and Bishop, K. H.: Soil frost effects on soil water and runoff dynamics along a boreal transect: 1 Field investigations, Hydrol. Process., 15, 909–926, 2001.
Pettersson, C., Ephraim, J., and Allard, B.: On the composition and properties of humic substances isolated from deep groundwater and surface waters, Org. Geochem., 21, 443–451, 1994. Pettersson, C., Allard, B., and Bor´en, H.: River discharge of
hu-mic substances and huhu-mic-bound metals to the Gulf of Bothnia, Estuar. Coast. Shelf Sci., 44, 533–541, 1997.
Peuravuori, J., and Pihlaja, K.: Molecular size distribution and spectroscopic properties of aquatic humic substances, Anal. Chim. Acta, 337, 133–149, 1997.
Peuravuori, J., Ingman, P., Pihlaja, K., and Koivikko, R.:
Compar-isons of sorption of aquatic humic matter by DAX-8 and XAD-8 resins from solid-state C-13 NMR spectroscopy’s point of view, Talanta, 55, 733–742, 2001.
PTA: Guide to Proficiency Testing Australia, Proficiency Testing Australia, Silverwater, 27 pp, 2006.
Reckhow, D. A., Singer, P. C., and Malcolm, R. L.: Chlorination of humic materials: Byproduct formation and chemical interpreta-tions., Environ. Sci Technol., 24, 1655–1664, 1990.
Reese, H., Nilsson, M., Granqvist Pahl´en, T., Hagner, O., Joyce, S., Tingel¨of, U., Egberth, M., and Olsson, H.: Countrywide esti-mates of forest variables using satellite data and field data from the national forest inventory, Ambio, 33, 542–548, 2003. Schumacher, M., Christl, I., Vogt, R. D., Barmettler, K., Jacobsen,
C., and Kretzschmar, R.: Chemical composition of aquatic dis-solved organic matter in five boreal forest catchments sampled in spring and fall seasons, Biogeochemistry, 80, 263–275, 2006. Schwarzenbach, R. P., Gschwend, P. M., and Imboden, D. M.:
En-vironmental Organic Chemistry, 2 edn., John Wiley, Hoboken, USA, 1313 pp., 2003.
Scott, M. J., Jones, M. N., Woof, C., Simon, B., and Tipping, E.: The molecular properties of humic substances isolated from a UK upland peat system. A temporal investigation, Environ. Int., 27, 449–462, 2001.
SGU: Soil map, 1:50 000, The Geological Survey of Sweden, Upp-sala, Sweden, 2001.
SNLS: Land-use map, scale 1:20 000, The Swedish National Land Survey, G¨avle, 2002.
Stumm, W. and Morgan, J. J.: Aquatic Chemistry: Chemical Equi-libria and Rates in Natural Waters., 3 edn., John Wiley, New York, USA, 1022 pp., 1996.
Swift, R. S.: Molecular weight, size, shape, and charge character-istics of humic substances: Some basic considerations, in: Hu-mic Substances II, edited by: Hayes, M. H. B., MacCarthy, P., Malcolm, R. L., and Swift, R. S., John Wiley, New York, USA, 451–465, 1989.
Temnerud, J.: Spatial Variation of Dissolved Organic Carbon along Streams in Swedish Boreal Catchments, Doctoral thesis, Depart-ment of Natural Sciences, ¨Orebro University, ¨Orebro, 41 pp., 2005.
Temnerud, J., and Bishop, K.: Spatial variation of streamwater chemistry in two Swedish boreal catchments: Implications for environmental assessment, Environ. Sci Technol., 39, 1463– 1469, 2005.
Temnerud, J., Seibert, J., Jansson, M., and Bishop, K.: Spatial varia-tion in discharge and concentravaria-tions of organic carbon in a catch-ment network of boreal streams in Northern Sweden, J. Hydrol., 342, 72–87, 2007.
Vannote, R. L., Minshall, G. W., Cummins, K. W., Sedell, J. R., and Cushing, C. E.: The river continuum concept, Can. J. Fish. Aquat. Sci., 37, 130–137, 1980.
Vogt, R. D., Akkanen, J., Andersen, D. O., Br¨uggemann, R., Chat-terjee, B., Gjessing, E., Kukkonen, J. V. K., Larsen, H. E., Lus-ter, J., Paul, A., Pflugmacher, S., Starr, M., Steinberg, C. E. W., Schmitt-Kopplin, P., and Zsolnay, ´A.: Key site variables govern-ing the functional characteristics of Dissolved Natural Organic Matter (DNOM) in Nordic forested catchments, Aquat. Sci., 66, 195–210, 2004.
Weishaar, J., Aiken, G., Bergamaschi, B. A., Fram, M. S., Fujii, R., and Mopper, K.: Evaluation of specific UV absorbance as an indicator of the chemical content of dissolved organic carbon, Environ. Sci Technol., 37, 4702–4708, 2003.
Wetzel, R. G.: Limnology. Lake and River Ecosystems, 3 edn., Aca-demic Press, London, UK, 1006 pp., 2001.