© Author(s) 2009. This work is distributed under the Creative Commons Attribution 3.0 License.
Earth System
Sciences
Modeling nutrient in-stream processes at the watershed scale using
Nutrient Spiralling metrics
R. Marc´e1,2and J. Armengol2
1Catalan Institute for Water Research (ICRA), Edifici H2O, Parc Cient´ıfic i Tecnol`ogic de la Universitat de Girona,
17003 Girona, Spain
2Fluvial Dynamics and Hydrological Engineering (FLUMEN), Department of Ecology, University of Barcelona,
Diagonal 645, 08028 Barcelona, Spain
Received: 17 November 2008 – Published in Hydrol. Earth Syst. Sci. Discuss.: 23 January 2009 Revised: 29 June 2009 – Accepted: 29 June 2009 – Published: 6 July 2009
Abstract. One of the fundamental problems of using large-scale biogeochemical models is the uncertainty involved in aggregating the components of fine-scale deterministic mod-els in watershed applications, and in extrapolating the re-sults of field-scale measurements to larger spatial scales. Al-though spatial or temporal lumping may reduce the problem, information obtained during fine-scale research may not ap-ply to lumped categories. Thus, the use of knowledge gained through fine-scale studies to predict coarse-scale phenom-ena is not straightforward. In this study, we used the nutri-ent uptake metrics defined in the Nutrinutri-ent Spiralling concept to formulate the equations governing total phosphorus in-stream fate in a deterministic, watershed-scale biogeochem-ical model. Once the model was calibrated, fitted phospho-rus retention metrics where put in context of global patterns of phosphorus retention variability. For this purpose, we calculated power regressions between phosphorus retention metrics, streamflow, and phosphorus concentration in water using published data from 66 streams worldwide, including both pristine and nutrient enriched streams.
Performance of the calibrated model confirmed that the Nutrient Spiralling formulation is a convenient simplifica-tion of the biogeochemical transformasimplifica-tions involved in to-tal phosphorus in-stream fate. Thus, this approach may be helpful even for customary deterministic applications work-ing at short time steps. The calibrated phosphorus retention metrics were comparable to field estimates from the study watershed, and showed high coherence with global patterns of retention metrics from streams of the world. In this sense, the fitted phosphorus retention metrics were similar to field values measured in other nutrient enriched streams. Analy-sis of the bibliographical data supports the view that nutri-ent enriched streams have lower phosphorus retnutri-ention
effi-Correspondence to: R. Marc´e ([email protected])
ciency than pristine streams, and that this efficiency loss is maintained in a wide discharge range. This implies that both small and larger streams may be impacted by human activ-ities in terms of nutrient retention capacity, suggesting that larger rivers located in human populated areas can exert con-siderable influence on phosphorus exports from watersheds. The role of biological activity in this efficiency loss showed by nutrient enriched streams remained uncertain, because the phosphorus mass transfer coefficient did not show consistent relationships with streamflow and phosphorus concentration in water. The heterogeneity of the compiled data and the possible role of additional inorganic processes on phospho-rus in-stream dynamics may explain this. We suggest that more research on phosphorus dynamics at the reach scale is needed, specially in large, human impacted watercourses.
1 Introduction
954 R. Marc´e and J. Armengol: Modeling nutrient in-stream processes By contrast, watershed-scale deterministic models can
work at any time-scale, and they describe transport and loss processes in detail with mathematical formulations account-ing for the spatial and temporal variations in sources and sinks in watersheds. These advantages, and the increasing computing power available to researchers, have prompted the development of many of such models (e.g. HSPF, Bicknell et al., 2001; SWAT, Srinivasan et al., 1993; INCA, White-head et al., 1998; AGNPS, Young et al., 1995; RIVER-STRAHLER, Garnier et al., 1995; MONERIS, Behrendt et al., 2000). On the other hand, the complexity of determin-istic models often creates intensive data and calibration re-quirements, which generally limits their application in large watersheds. Deterministic models also lack robust measures of uncertainty in model coefficients and predictions, although recent developments for hydrological applications can be used in biogeochemical models as well (Raat et al., 2004). Nonetheless, deterministic models are abstractions of reality that can include unrealistic assumptions in their formulation. A frequently ignored problem when using watershed-scale models is the uncertainty involved in aggregating the com-ponents of fine-scale deterministic models in watershed ap-plications (Rastetter et al., 1992), and in extrapolating the results of field-scale measurements to larger spatial scales. This is important because the ability to use the knowledge gained through fine-scale studies (e.g. nutrient uptake rate for different river producers communities, nutrient fate in the food web, and so on) to predict coarse-scale phenomena (e.g. the overall nutrient export from watersheds) is highly de-sirable. However, incorporating interactions between many components in a big-scale model can be cumbersome, sim-ply because the number of possible interactions may be very large (Beven, 1989). The usual strategy to avoid a model in-cluding precise formulations for each interaction (and thus the counting of thousands of parameters) is to lump com-ponents into aggregated units. But although lumping might reduce the number of parameters to a few tens, we still can-not guarantee that the information obtained during fine-scale research will apply to lumped categories. The behavior of an aggregate is not necessarily equivalent to the sum of the behaviors of the fine-scale components from which it is con-stituted (O’Neill and Rust, 1979).
Considering nutrient fate modeling at the watershed scale, the processes involved in in-stream biogeochemical transfor-mations are a major source of uncertainty. The working unit for the nutrient in-stream processes of most watershed-scale models is the reach. Within this topological unit, several for-mulations for biogeochemical reactions are included depend-ing on the model complexity (e.g. adsorption mechanisms, algae uptake, benthic release, decomposition). However, if the main research target is to describe the nutrient balance of the system and we can ignore the detailed biogeochemical transformations, a much more convenient in-stream model would consist of a reach-lumped formulation of stream nu-trient uptake. This will save a lot of adjustable parameters.
Moreover, if this uptake is empirically quantifiable at the reach scale, then we will be able to apply the field research to the model without the problems associated with upscal-ing results from fine-scale studies. In the case of nutrient fate in streams, the Nutrient Spiralling concept (Newbold et al., 1981) could be a convenient simplification of the nutrient biogeochemical transformations involved, because the nutri-ent spiralling metrics are empirically evaluated at the reach scale (Stream Solute Workshop, 1990), the same topologi-cal unit used by most watershed-stopologi-cale models. Within this framework, the fate of a molecule in a stream is described as a spiral length, which is the average distance a molecule travels to complete a cycle from the dissolved state in the water column, to a streambed compartment, and eventually back to the water column. The spiral length consists of two parts: the uptake length (Sw), which is the distance traveled
in dissolved form, and the turnover length, which is the dis-tance traveled within the benthic compartment. Usually,Sw
is much longer than turnover length, and research based on the nutrient spiralling concept focuses on it. Sw is
evalu-ated at the reach scale, with nutrient enrichment experiments (Payn et al., 2005), following nutrient decay downstream from a point-source (Mart´ı et al., 2004), or with transport-based analysis (Runkel, 2007).
In this study, we explored the possibility of using the mathematical formulation of the Nutrient Spiralling concept to define the in-stream processes affecting total phospho-rus concentration in a customary watershed-scale determin-istic model, and checked whether the final model calibration was consistent with global patterns of phosphorus retention in river networks. First, we manipulated the model source code to include the nutrient spiralling equations. Then, we implemented the model for a real watershed, and let a cali-bration algorithm fit the model to observed data. Next, we analyzed whether the final model was a realistic representa-tion of the natural system, comparing the adjusted nutrient spiraling metrics in the model with values from field-based research performed in the watershed under study. Finally, we assessed how the adjusted nutrient spiraling metrics fit in global relationships between phosphorus spiralling metrics, discharge, and nutrient concentration.
2 Materials and methods 2.1 Study site
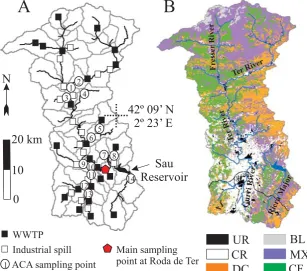
Fig. 1. (a) River total phosphorus (TP) sampling points and TP point sources in the Ter River watershed. Subbasins delineated for HSPF simulation are also shown. (b) Main watercourses and land uses in the watershed (UR: urban; CR: unirrigated crops; DC: deciduous forest; BL: barren land; MX: for clarity, meadows, shrublands, and few portions of oak forest are included here; CF: conifers forest).
meadows. Downstream, the watercourses are surrounded by a mixture of conifer and deciduous forest, and sedimentary rocks become dominant. The Ter River then enters the al-luvial agricultural plain (400 m a.s.l.) where non-irrigated crops dominate the landscape. The main Ter River tribu-taries are the Fresser River in the Pyrenees, the Gurri River on the agricultural plain, and Riera Major in the Sau Reser-voir basin.
As usual in the Mediterranean region, precipitation is highly variable in both space and time. Most of the water-shed has annual precipitation around 800 mm, although in the mountainous north values rise to 1000 mm, and locally up to 1200 mm. Precipitation falls mainly during April-May and September, and falls as snow in the North headwaters during winter. Ter River daily mean water temperature at Roda de Ter (Fig. 1) ranges from 3 to 29◦C, whereas there is a marked variability in the air temperature range across the watershed.
The Ter River watershed includes several urban settle-ments, especially on the agricultural plain (100 000 inhabi-tants). Industrial activity is important, with numerous phos-phorus point-sources (Fig. 1a) coming from textile and meat production. Effluents from wastewater treatment plants (WWTP) are also numerous. Additionally, pig farming is an increasing activity, generating large amounts of slurry that are directly applied to the nearby crops as a fertilizer,
at a rate of 200 kg P ha−1yr−1(Consell Comarcal d’Osona, 2003). The median flow of the river at Roda de Ter (Fig. 1) is 10 m3s−1, and total phosphorus (TP) concentration fre-quently exceeds 0.2 mg P L−1. However, streamflow shows strong seasonality, with very low values during summer (less than 1 m3s−1during extreme droughts) and storm peaks
dur-ing sprdur-ing and autumn exceeddur-ing 200 m3s−1.
2.2 Modeling framework
[image:3.595.142.450.65.336.2]956 R. Marc´e and J. Armengol: Modeling nutrient in-stream processes
Reach 1
Reach 2 Reach 4 Reach 6
R each
3
Reach 5
A
B
Upstream reach
Diffuse sources
Biogeochemical transformations (in-stream processes)
Land drained by reach
Point sources
Reach
Diffuse sources
Biogeochemical transformations (in-stream processes)
Land drained by reach
Point sources
Up
D
Biog tran (in-stre
Land
Point so
Subbasin 1 Subbasin 3
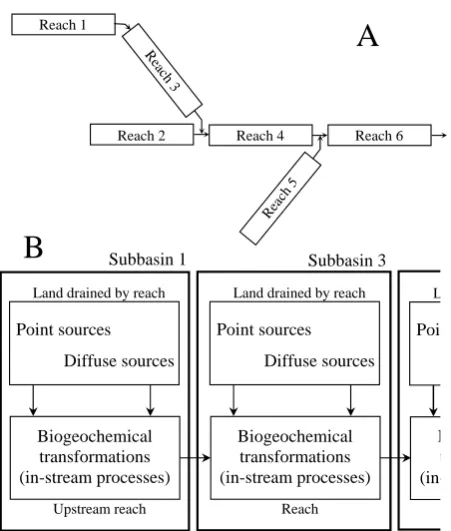
Fig. 2. (a) Schematic representation of hierarchical resolution of subbasins in a HSPF simulation to adequately represent water and constituents routing across a reach network. (b) Diagram showing the main biogeochemical processes solved inside each subbasin in a HSPF simulation.
biogeochemical equations of the model inside sub-basins, and the resolution of each sub-basin is hierarchically sorted in order to adequately simulate mass and energy transport as water moves downstream (Fig. 2).
Hydrology and river temperature have previously been simulated and validated in the Ter River watershed using HSPF on a daily and hourly time scale (Marc´e et al., 2008; Marc´e and Armengol, 2008). Figure 3 shows the simulated daily river streamflow and temperature against observations at Roda de Ter for sampling dates when river TP concentra-tion was available. For simulaconcentra-tions included in this study, we used the water routing and river temperature results from Marc´e et al. (2008) and Marc´e and Armengol (2008), respec-tively. We also refer the reader to Marc´e et al. (2008) for the sub-basin delineation procedure and other details of the model.
2.3 Point sources and diffuse inputs of phosphorus TP concentration and water load information for point sources comes from the Catalan Water Agency (ACA), and consisted of a georrefenced, heterogeneous database with very detailed data for some spills, and crude annual values for others. Due to the lack of precision in some figures of the database we decided to include in the model an
ad-Fig. 3. (a) Observed (open circles) and modeled (line) discharge at Roda de Ter for total phosphorus (TP) sampling dates (from Marc´e et al., 2008). (b) Observed (open circles) and modeled (line) mean daily river temperature at Roda de Ter for TP sampling dates (from Marc´e and Armengol, 2008).
justable multiplicative factor for WWTP inputs (Cw) and
an-other for industrial spills (Ci), in order to correct for potential
monotonous biases in the database (Table 1). Thus, the daily TP load from point sources for a particular reach modeled in HSPF was the sum of all spills located in the corresponding subbasin times the correction factor. Note that the correction factor value was the same for all spills of the same kind (i.e., industrial or WWTP) throughout the watershed.
Diffuse TP inputs into the watercourses were modeled us-ing water routus-ing results from Marc´e et al. (2008). Since we were mainly interested in the in-stream processes, and in or-der to keep the model structure as simple as possible, we cal-ibrated the model against river TP data collected on sampling dates for which there was no surface runoff for at least seven days previously. Thus, we ignored TP transport in surface runoff. TP concentration in interflow and groundwater flow (diffuse sources in Fig. 2) was modeled assuming power di-lution dynamics. We modified the HSPF code to include the following formulations
TPi=ai×Qbii (1a)
TPg=ag×Q bg
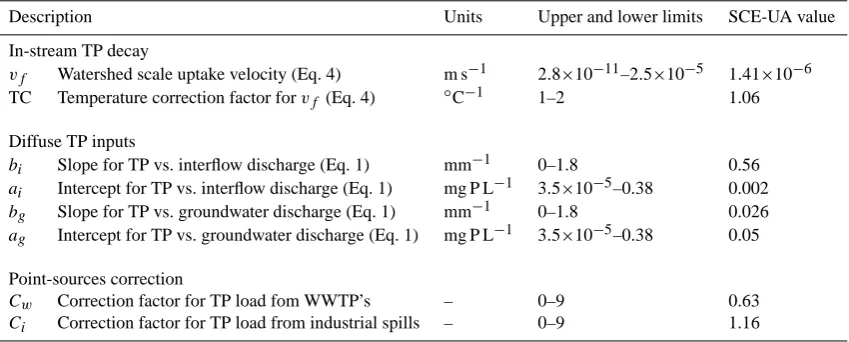
[image:4.595.56.282.62.328.2] [image:4.595.313.543.65.351.2]Table 1. Prior ranges and final adjusted values during calibration of parameters used in the definition of the total phosphorus (TP) model. Equation numbers refer to equations in the text.
Description Units Upper and lower limits SCE-UA value
In-stream TP decay
vf Watershed scale uptake velocity (Eq. 4) m s−1 2.8×10⁻¹¹–2.5×10⁻⁵ 1.41×10⁻⁶ TC Temperature correction factor forvf (Eq. 4) ◦C−1 1–2 1.06
Diffuse TP inputs
bi Slope for TP vs. interflow discharge (Eq. 1) mm−1 0–1.8 0.56
ai Intercept for TP vs. interflow discharge (Eq. 1) mg P L−1 3.5×10⁻⁵–0.38 0.002
bg Slope for TP vs. groundwater discharge (Eq. 1) mm−1 0–1.8 0.026
ag Intercept for TP vs. groundwater discharge (Eq. 1) mg P L−1 3.5×10⁻⁵–0.38 0.05
Point-sources correction
Cw Correction factor for TP load fom WWTP’s – 0–9 0.63
Ci Correction factor for TP load from industrial spills – 0–9 1.16
where TPi and TPg are TP concentration (mg P L−1) in
inter-flow and groundwater discharge, respectively.QiandQgare
the interflow and groundwater discharge (mm) coming from the land drained by the reach.ai,ag,bi, andbgare adjustable
parameters of the corresponding power law. Note that we did not consider spatial heterogeneity for these parameters (i.e., a different adjustable value for each sub-basin). Thus, they should be considered as averages for the entire watershed. However, as we will see later, river TP data for calibration of the model came from one sampling point. As a consequence, the optimized parameter values will more closely correspond to the situation around this sampling point, and they will be less reliable far from it.
2.4 In-stream TP model definition
HSPF includes a module to simulate the biogeochemical transformations of TP inside river reaches (i.e., the in-stream processes, Fig. 2b). Several processes can be defined in this module, including assimilation/release by algae, ad-sorption/desorption mechanisms, sedimentation of particu-late material, decomposition of organic materials, among others (Bicknell et al., 2001). One of the objectives of this study was to explore the possibility of simplifying all these in-stream processes using an aggregate process: TP retention as defined by the Nutrient Spiralling concept. We modified the HSPF code to include formulations that follow.
The in-stream TP fate was modeled as a first order decay following the Stream Solute Workshop (1990) and can be conceptualized as
∂TP
∂t = − Q A
∂TP
∂x + 1
A ∂ ∂x
AD∂∂TPx+Qi
A TPi−TP
+Qg
A TPg−TP
−kcTP
(2)
wheret is time (s),x is distance (m),Qis river discharge (m3s−1),Ais river cross-sectional area (m2), andkc(s−1) is
an overall uptake rate coefficient.QiandQgare as in Eq. (1)
but expressed in m3s−1. The first term of the equation refers
to advection, the second to dispersion, and third and fourth to lateral subsurface inflows. In the context of the HSPF model-ing framework, all these terms refer to TP inputs to the reach, and were solved as explained above. Note that the in-stream model is solved independently inside each reach defined in HSPF, guaranteeing some degree of spatial heterogeneity for the hydraulic behavior. Then, although the formulation as-sumes steady flow, a particular solution of this assumption only applies inside a modeled reach during one time step of the model (one hour), not to the entire river network.
The last term in Eq. (2) simulates solute transfers between water column and benthic compartment (this is what we con-sidered in-stream processes in this paper). Of course this rep-resents an extremely simplified formulation, and must be in-terpreted as a net transport, because more complex settings account for independent dynamics of benthic release and concentration in one or more benthic compartments (New-bold et al., 1983). One important limitation of this formula-tion is thatkc is a constant, and applying a single value in a
system with varying water depth may be very unrealistic. A much more convenient formulation of the last term in Eq. (2) considers solute transfers as a flux across the sediment/water interface, by means of a mass transfer coefficient (vf, m s−1):
−kcTP=− vf
h TP (3)
wherehis river depth. Obviously, from this we can establish vf=h×kc, which implies thatvf is a scale free parameter
(Stream Solute Workshop, 1990). We modified the HSPF code to incorporate this formulation as the only modeled in-stream process, also including a built-in HSPF temperature correction factor. The final formulation of the in-stream pro-cesses was
−kcTP=−
vfTC(Tw−20)
958 R. Marc´e and J. Armengol: Modeling nutrient in-stream processes where TC is the temperature correction factor andTw(◦C) is
river water temperature. Thus, the in-stream module of the watershed-scale model only included two adjustable param-eters (Table 1).
vf is related to the Nutrient Spiralling metricSw through
the following relationship Sw=
uh
vf
(5) whereuis water velocity (m s−1). However, note that this is true only if violation of the steady flow assumption in Eq. (2) is minor. Since nutrient uptake experiments in rivers and streams usually reportSw values for representative reaches,
we can calibrate the watershed model with observed data and compare the obtainedSwwith reported values from real
sys-tems (including data from the Ter River watershed).
Regarding Eq. (4), we are assuming that areal uptake rate (U=vf×TP) is linearly dependent on nutrient concentration.
Although a Monod function relatingUand nutrient concen-tration has been proposed (Mulholland et al., 1990), the lin-ear rule applies even at very high phosphorus concentrations (Mulholland et al., 1990), and there is no conclusive empiri-cal evidence of non-linear kinetics relatingvf and
phospho-rus concentration in rivers (Wollheim et al., 2006), specially in large streams. Still regarding Eq. (4), we are assuming a monotonous effect of temperature on solute transfer in the range of water temperatures measured in our streams.
As above, note that we did not consider spatial hetero-geneity for the nutrient retention parameters (i.e., different adjustable values for each reach defined in the HSPF model). Thus, adjusted Nutrient Spiralling metrics reported in this study (vf andSw) should be considered as averages for the
entire watershed. As in the preceding section, optimized pa-rameter values will more closely correspond to the situation around the TP sampling point, and they will be less reliable as we move upstream.
2.5 Calibration strategy
River TP concentration data for this study came from the Sau Reservoir long-term monitoring program, which includes a sampling point upstream of the reservoir at Roda de Ter (Fig. 1a). Sampling was weekly to monthly, from January 1999 to July 2004. Samples were analyzed using the alkaline persulfate oxidation method (Grasshoff et al., 1983). Among available data, we only considered 106 river TP concen-tration values measured on sampling dates for which there was no surface runoff for at least seven days previously (see Sect. 2.3). These data were the basic data used for calibration and validation of the HSPF model. In addition, TP data from 14 sampling stations run by the local water agency (Ag`encia Catalana de l’Aigua, ACA) were used as a supplementary set for model verification (Fig. 1a). The amount of data from these stations was highly variable, and the reliability of many figures was dubious (e.g. precision only to one significant
digit on most occasions). Thus, we did not consider this in-formation adequate for model calibration.
We calibrated the 8 parameter-model (Table 1) using TP data collected from the Roda de Ter sampling point from 1999 to 2002. TP data for the period 2003–2004 were left for the validation check and not used during calibration. However, since river discharge used during calibration was a modeled variable, we corrected the possible effects of er-rors in discharge simulation on modeled TP values. TP con-centration in the river at Roda de Ter followed a power di-lution dynamics with discharge (TP=0.35×Discharge−0.36, p<0.0001,n=106,r2=0.45). Therefore, any mismatch be-tween observed and modeled discharge will have a profound effect on the calibration process, especially at low discharges. To solve this problem, we performed calibration on a cor-rected TP observed series, using
TPc=TPTP
0
mod
TP0
obs
(6) where TPc is the corrected TP observed value. TP0mod and
TP0obsare the TP values predicted by the above power regres-sion using the modeled and the observed discharge, respec-tively (Fig. 3a). The correcting quotient in Eq. (6) averaged 1.09 for all TP data used during calibration.
Calibration was automatically done using the Shuffled Complex Evolution algorithm (SCE-UA), which was devel-oped to deal with highly non-linear problems (Duan et al., 1992). From an initial population of randomly generated pa-rameters, the algorithm uses shuffling, competitive evolution, and random search to efficiently find the parameter set that minimizes an objective function (OF). In this case, the OF was the sum of the squared errors between model outcomes and corresponding TPc values. We performed the calibra-tion run using SCE-UA as implemented in the PEST package (Doherty, 2003), with parameter bounds detailed in Table 1. 2.6 Model structure coherence and global patterns of
phosphorus retention metrics
In order to assess whether the final model structure was real-istic, we compared the adjusted values of the nutrient spiral-ing metrics in the HSPF model with values from field-based research performed in the watershed under study and in other systems worldwide. The comparison with metrics measured in the Ter watershed was difficult, because published field estimations of Nutrient Spiralling metrics from the Ter wa-tershed mostly report data for pristine streams (Mart´ı and Sabater, 1996; Butturini and Sabater, 1998), while the cal-ibration of the HSPF model is based on data collected down-stream a highly human impacted area. Thus, comparing re-tention metrics from these studies with the fitted metrics in our model could be misleading. Fortunately, Mart´ı et al. (2004) reportedvf for two phosphorus retention experiments
We could take the comparison between modeled retention metrics and field-based estimations a step further. During recent years, researchers have accumulated data that sug-gest nutrient enriched streams have lower retention efficiency (i.e., lowervf or higherSw) than pristine streams (Doyle et
al., 2003; Mart´ı et al., 2004; Haggard et al., 2005; Merse-burger et al., 2005; G¨ucker and Pusch, 2006; Ruggiero et al., 2006). To test how our model results fit into this picture, we collectedSwandvf results for phosphorus from pristine and
nutrient enriched streams. If fittedSw andvf in our model
are realistic approximations of real values, they must resem-ble values measured in impaired streams, and should be co-herent with observed relationships between retention met-rics, streamflow, and phosphorus concentration. Note that collected results come from very heterogeneous field proce-dures (nutrient additions, nutrient decay downstream from a point source, isotopic tracers), and that they lump seasonal studies with one-measure data, and habitat specific experi-ments with whole stream determinations. The most impor-tant implication is that while retention metrics for pristine streams are usually assessed with nutrient enrichment exper-iments, thus reporting gross retention (Mart´ı et al., 1997), most data from impaired streams comes from ambient nutri-ent decay experimnutri-ents, which must be considered reporting net retention metrics. Obviously, our model estimates for the Ter watershed should be considered as a net retention. Finally, values from the literature are based on dissolved in-organic phosphorus retention while our model predicts TP. Although this could introduce some bias in the analysis, the low proportion of particulate phosphorus in this human im-pacted stream (36% in average) suggests that the comparison between our results and the bibliographical values is accept-able.
3 Results
During HSPF calibration with SCE-UA, convergence to an optimized parameter set (see Table 1) was achieved after 7000 model runs. Factors for point source correction (Ci
and Cw) were adjusted to values different than one,
sug-gesting that the available database for point sources had significant biases. The TP load from WWTP seemed to be overestimated in the database, while the industrial spills were slightly underestimated. ApplyingCw andCi for the
mean annual TP loads we obtained 19 000 kg P yr−1 from
WWTP and 12 300 kg P yr−1 from industrial spills.
Con-sidering the diffuse TP inputs, the power function fitted for groundwater TP concentration had a very gentle slope (bg,
Table 1), implying that TPg was nearly a constant value in the range ofQgmodeled in the Ter watershed (TPg around
0.06 mg P L−1). By contrast, the slope for the power relation-ship between TPi andQi defined a clear dilution dynamics,
[image:7.595.311.543.62.214.2]with TPi concentration ranging from 0.6 to 0.04 mg P L−1 depending onQi values. Using these power relationships
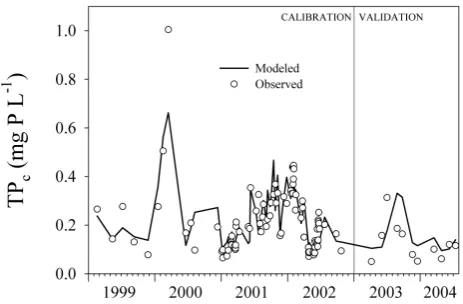
Fig. 4. Time trace of observed corrected total phosphorus concen-tration (TPc) values and model outcomes at Roda de Ter during calibration and validation periods.
with the time series ofQi andQgwe obtained mean annual
TP loads of 23 600 kg P yr−1 from groundwater discharge and 12 800 kg P yr−1from interflow discharge.
The mass transfer coefficientvf was optimized to a very
low value (Table 1), and the temperature correction factor (TC, Table 1) was adjusted to 1.06. Considering that mean daily river water temperature in the watershed ranges from 5 to 27◦C (Fig. 3), this means thatvf values were multiplied
by a factor (Eq. 4) that ranged from 0.4 to 1.3. Thus, ac-tualvf values after temperature correction ranged between
5.6×10⁻⁷ and 1.8×10⁻⁶m s−1. Meanv
f for two nutrient
retention experiments in a reach in the impaired Riera de Tona (Gurri River tributary, Fig. 1b) was 4.6×10⁻⁶m s−1
(Mart´ı et al., 2004), which is an astonishingly similar figure compared to our adjusted value (Table 1).
The fit between observed data and model outcomes at Roda de Ter was satisfactory (Fig. 4). The model explained 72% of variance in river TPc values during the calibration period. The contribution of the very high value during year 2000 was modest. Without this point the explained variance amounted 69%. It is interesting to note that using Mart´ı et al.’s empiricalvf value only caused a slight deviation in the
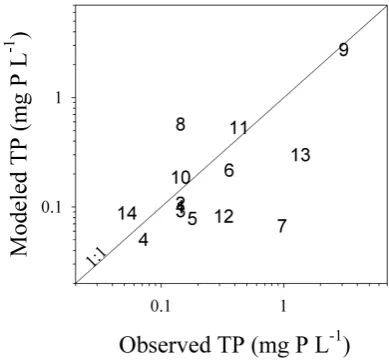
model results (66% of TP explained variance compared to 72% with the optimized parameter). However, the model performed worse during high flow conditions (or low TP concentrations), as Fig. 5 clearly shows. This was most evi-dent during the validation period, a very wet period (Fig. 3). In addition, the fit between median TP values coming from ACA stations and model results was good (Fig. 6), although ACA station 7 showed observed values that were consider-ably higher than model outcomes.
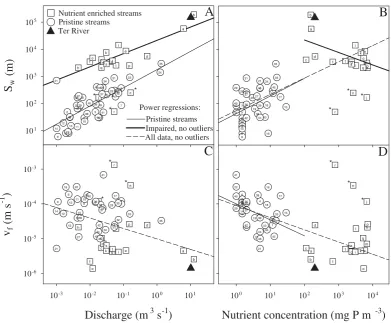
From results found in the literature (Table 2), a clear power relationship could be established betweenSw values
960 R. Marc´e and J. Armengol: Modeling nutrient in-stream processes
Fig. 5. Observed corrected total phosphorus concentration (TPc) values versus modeled total phosphorus (TP) at Roda de Ter during calibration and validation periods.
(13 163Q0.51, n=20, p<0.0097, r2=0.32). We reevalu-ated the power regression for impaired streams discarding points labeled as j, r, and n (21 256Q0.49,n=17,p<0.0001, r2=0.73, bold line in Fig. 7a). The presence of these points, which represent very short phosphorus Sw in nutrient
en-riched streams, should be attributed to methodological con-straints. Most of the nutrient retention experiments in paired streams were measuring net retention. Since in im-paired streams point sources and diffuse inputs can be inex-tricably linked (Merseburger et al., 2005), it is not easy to assign this lowSwto the effect of actual in-stream processes
or to lateral inflows of nutrients by seepage. MeanSwfor the
Ter River calculated with our model is also indicated in the plot (Fig. 7a, full triangle), and falls near the result expected for an impaired system.
Sw also showed a significant relationship with
phospho-rus concentration (PC) in streams (Fig. 7b), although both level of significance and explained variance were low, spe-cially for nutrient enriched streams (185 350P C−0.46,n=17, p=0.016, r2=0.33 for impaired streams without outliers, and 43P C0.65, n=46, p=0.007, r2=0.17 for pristine sys-tems). Remarkably, slope of the power regression differed between stream type (Fig. 7b), and the power regression us-ing all data was significant (55.2P C0.6,n=57,p<0.0001, r2=0.56).
Contrastingly, vf and streamflow did not show any
sig-nificant relationship when pristine and impaired streams were analyzed separately (Fig. 7c), although a significant negative power law exist pooling both types of systems (9.8×10⁻⁶P C−0.3, n=57, p=0.0017, r2=0.16). On the other hand, onlyvf measured in pristine streams was
sig-nificantly related to phosphorus concentration in streams (0.0001P C−0.46, n=46, p=0.008, r2=0.18, Fig. 7D),
al-Fig. 6. Median total phosphorus (TP) values observed in the differ-ent sampling stations sampled by the Catalan Water Agency (ACA) against modeled values (numbers as in Fig. 1a).
though again we found a significant negative power law when pooling pristine and impaired systems in the same analysis (9×10⁻⁵P C−0.35,n=57,p<0.0001,r2=0.52).
4 Discussion
The low mass transfer coefficientvf optimized in our model
is only comparable with values obtained in point-source im-paired streams (Doyle et al., 2003; Mart´ı et al., 2004). Val-ues from pristine streams usually fall between 10−3 and
10−5m s−1 (Doyle et al., 2003). Our lowv
f defines a
wa-tershed with watercourses with very low phosphorus reten-tion capacity. Of course, this would probably hold in reaches around the sampling point at Roda de Ter, while in headwater streams the value will probably be underestimated. However, there is evidence that some small streams in the area have very small phosphorus retention capacity as well (Mart´ı et al., 2004) due to the widespread human impact in the basin. Thus, with data at hand is very difficult to propose how nu-trient retention varies across the stream network. In conse-quence, we must take ourvf figure as a coarse-scale value.
Nonetheless, considering that most relevant TP point sources are located near the sampling point at Roda de Ter, the proba-bly biasedvf in some headwater reaches is expected to have
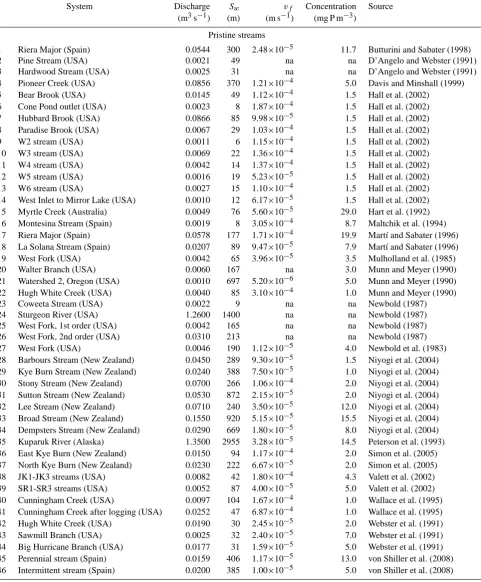
[image:8.595.329.524.64.244.2]Table 2. Uptake length (Sw), mass transfer velocity (vf), discharge, and ambient phosphorus concentration for different nutrient retention experiments in pristine and impaired streams. Figures labeled with an asterisk represent net retention values.na=not available.
System Discharge Sw vf Concentration Source
(m3s−1) (m) (m s−1) (mg P m−3)
Pristine streams
1 Riera Major (Spain) 0.0544 300 2.48×10⁻⁵ 11.7 Butturini and Sabater (1998)
2 Pine Stream (USA) 0.0021 49 na na D’Angelo and Webster (1991)
3 Hardwood Stream (USA) 0.0025 31 na na D’Angelo and Webster (1991)
4 Pioneer Creek (USA) 0.0856 370 1.21×10⁻⁴ 5.0 Davis and Minshall (1999)
5 Bear Brook (USA) 0.0145 49 1.12×10⁻⁴ 1.5 Hall et al. (2002)
6 Cone Pond outlet (USA) 0.0023 8 1.87×10⁻⁴ 1.5 Hall et al. (2002)
7 Hubbard Brook (USA) 0.0866 85 9.98×10⁻⁵ 1.5 Hall et al. (2002)
8 Paradise Brook (USA) 0.0067 29 1.03×10⁻⁴ 1.5 Hall et al. (2002)
9 W2 stream (USA) 0.0011 6 1.15×10⁻⁴ 1.5 Hall et al. (2002)
10 W3 stream (USA) 0.0069 22 1.36×10⁻⁴ 1.5 Hall et al. (2002)
11 W4 stream (USA) 0.0042 14 1.37×10⁻⁴ 1.5 Hall et al. (2002)
12 W5 stream (USA) 0.0016 19 5.23×10⁻⁵ 1.5 Hall et al. (2002)
13 W6 stream (USA) 0.0027 15 1.10×10⁻⁴ 1.5 Hall et al. (2002)
14 West Inlet to Mirror Lake (USA) 0.0010 12 6.17×10⁻⁵ 1.5 Hall et al. (2002) 15 Myrtle Creek (Australia) 0.0049 76 5.60×10⁻⁵ 29.0 Hart et al. (1992) 16 Montesina Stream (Spain) 0.0019 8 3.05×10⁻⁴ 8.7 Maltchik et al. (1994) 17 Riera Major (Spain) 0.0578 177 1.71×10⁻⁴ 19.9 Mart´ı and Sabater (1996) 18 La Solana Stream (Spain) 0.0207 89 9.47×10⁻⁵ 7.9 Mart´ı and Sabater (1996)
19 West Fork (USA) 0.0042 65 3.96×10⁻⁵ 3.5 Mulholland et al. (1985)
20 Walter Branch (USA) 0.0060 167 na 3.0 Munn and Meyer (1990)
21 Watershed 2, Oregon (USA) 0.0010 697 5.20×10⁻⁶ 5.0 Munn and Meyer (1990)
22 Hugh White Creek (USA) 0.0040 85 3.10×10⁻⁴ 1.0 Munn and Meyer (1990)
23 Coweeta Stream (USA) 0.0022 9 na na Newbold (1987)
24 Sturgeon River (USA) 1.2600 1400 na na Newbold (1987)
25 West Fork, 1st order (USA) 0.0042 165 na na Newbold (1987)
26 West Fork, 2nd order (USA) 0.0310 213 na na Newbold (1987)
27 West Fork (USA) 0.0046 190 1.12×10⁻⁵ 4.0 Newbold et al. (1983)
962 R. Marc´e and J. Armengol: Modeling nutrient in-stream processes
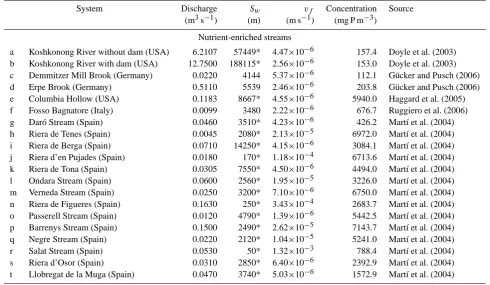
Table 2. Continued.
System Discharge Sw vf Concentration Source
(m3s−1) (m) (m s−1) (mg P m−3)
Nutrient-enriched streams
a Koshkonong River without dam (USA) 6.2107 57449* 4.47×10−6 157.4 Doyle et al. (2003) b Koshkonong River with dam (USA) 12.7500 188115* 2.56×10−6 153.0 Doyle et al. (2003) c Demmitzer Mill Brook (Germany) 0.0220 4144 5.37×10⁻⁶ 112.1 G¨ucker and Pusch (2006) d Erpe Brook (Germany) 0.5110 5539 2.46×10⁻⁶ 203.8 G¨ucker and Pusch (2006) e Columbia Hollow (USA) 0.1183 8667* 4.55×10−6 5940.0 Haggard et al. (2005) f Fosso Bagnatore (Italy) 0.0099 3480 2.22×10⁻⁶ 676.7 Ruggiero et al. (2006) g Dar´o Stream (Spain) 0.0460 3510* 4.23×10−6 426.2 Mart´ı et al. (2004) h Riera de Tenes (Spain) 0.0045 2080* 2.13×10−5 6972.0 Mart´ı et al. (2004) i Riera de Berga (Spain) 0.0710 14250* 4.15×10−6 3084.1 Mart´ı et al. (2004) j Riera d’en Pujades (Spain) 0.0180 170* 1.18×10−4 6713.6 Mart´ı et al. (2004) k Riera de Tona (Spain) 0.0305 7550* 4.50×10−6 4494.0 Mart´ı et al. (2004) l Ondara Stream (Spain) 0.0600 2560* 1.95×10−5 3226.0 Mart´ı et al. (2004) m Verneda Stream (Spain) 0.0250 3200* 7.10×10−6 6750.0 Mart´ı et al. (2004) n Riera de Figueres (Spain) 0.1630 250* 3.43×10−4 2683.7 Mart´ı et al. (2004) o Passerell Stream (Spain) 0.0120 4790* 1.39×10−6 5442.5 Mart´ı et al. (2004) p Barrenys Stream (Spain) 0.1500 2490* 2.62×10−5 7143.7 Mart´ı et al. (2004) q Negre Stream (Spain) 0.0220 2120* 1.04×10−5 5241.0 Mart´ı et al. (2004) r Salat Stream (Spain) 0.0530 50* 1.32×10−3 788.4 Mart´ı et al. (2004) s Riera d’Osor (Spain) 0.0310 2850* 6.40×10−6 2392.9 Mart´ı et al. (2004) t Llobregat de la Muga (Spain) 0.0470 3740* 5.03×10−6 1572.9 Mart´ı et al. (2004)
any attempt to include spatial variability in TP model com-ponents would have been a worthless effort.
The significant dependence on water temperature sug-gested thatvf for TP in this watershed is controlled to some
extent by biological activity. However, as an empirical cor-rection factor, this could also reflect any seasonal process re-lated to TP retention showing covariance with stream temper-ature. Thus, results from this study cannot be used to state that temperature is modulating TP retention.
Concerning the model fit, it seemed that the model was missing some significant effect at high flows, which could be attributed to physically-mediated higher retention during high flows not accounted for in our formulation, or to an overestimation of TPg during very wet periods. Considering that during high flows river nutrient concentration is quite small because dilution, it is not probable that a formulation including saturation kinetics for retention would help solv-ing this misfit. One possible reason for the misfit could be the presence of an additional inorganic retention process tak-ing place in the water column and specially significant durtak-ing high flows. This points to a model with two loss mechanisms: the areal retention already included related to biological ac-tivity, and one additional volumetric loss rate related to par-ticulate TP retention (the presence of a significant biological loss process taking place in the water column is not feasible considering the size of the Ter River). This is a suggestive hypothesis to test in future versions of the model.
Concerning the data from ACA stations, low TP values modeled for ACA station 7 should be attributed to a miss-ing point source in the database upstream from this samplmiss-ing point, considering that the adjustedvf value for the
water-shed represented a very low retention efficiency.
Despite these shortcomings, results from this study showed that the formulation on which the Nutrient Spiralling concept research is based is a good alternative for modeling the nutrient in-stream processes in a watershed-scale model. Even considering that we worked in a worst case scenario, in the sense that limited river TP concentration data were avail-able to calibrate the model, model outcomes were satisfac-tory. Taking into account the similarity between our adjusted vf and values reported by Mart´ı et al. (2004) for streams in
the Ter River watershed, adjusted parameter values can be considered realistic.
A more general test of the adequacy of the model struc-ture is the comparison with retention metrics coming from impaired streams of the world and their relationships with streamflow and nutrient concentration. The dependence of Swon streamflow was already reported for phosphorus
(But-turini and Sabater, 1998) and ammonia retention (Peterson et al., 2001) in pristine streams. Our fitted power relation-ship between Sw and discharge in pristine streams slightly
Discharge (m
3s
-1)
10-3 10-2 10-1 100 101
v
(m s
f-1
)
10-6 10-5 10-4 10-3 1 4 5 6 7 89 11 10
12 13 14 15 16 17 18 19 21 22 27 28 29 30 31 32 33 34 35 36 37 38 39 40 41 42 43 44 45 46 a b c d e f g h i j k l m n o p q r s t
S
(m)
w101 102 103 104 105 1 2 3 4 5 6 7 8 9 10 11 12 13 14 15 16 17 18 19 20 21 22 23 24
2527 26 28 29 30 31 32 33 34 35 36 37 38 39 40 41 42 43 44 4546 a b c d e f g h i j k l m n o p q r s t
Nutrient enriched streams Pristine streams
Pristine streams Impaired, no outliers Power regressions:
Nutrient concentration (mg P m
-3)
100 101 102 103 104
1 4 5 6 78 9 10 11 12 13 14 15 16 17 18 19 21 22 27 28 29 30 31 32 33 34 35 36 37 38 39 40 41 42 43 44 45 46 a b c d e f g h i j k l m n o p q r s t 1 4 5 6 7 8 9 10 11 12 13 14 15 16 17 18 19 20 21 22 27 28 29 30 31 32 33 34 35 36 37 38 39 40 41
42 4443 45 46 a b c d e f g h i j k l m n o p q r s t Ter River
A
B
C
D
* * * * * * * * * * * *All data, no outliers
[image:11.595.99.491.68.391.2]*
Fig. 7. Discharge and phosphorus ambient concentration versus phosphorusSwandvf for pristine and nutrient enriched streams. Numbers and letters are as in Table 2. Points labeled with an asterisk are considered outliers. Results for our model are depicted as full triangles. See the text for details on power regressions.
power relationship was also fitted with data coming from nutrient-enriched streams. The agreement between the mean Sw value obtained with our model for the Ter River and the
expected result for an impaired stream with similar discharge (full triangle in Fig. 7a) is notable, and suggest that the model structure used in our model is adequate and realistic.
Our results suggest that the lack of relationship between phosphorusSw and discharge reported in impaired streams
(Mart´ı et al., 2004) can be attributed to a narrower discharge range in previous studies. In fact, the relationship between Sw and discharge can be considered a worthless result
con-sidering Eq. (5) (Stream Solute Workshop, 1990), where the dependence ofSw on hydrology is clearly stated. See the
open discussion in Marc´e and Armengol (2009) for a debate on this subject. In the case of phosphorus, it cannot be ar-gued that the variability in the biological loss process (vf
in Eq. (5)) is responsible for a great portion of theSw vs.
discharge relationship, because neither pristine nor impaired streams showedvf dependence on streamflow (Fig. 7c). This
conclusion is also supported by the fact that the slopes of power laws drawn in Fig. 7a hardly deviate from 0.6, which
is the most probable slope ifSw variability were mainly
de-termined by hydraulics as defined in Eq. (5) (u≈Q0.2 and h≈Q0.4, Knighton (1998)). However, the different inter-cept of the power regressions showed by pristine and im-paired streams is a robust result. The difference in mean vf between stream classes is about two orders of magnitude
(1×10⁻⁴m s−1for pristine streams and 8.6×10⁻⁶m s−1for impaired ones), as is the case for the difference between mean Sw values (270 m for pristine streams and 25 828 m
for impaired streams). Considering Eq. (5) and these re-sults, most probably the different intercepts in theSwvs.
dis-charge relationship are a rate constant effect more than an effect of the dependence of the intercepts on velocity (since Swcan be defined asu/ kcand discharge asuA). This result
agree with the analysis in Doyle et al. (2003), who empha-sized the coupled nature of channel morphology and uptake processes for governing phosphorus retention, and coincides with Alenxander et al. (2009) who reached the same conclu-sion for nitrogen.
vf shows significant dependence on discharge when data
964 R. Marc´e and J. Armengol: Modeling nutrient in-stream processes (Fig. 7c). However, we consider that this result could have
arose by chance, sincevf values are split in two groups
de-pending on stream class, and high stream values are only present for impaired streams. The fact that intra-class re-lationships were not significant supports this view. Thus, care should be taken when using discharge to scale in-stream phosphorus retention processes to the watershed scale, a current practice for nitrogen (Alexander et al., 2000). In our opinion, the same artifact could be present in the rela-tionships between nutrient retention metrics and phospho-rus ambient concentration (Fig. 7b and 7d). Relationships for pristine streams, despite explaining a little portion of re-tention metrics variability, can be considered reliable, and in fact have been recently described for phosphorus in pristine streams (von Shiller et al., 2008). However, significant re-lationships lumping data for all streams could be an artifact, since it seems that regressions are fitting two clouds of data points. This would be the case if retention metrics in im-paired streams were independent of nutrient concentration, but dependent on other impacts (e.g., biological community composition, geomorphological modifications, toxic pollu-tants). An alternative explanation is that impaired and pris-tine streams share the same kinetics, but from 102mg P m−3 retention processes loss sensitivity to nutrient concentration, as proposed for nitrogen in streams with cronic high nutrient loads (Bernot and Doods, 2005). However,vf for nitrogen
in streams shows a significant power relationship through-out five orders of magnitude in nitrate concentration values (Mulholland et al., 2008; Alenxander et al., 2009), and the relationship is consistent for rivers associated to different hu-man impacts. The uncertainty of our results compared to the well defined patterns described for nitrogen could be the re-sult of the very heterogeneous methodologies involved in the figures collected in Table 1, but the importance of inorganic processes in stream phosphorus chemistry could also play a role. With no doubt, more research on phosphorus retention should be done to definitively answer if phosphorus retention follows a dynamics similar to that of nitrogen, or if a idiosyn-cratic framework should be developed for phosphorus.
In any case, panels in Fig. 7 clearly state that nutrient en-riched streams shows retention efficiency loss. This is not at odds with Mulholland et al. (2008) results for nitrogen, that shows not so evident differences between stream types. The reason is that we used nutrient concentration as the cri-teria for defining a stream as impaired, while Mulholland et al. (2008) separated streams by land use adjacent to the stream. Thus, urban and agricultural streams in Mulholland et al. (2008) actually included streams with very low nutrient concentration. Considering the tight relationship between ni-trogenvf and stream concentration reported by Mulholland
et al. (2008), applying our criteria for defining an impaired stream should result in retention efficiency loss in impaired streams also for nitrogen.
Interestingly, phosphorus retention efficiency loss in im-paired streams is maintained in the whole discharge range
(Fig. 7a). Thus, human impacts on nutrient retention are sig-nificant across the entire stream network, and not restricted to small water courses. This has enormous implications, be-cause it has been frequently argued that small streams are hot spots for nutrient retention in stream networks (Peter-son et al., 2001). Without posing in question this asser-tion, Wollheim et al. (2006) showed that the relevance of big and small streams depends on the level of aggregation for which removal is reported. In any case, Wollheim et al. (2006) demonstrated that larger rivers can exert considerable influence on nutrient exports, and that altering these systems could have a disproportionate impact on basin exports. Re-sults collected here suggest that human pressure alter phos-phorus processing even in large rivers, and considering Woll-heim et al. (2006) results this should promote further research on phosphorus retention metrics in larger rivers (e.g., Tank et al., 2008).
5 Conclusions
We have demonstrated that a lumped, hardly parameterized formulation of the in-stream nutrient fate in rivers could be very efficient in a large-scale model, and that this opens the very interesting possibility of directly using data collected in the field in large-scale applications. Although other au-thors already proposed watershed scale models including for-mulations coming from the Nutrient Spiralling concept to solve the in-stream processes (e.g., Wollheim et al., 2006; Alenxander et al., 2009), here we showed that this approach may be helpful even for customary deterministic applications working at short time steps (e.g. SWAT or HSPF applica-tions at hourly intervals). Our procedure avoids the exercise of upscaling fine-scale research results to parameterize do-everything in-stream modules typical of such models, which are finally adjusted to bibliographical values on most occa-sions. Of course, this is not a valid option if the detailed bio-geochemical processes are research targets, or if we need ex-plicit formulations of these processes to simulate complex bi-otic or abibi-otic interactions. However, the coarse-formulation approach should suffice in many modeling exercises that are usually solved using highly parameterized model structures. On the other hand, analysis of published data on phos-phorus retention in streams strongly suggested that impaired streams have less phosphorus retention efficiency caused by a diminution of in-stream uptake processes. Remarkably, phosphorus retention efficiency loss in impaired streams is maintained in the whole discharge range. Considering the scarce information available on phosphorus retention in large streams and rivers, this should be considered a research pri-ority if we want to upscale phosphorus retention to entire stream networks located in populated areas. Unfortunately, the association between phosphorus retention efficiency (ex-pressed as vf) and discharge and phosphorus
nitrogen, specially if impaired streams are present. Thus, further research is needed to clarify the biogeochemical con-trols of phosphorus retention in streams at the reach scale, specially in large watercourses. The possibility of including an independent inorganic kinetic component in the nutrient spiralling formulation for phosphorus should also be investi-gated.
Acknowledgements. We thank M. Comerma, J. C. Garc´ıa,
M. A. Gallegos, J. Ord´o˜nez, and G. Gonz´alez for the field work. ATLL and ACA gently provided data. Founding was provided by the Spanish Plan Nacional de I+D+I (Projects CGL2004-05503-CO2-01 and CGL2008-06377-C02-01). Comments from referees and editor during open discussion greatly enhanced the quality of this paper.
Edited by: M. Sivapalan
References
Alexander, R. B., Smith, R. A., and Schwarz, G. E.: Effect of stream channel size on the delivery of nitrogen to the Gulf of Mexico, Nature, 403, 758–761, 2000.
Alexander, R. B., Johnes, P. J., Boyer, E., and Smith, R. A.: A com-parison of models for estimating the riverine export of nitrogen from large watersheds, Biogeochemistry, 57/58, 295–339, 2002. Alexander, R. B., B¨ohlke, J. K., Boyer, E. W., David, M. B., Harvey, J. W., Mulholland, P. J., Seitzinger, S. P., Tobias, C. R., Tonitto, C., and Wollheim, W. M.: Dynamic modeling of nitrogen losses in river networks unravels the coupled effects of hydrological and biogeochemical processes, Biogeochemistry, 93, 91-116, 2009. Beaulac, M. N. and Reckhow, K. H.: An examination of land
use-nutrient export relationships, Water Resour. Bull., 18, 1013– 1024, 1982.
Behrendt, H., Huber, P., Kornmilch, M., Opitz, D., Schmoll, O., Scholz, G., and Uebe, R.: Nutrient emissions into river basins of Germany, UBATexte 23/00, Berlin, 2000.
Bernot, M. J. and Doods, W. K.: Nitrogen retention, removal, and saturation in lotic ecosystems, Ecosystems, 8, 442-453, 2005. Beven, K.: Changing ideas in hydrology: the case of
physically-based models, J. Hydrol., 105, 157–172, 1989.
Bicknell, B. R., Imhoff, J. C., Kittle, J. L., Jobes, T. H., and Donigian, A. S.: Hydrological Simulation Program-Fortran (HSPF) user’s manual for release 12. US Environmental Protec-tion Agency, NaProtec-tional Exposure Research Laboratory, Athens, GA, 2001.
Butturini, A. and Sabater, F.: Ammonium and phosphate retention in a Mediterranean stream: hydrological versus temperature con-trol, Can. J. Fish. Aquat. Sci., 55, 1938–1945, 1998.
Consell Comarcal d’Osona: Actions, present condition, and future scenarios for the Manure Management Plan in Osona, Consell Comarcal d’Osona, Vic, Spain, 2003 (in Catalan).
D’Angelo, D. J. and Webster, J. R.: Phosphate retention in streams draining pine and hardwood catchments in the southern Ap-palachian mountains, Freshwater Biol., 26, 335–345, 1991. Davis, J. C. and Minshall, G. W.: Nitrogen and phosphorus uptake
in two Idaho (USA) headwater wilderness streams, Oecologia, 119, 247–255, 1999.
Doherty, J.: PEST Surface Water Utilities, Watermark Numerical Computing and University of Idaho, Brisbane, Australia, 2003. Doyle, M. W., Stanley, E. H., and Harbor, J. M.: Hydrogeomorphic
controls on phosphorus retention in streams, Water Resour. Res., 39, 1147, doi:10.1029/2003WR002038, 2003.
Duan, Q., Sorooshian, S., and Gupta, V.: Effective and efficient global optimization for conceptual rainfall-runoff models, Water Resour. Res., 28, 1015–1031, 1992.
Garnier, J., Billen, G., and Coste, M.: Seasonnal succession of di-atoms and Chlorophyceae in the drainage network of the river Seine: Observations and modeling, Limnol. Oceanogr., 40, 750– 765, 1995.
Grasshoff, K., Erhardt, M., and Kremling, K.: Methods of Sea Wa-ter Analyses, Verlag Chemie, Weinheim, Germany, 1983. G¨ucker, B. and Pusch, M. T.: Regulation of nutrient uptake in
eutrophic lowland streams, Limnol. Oceanogr., 51, 1443–1453, 2006.
Haggard, B. E., Stanley, E. H., and Storm, D. E.: Nutrient retention in a point-source-enriched stream, J. N. Am. Benthol. Soc., 24, 29–47, 2005.
Hall, R. J., Bernhardt, E. S., and Likens, G. E.: Relating nutrient up-take with transient storage in forested mountain streams, Limnol. Oceanogr., 47, 255–265, 2002.
Hart, B. F., Freeman, P., and McKelvie, I. D.: Whole-stream phos-phorus release studies-Variation in uptake length with initial phosphorus concentrations, Hydrobiologia, 235, 573–584, 1992. Heaney, S. I., Corry, J. E., and Lishman, J. P.: Changes of water quality and sediment phosphorus of a small productive lake fol-lowing decreased phosphorus loading, in: Eutrophication: Re-search and Application to Water Supply, edited by: Sutcliffe, D. W. and Jones, J. G., Freshwater Biological Association, Amble-side, UK, 119–131, 1992.
Howarth, R. W., Billen, G., Swaney, D., Townsend, A., Jaworski, N., Lajtha, K., Downing, J. A., Elmgren, R., Caraco, N., Jordan, T., Berendse, F., Freney, J., Kudeyarov, V., Murdoch, P., and Zhu, Z.: Regional nitrogen budgets and riverine N and P fluxes for the drainages to the North Atlantic Ocean: natural and human influences, Biogeochemistry, 35, 75–139, 1996.
Jaworski, N. A., Groffman, P. M., Keller, A. A., and Prager, J. C.: A watershed nitrogen and phosphorus balance: the Upper Po-tomac River basin, Estuaries, 15, 83–95, 1992.
Johnes, P. J.: Evaluation and management of the impact of land use change on the nitrogen and phosphorus load delivered to sur-face waters: the export coefficient modeling approach, J. Hy-drol., 183, 323–349, 1996.
Johnes, P. J., Moss, B., and Phillips, G. L.: The determination of water quality by land use, livestock numbers and population data-testing of a model for use in conservation and water quality man-agement, Freshwater Biol., 36, 951–473, 1996.
Johnes, P. J. and Heathwaite, A. L.: Modelling the impact of land use change on water quality in agricultural catchments, Hydrol. Process., 11, 269–286, 1997.
Knighton, D.: Fluvial forms and processes: a new perspective, Ox-ford Univ. Press, New York, 1998.
966 R. Marc´e and J. Armengol: Modeling nutrient in-stream processes
Marc´e, R., Comerma, M., Garc´ıa, J. C., and Armengol, J.: A neuro-fuzzy modelling tool to estimate fluvial nutrient loads in wa-tersheds under time-varying human impact, Limnol. Oceanogr.-Meth., 2, 342–355, 2004.
Marc´e, R., Ruiz, C. E., and Armengol, J.: Using spatially distributed parameters and multi-response objective functions to solve parameterization of complex applications of semidis-tributed hydrological models, Water Resour. Res., 44, W02436, doi:10.1029/2006WR005785, 2008.
Marc´e, R. and Armengol, J.: Modeling river water tempera-ture using deterministic, empirical, and hybrid formulations in a Mediterranean stream, Hydrol. Process., 22, 3418–3430, doi:10.1002/hyp.6955, 2008.
Marc´e, R. and Armengol, J.: Modeling nutrient in-stream processes at the watershed scale using Nutrient Spiralling metrics, Hydrol. Earth Syst. Sci. Discuss., 6, 501-533, 2009,
http://www.hydrol-earth-syst-sci-discuss.net/6/501/2009/. Mart´ı, E., Grimm, N. B., and Fisher, S. G.: Pre- and post-flood
retention efficiency of nitrogen in a Sonoran Desert stream, J. N. Am. Benthol. Soc., 16, 805–819, 1997.
Mart´ı, E. and Sabater, F.: High variability in temporal and spatial nutrient retention in Mediterranean streams, Ecology, 77, 854– 869, 1996.
Mart´ı, E., Aumatell, J., God´e, L., Poch, M., and Sabater, F.: Nutri-ent retNutri-ention efficiency in streams receiving inputs from wastew-ater treatment plants, J. Environ. Qual., 33, 285–293, 2004. McIsaac, G. F., David, M. B., Gertner, G. Z., and Goolsby, D. A.:
Nitrate flux in the Mississippi River, Nature, 414, 166–167, 2001. Merseburger, G. C., Mart´ı, E., and Sabater, F.: Net changes in nu-trient concentrations below a point source input in two streams draining catchments with contrasting land uses, Sci. Total Envi-ron., 347, 217–229, 2005.
Mulholland, P. J., Newbold, J. D., Elwood, J. W., Ferren, L. A., and Webster, J. R.: Phosphate spiralling in a woodland stream: seasonal variations, Ecology, 6, 1012–1023, 1985.
Mulholland, P. J., Steiman, A. D., and Elwood, J. W.: Measure-ments of phosphate uptake length in streams: comparison of ra-diotracer and stable PO4releases, Can. J. Fish. Aquat. Sci., 47,
2351–2357, 1990.
Mulholland, P. J., Helton, A. M., Poole, G. C., et al.: Stream denitri-fication across biomes and its response to anthropogenic nitrate loading, Science, 452, 202–206, 2008.
Munn, N. L. and Meyer, J. L.: Habitat-specific solute retention in two small streams: an intersite comparison, Ecology, 71, 2069– 2082, 1990.
Newbold, J. D., Elwood, J. W., O’Neill, R. V., and Van Winkle, W.: Measuring nutrient spiralling in streams, Can. J. Fish. Aquat. Sci., 38, 860–863, 1981.
Newbold, J. D., Elwood, J. W., O’Neill, R. V., and Sheldon, A. L.: Phosphate dynamics in a woodland stream ecosystem; a study of nutrient spiraling, Ecology, 64, 1249–1265, 1983.
Newbold, J. D.: Phosphate spiralling in rivers and river-reservoir systems: implications of a model, in: Regulated Streams, edited by: Craig, F. and Kemper, J. B., Plenum Publishing Corp., New York, USA, 303–327, 1987.
Niyogi, D. L., Simon, K. S., and Townsend, C. R.: Land use and stream ecosystem functioning: nutrient uptake in streams that contrast in agricultural development, Arch. Hydrobiol., 160, 471–486, 2004.
O’Neill, R. V. and Rust, B.: Aggregation error in ecological models, Ecol. Model., 7, 91–105, 1979.
Payn, R. A., Webster, J. R., Mulholland, P. J., Valett, H. M., and Dodds, W. K.: Estimation of stream nutrient uptake from nutri-ent addition experimnutri-ents, Limnol. Oceanogr.-Meth., 3, 174–182, 2005.
Peterson, B. J., Deegan, L., Helfrich, J., Hobbie, J. E., Hullar, M., Moller, B., Ford, T. E., Hersey, A., Hiltner, A., Kipphut, G., Lock, M. A., Fiebig, D. M., McKinley, V., Miller, M. C., Vestal, J. R., Ventullo, R., and Volk, G.: Biological responses of tundra river to fertilization, Ecology, 74, 653–672, 1993.
Peterson, B. J., Wollheim, W. M., Mulholland, P. J., Webster, J. R., Meyer, J. L., Tank, J. L., Mart´ı, E., Bowden, W. B., Valett, H. M., Hershey, A. E., McDowell, W. H., Dodds, W. K., Hamil-ton, S. K., Gregory, S., and Morrall, D. D.: Control of nitrogen export from watersheds by headwater streams, Science, 292, 86– 90, 2001.
Raat, K. J., Vrugt, J. A., Bouten, W., and Tietema, A.: Towards re-duced uncertainty in catchment nitrogen modelling: quantifying the effect of field observation uncertainty on model calibration, Hydrol. Earth Syst. Sci., 8, 751–763, 2004,
http://www.hydrol-earth-syst-sci.net/8/751/2004/.
Rastetter, E. B., King, A. W., Cosby, B. J., Hornberger, G. M., O’Neill, R. V., and Hobbie, J. E.: Aggregating fine-scale ecolog-ical knowledge to model coarser-scale attributes of ecosystems, Ecol. Appl., 2, 55–70, 1992.
Reynolds, C. S.: Eutrophication and management of planktonic al-gae: what Vollenweider couldn’t tell us?, in: Eutrophication: Re-search and Application to Water Supply, edited by: Sutcliffe, D. W. and Jones, J. G., Freshwater Biological Association, Amble-side, UK, 4–29, 1992.
Ruggiero, A., Solimini, A. G., and Carchini, G.: Effects of a waste water treatment plant on organic matter dynamics and ecosys-tem functioning in a Mediterranean stream, Ann. Limnol.-Int. J. Lim., 42, 97–107, 2006.
Runkel, R. L.: Toward a transport-based analysis of nutrient spi-ralling and uptake in streams, Limnol. Oceanogr.-Meth., 5, 50– 62, 2007.
Simon, K. S., Townsend, C. R., Biggs, B. J. F., and Bowden, W. B.: Temporal variation of N and P uptake in 2 New Zealand streams, J. N. Am. Benthol. Soc., 24, 1–18, 2005.
Smith, R. A., Schwarz, G. E., and Alexander, R. B.: Regional inter-pretation of water-quality monitoring data, Water Resour. Res., 33, 2781–2798, 1997.
Srinivasan, R., Arnold, J. G., Muttiah, R. S., Walker, D., and Dyke, P. T.: Hydrologic unit modeling of the United States (HU-MUS), in: Advances in Hydro-Science and Engineering, edited by: Yang, S., School of Engineering, University of Mississippi, MS, 451–456, 1993.
Stream Solute Workshop: concepts and methods for assessing so-lute dynamics in stream ecosystems, J. N. Am. Benthol. Soc., 9, 95–119, 1990.
Tank, J. L., Rosi-Marshall, E. J., Baker, M. A., and Hall Jr., R. O.: Are rievrs just big streams? A pulse method to quantify nitrogen demand in a large river, Ecology, 89, 2935-2945, 2008. Valett, H. M., Crenshaw, C. L., and Wagner, P. F.: Stream nutrient
Vollenweider, R. A.: Scientific fundamentals of the eutrophica-tion of lakes and flowing waters, with particular reference to nitrogen and phosphorus as factors in eutrophication, Pub. No. DAS/SAI/68.27, Organization for Economic Cooperation and Development, Directorate for Scientific Affairs, Paris, France, 1968.
von Shiller, D., Mart´ı, E., Riera, J. L., Ribot, M., Argerich, A., Fonoll`a, P., and Sabater, F.: Inter-annual, annual, and aeasonal variation of P and N retention in a perennial and an intermittent stream, Ecosystems, 11, 670–687, 2008.
Wallace, J. B., Webster, J. R., and Meyer, J. L.: Influence of log additions on physical and biotic characteristics of a mountain stream, Can. J. Fish. Aquat. Sci., 52, 2120–2137, 1995. Walsh, J. J.: Importance of continental margins in the marine
bio-geochemical cycling of carbon and nitrogen, Nature, 350, 53–55, 1991.
Webster, J. R., D’Angelo, D. J., and Peter, G. T.: Nitrate and phosphate uptake in streams at Cweeta Hydrologic Laboratory, Verhandlungen Internationale Vereinigung f¨ur theoretische und Angewandte Limnologie, 24, 1681–1686, 1991.
Whitehead, P. G., Wilson, E. J., and Butterfield, D.: A semi-distributed Integrated Nitrogen model for multiple source assess-ment in Catchassess-ments (INCA): Part I – model structure and process equations, Sci. Total Environ., 210/211, 547–558, 1998. Wollheim, W. M., V¨or¨osmarty, C. J., Peterson, B. J., Seitzinger,
S. P., and Hopkinson, C. S.: Relationship between river size and nutrient removal, Geophys. Res. Lett., 33, L06410, doi:10.1029/2006GL025845, 2006.