https://doi.org/10.5194/hess-23-1725-2019 © Author(s) 2019. This work is distributed under the Creative Commons Attribution 4.0 License.
Using paired catchments to quantify the human influence
on hydrological droughts
Anne F. Van Loon1, Sally Rangecroft1, Gemma Coxon2, José Agustín Breña Naranjo3, Floris Van Ogtrop4, and Henny A. J. Van Lanen5
1School of Geography, Earth and Environmental Sciences, University of Birmingham, Birmingham, UK 2School of Geographical Sciences, University of Bristol, Bristol, UK
3Institute of Engineering, Universidad Nacional Autónoma de México, Mexico City, Mexico 4School of Life and Environmental Sciences, University of Sydney, Sydney, Australia
5Hydrology and Quantitative Water Management Group, Wageningen University, Wageningen, the Netherlands Correspondence:Anne F. Van Loon ([email protected])
Received: 20 April 2018 – Discussion started: 25 April 2018
Revised: 11 March 2019 – Accepted: 12 March 2019 – Published: 26 March 2019
Abstract. Quantifying the influence of human activities, such as reservoir building, water abstraction, and land use change, on hydrology is crucial for sustainable future water management, especially during drought. Model-based meth-ods are very time-consuming to set up and require a good understanding of human processes and time series of wa-ter abstraction, land use change, and wawa-ter infrastructure and management, which often are not available. Therefore, observation-based methods are being developed that give an indication of the direction and magnitude of the human influ-ence on hydrological drought based on limited data. We sug-gest adding to those methods a “paired-catchment” approach, based on the classic hydrology approach that was developed in the 1920s for assessing the impact of land cover treatment on water quantity and quality. When applying the paired-catchment approach to long-term pre-existing human influ-ences trying to detect an influence on extreme events such as droughts, a good catchment selection is crucial. The dis-turbed catchment needs to be paired with a catchment that is similar in all aspects except for the human activity un-der study, in that way isolating the effect of that specific activity. In this paper, we present a framework for select-ing suitable paired catchments for the study of the human influence on hydrological drought. Essential elements in this framework are the availability of qualitative information on the human activity under study (type, timing, and magni-tude), and the similarity of climate, geology, and other hu-man influences between the catchments. We show the
1 Introduction 1.1 Background
In our human-modified era, the Anthropocene, human activ-ities have direct and indirect effects on the hydrological sys-tem (UNESCO, 2009, 2012; Montanari et al., 2013; Destouni et al., 2013; McMillan et al., 2016). It is vital to understand how our activities are affecting the hydrological system to help us improve the management of water resources, espe-cially during drought. Only limited studies exist that focus on the quantification of how humans influence hydrologi-cal droughts (Querner et al., 1997; Querner and Van La-nen, 2001; Van Lanen et al., 2004b). This has inspired re-cent calls for new tools and approaches to study the human influence on droughts (Van Loon et al., 2016a, b). Here we define drought as a deficit in available water from “normal” conditions (Wilhite and Glantz, 1985; Tallaksen and Van La-nen, 2004) and we focus on hydrological drought, which is a deficit in streamflow.
Recent studies quantifying the human influence on hydro-logical droughts use hydrohydro-logical models because of their ability to isolate processes by generating scenarios with and without human activities for comparison (e.g. Wanders and Wada, 2015; Van Loon and Van Lanen, 2015; Veldkamp et al., 2015; Wada et al., 2017). In other fields, such as hydro-ecology, modelling is also used to quantify hydrologic alter-ation, i.e. the deviation of flows between actual and base-line conditions (e.g. Poff et al., 2010; Mathews and Richter, 2007). Often this “scenario modelling” is done with large-scale models (e.g. Veldkamp et al., 2015; Wanders and Wada, 2015; Wada et al., 2017), but these models have a coarse res-olution and are not extensively calibrated or validated locally, and will therefore have large uncertainty on the local scale. Furthermore, whilst the scientific community is working to add known human activities and decisions into hydrological models (Wada et al., 2017), the current generation of hydro-logical models does not include all anthropogenic processes yet (Srinivasan et al., 2017) and models often underestimate the effect of these processes (Jaramillo and Destouni, 2015). Finally, scenario modelling requires high-resolution data on human activities influencing the hydrology of a catchment (e.g. land use, abstraction), which often are not available. Therefore, we need relatively simple methods that can es-timate the influence of human activities on drought from ob-servational data. Several methods have been developed in re-cent years:
1. The “observation-modelling” approach (e.g. Van Loon and Van Lanen, 2013) compares human-influenced ob-served droughts with naturalised simulated droughts. Downsides of this method are that the simulated hy-drological data have uncertainties and a pre-disturbed period is needed for calibration to reduce those.
2. The “upstream–downstream” approach (Rangecroft et al., 2019) compares hydrological droughts downstream of a disturbance with those upstream, which are as-sumed to be unaffected. This method uses observa-tion data only and uncertainty comes from the possible non-linear relationship between the upstream and down-stream gauging stations.
3. The “pre-post-disturbance” approach (e.g. Liu et al., 2016) compares hydrological droughts before and af-ter a disturbance. The comparison of two different time periods makes it harder to separate the human influ-ence from climatic variability (e.g. decadal and multi-decadal) and non-stationarity due to climate change (Peñas et al., 2016).
4. Finally, the “large-scale screening” approach uses com-parative hydrology (Wagener et al., 2010) or large-sample hydrology (Gupta et al., 2014) to disentangle different drivers of hydrological processes. For exam-ple, Destouni et al. (2013) relate changes in evaporation to hydro-climatic factors and land and water use in Swe-den, and Tijdeman et al. (2018) use deviations in the relationship of meteorological to hydrological drought between human-influenced catchments and a range of benchmark catchments in the UK. Downside of this method is the need for a large number of catchments with long time series of hydrological data and informa-tion about the type and degree of human influence for all catchments.
In this paper, we suggest adding an observation-based ap-proach that requires very few data and uses the same time pe-riod for the analysis, thereby avoiding the effects of climatic variability and non-stationarity. The “paired-catchment” ap-proach compares a human-influenced catchment with a benchmark catchment where the human activity of interest is not present. Paired-catchment analysis is a classical method in hydrology that compares the flow regime of two catch-ments which have similar physical characteristics with the aim to identify the impact of a disturbance on the flow regime (Hewlett, 1971; Bosch and Hewlett, 1982). The approach has been applied around the world to evaluate and quantify ef-fects of land use change and treatment (e.g. afforestation, de-forestation) on hydrology (e.g. water yields and water qual-ity) (Brooks et al., 2003; Brown et al., 2005; Folton et al., 2015). There are some paired-catchment studies focusing on low flows, but no applications investigating human influence on hydrological drought. We argue that this paired-catchment approach could help quantify the human influence on hydro-logical drought and complement existing approaches. 1.2 Paired-catchment analysis
(Bates, 1921; Zégre et al., 2010). It originates from experi-mental research on the effects of intentional land cover treat-ment (e.g. afforestation, deforestation) on water quantity and quality. The basic concept of the method is to compare the flow regime of two nearby catchments with similar physi-cal characteristics, one as a control (“benchmark”) and the other as a disturbed catchment (also known as the “treat-ment catch“treat-ment” in some of the literature). Comparing the same time periods allows for climatic variability to be ac-counted for in the analysis (Brown et al., 2005). Climate, soils, and geology should be similar between the two catch-ments (Best et al., 2003; Brown et al., 2005; Folton et al., 2015), with the main difference the treatment in the disturbed catchment. Traditionally, this treatment often consists of de-forestation or afde-forestation. The identified differences in hy-drology between the disturbed and control catchments can then be attributed to the treatment (Brown et al., 2005). In most paired-catchment studies, catchments are typically ad-jacent, although this is not always possible, but they tend to be in close proximity to help with the similarity of catchment characteristics and climate. Relatively short time periods are used for the analysis of the effects of the treatment, typically a few months to years. For classic paired-catchment treat-ment studies, pre-disturbance periods are sometimes used for both catchments to ensure streamflow similarity, or to es-tablish the pre-disturbance difference in hydrology between the catchments. This set-up is often called “before–after control–impact” (BACI), which is different from the sim-pler “before–after” (BA; approach 3 mentioned above) and “control–impact” (CI) set-ups (Peñas et al., 2016).
The paired-catchment approach has been used for many decades (Swank et al., 2001; Brooks et al., 2003; Brown et al., 2005; Putro et al., 2016). Starting as early as the 1920s (Bates, 1921), the use of paired catchments to study the im-pacts of forest treatments and management activities on wa-ter yields accelerated since the 1960s (e.g. Hewlett and Hi-bbert, 1961; Harris, 1977; Hornbeck et al., 1993; Robin-son and Rycroft, 1999). There is some controversy around the trustworthiness of paired-catchment results. Some stud-ies have shown that the paired-catchment approach has a bet-ter performance than standard calibrated rainfall-runoff mod-els (e.g. Andréassian et al., 2012), but some critique the way paired-catchment observations are analysed (e.g. Alila et al., 2009) or the way results are interpreted (e.g. Calder and Ayl-ward, 2006). These controversies influence the societal de-bate around the effectiveness of catchment management, es-pecially on the effects of forests on flooding (Andréassian, 2004; Ellison et al., 2012).
Overall, most published studies have looked at land use change impacts on annual flow and flood peaks and assessing the magnitude of water yield change resulting from changes in vegetation (see the review paper of paired-catchment anal-ysis by Brown et al., 2005, and other studies by Cornish, 1993, Bari et al., 1996, Best et al., 2003, and Folton et al., 2015). In the 1990s, some studies started looking at low
flows within paired-catchment analysis (e.g. Keppeler and Ziemer, 1990; Scott and Smith, 1997). Low flows are defined as the “minimum flow in a river during the dry periods of the year”, which makes them a seasonal phenomenon and an integral component of the flow regime of a river (Smakhtin, 2001). It has for example been found that clear-cut harvesting can lead to an increase in low flows (Keppeler and Ziemer, 1990), while conversion from grasslands, shrublands, and croplands to forests can cause a decrease in low flows (Scott and Smith, 1997; Farley et al., 2005). Paired-catchment stud-ies focusing on low flows also suggested that in watersheds located in dry regions streams were likely to completely dry up following afforestation, and that the streamflow regime in those watersheds would change from perennial to intermit-tent (Farley et al., 2005; Jackson et al., 2009). Droughts dif-fer from low flows because they represent an anomaly from the normal seasonal cycle and can therefore also occur in the high flow season. There currently is no research using the paired-catchment approach to assess changes in hydrological droughts due to land use change and other human activities.
Because droughts are extreme events that occur irregu-larly, long time series are needed to detect any effect of human influences on hydrological drought using a paired-catchment approach. Additionally, many human activities cannot be applied as intentional treatment in a small catch-ment just for research purposes. This is the case for exam-ple with reservoirs, groundwater abstraction, and other large-scale water supply and management activities. If we want to study the effects of these on hydrological drought, we need to work with existing observed data. Often no hydrological monitoring was done before the start of the human activity, which means that pre-disturbance data are not available to as-sess catchment similarity and a full BACI set-up is not possi-ble. Despite this, the paired-catchment approach can still be used with a CI set-up, if the selection of the catchment pair is done carefully and qualitative data on the human activities are available. The CI set-up has been found to give satisfac-tory results for a range of hydrological variables compared to the baseline BACI set-up that uses paired catchments that are calibrated on a pre-disturbance period (Peñas et al., 2016). A long-term paired-catchment study using the CI set-up has recently been done to assess the influence of urbanisation on flooding in the UK (Prosdocimi et al., 2015), and we think that there is also potential to use it in drought studies.
1.3 Aim
human-influenced catchment. By showing the application of the paired-catchment approach to drought and discussing its limitations, we demonstrate how this approach can be used as a tool for improved analysis and understanding of the human influence on hydrological drought in the Anthropocene.
2 Application of the paired-catchment approach to quantify the human influence on hydrological drought
For applying the paired-catchment approach to quantify the human influence on hydrological drought, two catchments need to be selected, of which one is a human-influenced catchment (e.g. with water abstraction, urbanisation, reser-voirs) and the other is as similar as possible except that it does not have the human influence we aim to quantify. Im-portantly, the benchmark catchment does not need to be com-pletely natural to be used in a paired-catchment setting as long as the human influence of interest can be isolated and quantified. The analysis focuses on the effect on hydrolog-ical drought metrics (e.g. drought duration and deficit vol-ume), rather than the more typical focus of paired-catchment studies on water yield or low flows. Therefore, long time series are needed to extract these drought metrics. We also avoid the problematic one-to-one pairing of events based on driving meteorology (chronological pairing), because re-sults would be too dependent on event characteristics and an-tecedent conditions (Alila et al., 2009). Instead we focus on the whole time series, taking differences in both frequency and magnitude into account (frequency pairing), as was ad-vocated by Alila et al. (2009). In this section, we outline the important elements for the approach, such as the catchment selection process, the data requirements, the drought analy-sis, and the calculation for quantifying the human influence.
2.1 Catchment selection
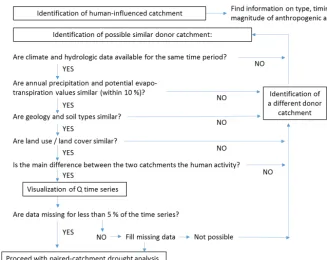
The starting point for a paired-catchment analysis is a hu-man activity that is expected to influence the hydrology of an area. Qualitative information about this human influence (such as type and timing) and long time series of hydrologi-cal data need to be available (Fig. 1). One of the most critihydrologi-cal requirements for a successful paired-catchment comparison is that the catchment characteristics are as similar as possi-ble, except for the human disturbance that is being analysed. Relevant catchment characteristics could include precipita-tion, temperature or potential evapotranspiraprecipita-tion, land use, catchment area, elevation, geology, and soils. How similar these characteristics should be for a paired-catchment anal-ysis will vary depending on the hydrological extreme of in-terest (e.g. floods, droughts) and the dominant characteristics that control hydrological response in that region (e.g. poten-tial evapotranspiration may be more important in drier, hot-ter climates; Oudin et al., 2010). There is little lihot-terature on
the acceptable differences between the paired catchments, which makes it difficult to automatise the process. Paired catchments are therefore often chosen manually using expert judgement.
In Fig. 1, we provide some guidance on which characteris-tics are important for this application of the paired-catchment approach to drought, and how these could be assessed. For drought studies, precipitation, potential evapotranspiration, soils, geology, and land use are considered to be the most im-portant characteristics (Van Lanen et al., 2004a, 2013; Stoel-zle et al., 2014) to ensure similar meteorological conditions and hydrological responses in both catchments. It is often quite difficult to find paired catchments with exactly the same characteristics so it is necessary to put some limits on what is deemed acceptable for pairing. In this study, catchments were considered to be suitable for pairing if differences in average annual precipitation and potential evapotranspiration were within ±10 % and the catchments had the same geo-logical classification (Fig. 1). It is also important to check precipitation variability as well as annual values, as the an-nual averages could be masking very different distributions of precipitation which would then result in different mete-orological droughts in the catchments. This check can be done by plotting the precipitation values for both catchments on the annual and monthly timescale to see their similari-ties and differences. Case studies where precipitation distri-bution between the catchments significantly divert from the 1:1 line or have linear regression slopes andR2 values of less than 0.5 should be excluded from paired-catchment anal-ysis. Soil type and geology are important to consider with re-gard to their responsiveness, i.e. flashy versus slow response to precipitation, implying that expert knowledge is needed to translate the qualitative soil and geology information. To en-able the effect of the human activity on drought to be isolated, the catchment selection also requires a singular human influ-ence that is different between the paired catchments. Sim-ilarity between the catchments with regard to other human activities should be checked at least qualitatively.
Figure 1.Flow diagram for choosing paired catchments for analysis of the human influence on hydrological drought.
2.2 Data requirements
Ideally, observation data of precipitation and discharge with a minimum of 30 years should be used, with limited missing data (<5 %) so that hydrological extremes can be computed reliably (McKee et al., 1993; Rees et al., 2004). Information on catchment characteristics and the type of human activity in the human-influenced catchment are also required (Fig. 1). To check similarity on other human activities, information is needed on the presence of reservoirs, outflow of sewage treat-ment plants and other artificial drainage or water transfers, and water abstraction for public water supply or irrigation.
Most commonly, the paired-catchment approach is done with annual data, but monthly data are also sometimes used (Bari et al., 1996; Brown et al., 2005). Droughts are gener-ally long phenomena with timescales of weeks to years, with drought-generating processes and associated impacts going beyond a daily time step. Therefore drought analysis is nor-mally conducted on the monthly time step (e.g. Hisdal et al., 2004; Fleig et al., 2006). Consequently, here we use monthly data for the paired-catchment analysis.
2.3 Drought analysis
Drought analysis can be done with several different methods (Van Loon, 2015). For paired-catchment analysis we suggest using the threshold level method (Yevjevich, 1967; Tallak-sen and Van Lanen, 2004) to identify drought events and their metrics, because it allows transfer of the benchmark threshold and therefore comparison of the human-influenced
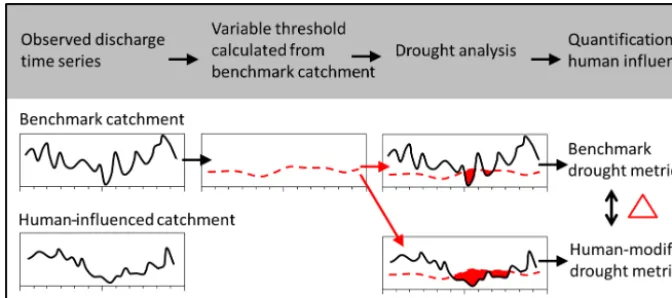
flow with the benchmark regime. The threshold level method is a commonly used drought analysis method that defines drought events when streamflow is below a specified thresh-old (Yevjevich, 1967; Hisdal and Tallaksen, 2000; Hisdal et al., 2004; Fleig et al., 2006). For quantification of the hu-man influence, the threshold needs to be generated from the benchmark catchment time series (Fig. 2; Rangecroft et al., 2019), therefore excluding any influence of human activities on the threshold. This benchmark threshold is then applied to both catchments for the drought analysis (Fig. 2).
Different threshold levels can be used. In the case studies described here, we used the 80 % non-exceedance threshold (Q80) from the flow duration curve. This means that 80 % of the time discharge is above this threshold. TheQ80is a com-monly used threshold to identify drought events (Hisdal and Tallaksen, 2000; Tallaksen and Van Lanen, 2004; Fleig et al., 2006; Heudorfer and Stahl, 2016). The threshold can be fixed or variable; we used the monthly variable threshold to incor-porate seasonality into the threshold (Hisdal and Tallaksen, 2000; Hisdal et al., 2004; Fleig et al., 2006; Heudorfer and Stahl, 2016).
Figure 2.Diagram of the drought analysis method and quantification of the human influence on the hydrological drought metrics.
the paired-catchment comparison is “occurrence of drought events”. We calculated the frequency, which is the total num-ber of drought events identified in the time period. The sec-ond drought metric analysed is “duration of drought events”. We used the total number of months in drought, the aver-age duration of all events, and the duration of the maximum event. The third drought metric is “deficit volume of drought events”, which is defined as the cumulative difference be-tween the flow and the threshold over the drought event. Again we used the total deficit over the entire time period, the average deficit of all events, and the deficit of the maxi-mum event.
2.4 Estimation of the human impact on drought characteristics
Chronological pairing of flooding events is known to be diffi-cult because storms do not always coincide in time, duration, intensity, or spatial extents between the paired catchments (Alila et al., 2009; Zégre et al., 2010). Drought occurs on larger spatial and temporal scales, but it can still be chal-lenging to compare single events. Therefore, we focus on the changes in the average and maximum drought metrics over a longer time period rather than on specific drought events.
The drought metrics mentioned in Sect. 2.3 were obtained from the drought analysis applied to each catchment and then compared between the paired catchments. The difference be-tween the drought metrics of the human-influenced catch-ment and those of the benchmark catchcatch-ment (Fig. 2) was cal-culated using the following equation (Eq. 1):
change due to the human influence(%)
=
(human−benchmark) benchmark
·100. (1)
3 Case studies
We present results from two case studies to show the applica-tion of the paired-catchment approach to quantify the human influence on hydrological drought metrics. The case studies in the UK and Australia (Fig. 3) were chosen because of their contrasting climate, geology, and human activity. The UK case study is impacted by a water transfer scheme, has a temperate maritime climate and a relatively slow responding catchment; the Australian case study is impacted by ground-water abstraction, has a semi-arid climate and faster response times. These case studies were chosen based on the availabil-ity of data required for the assessment and analysis, including qualitative information on the human activities occurring in the catchments. For both human-influenced catchments we then applied the catchment selection scheme in Fig. 1 to find a suitable benchmark catchment.
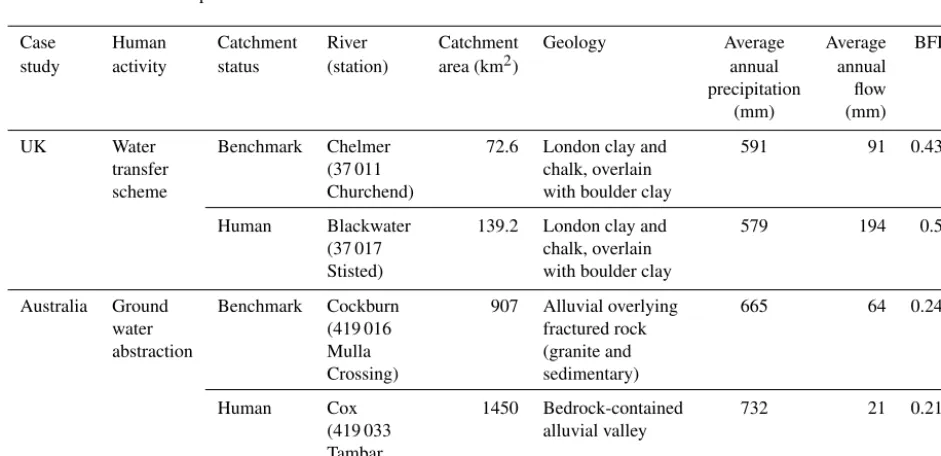
Table 1 contains the main information about the two sets of paired catchments. For this application, we used ob-served discharge data (in mm month−1). Precipitation data (mm month−1) were used to check the similarity of aver-age annual precipitation (within±10 %) and distribution of monthly precipitation (Fig. 1, Table 1). For the UK case study, discharge time series and geology information were sourced from the National River Flow Archive (NRFA, 2018) and precipitation data were obtained from CEH-GEAR (Keller et al., 2015). For the Australian case study, discharge and precipitation data and geology information were sourced from the Australian NSWs WaterInfo (NSW, 2018).
3.1 UK paired catchments: Blackwater and Chelmer 3.1.1 Paired-catchment selection
Figure 3.Paired-catchment case studies in the UK(a)and Australia(b), including the location of the gauging station and land use.
Table 1.Catchment data of the paired catchments of both case studies.
Case Human Catchment River Catchment Geology Average Average BFI
study activity status (station) area (km2) annual annual
precipitation flow
(mm) (mm)
UK Water Benchmark Chelmer 72.6 London clay and 591 91 0.43
transfer (37 011 chalk, overlain
scheme Churchend) with boulder clay
Human Blackwater 139.2 London clay and 579 194 0.5
(37 017 chalk, overlain Stisted) with boulder clay
Australia Ground Benchmark Cockburn 907 Alluvial overlying 665 64 0.24
water (419 016 fractured rock
abstraction Mulla (granite and
Crossing) sedimentary)
Human Cox 1450 Bedrock-contained 732 21 0.21
(419 033 alluvial valley Tambar
[image:7.612.65.536.468.696.2]Table 2.Paired-catchment results for UK: Blackwater (Human) and Chelmer (Benchmark).
Occurrence Duration (months) Deficit (mm)
Frequency Total Average Maximum Total Average Maximum duration duration duration deficit deficit deficit
Benchmark 22 86 3.9 10 163.8 7.4 29.6
Human 7 16 2.3 4 39.3 5.6 16
% difference −68 % −81 % −42 % −60 % −76 % −25 % −46 % due to the
human influence
Figure 4.Drought analysis results for the UK pair: Blackwater (human) and Chelmer (benchmark) (1972–2015). Black solid line represents streamflow, dashed black line representsQ80variable threshold, and red areas are identified drought events.
and expansion and development in the South Essex area (AEDA, 1990). The Blackwater catchment was paired with a nearby catchment (Chelmer; Fig. 3) as its benchmark, due to their similarity in catchment characteristics (Table 1). Both catchments have a geology of mixed-permeability superfi-cial deposits (86 %–88 %), a predominantly rural land use (Fig. 3), and similar annual rainfall totals (within 10 %) (Ta-ble 1). Both catchments have very low urban extent (Chelmer 4.9 % and Blackwater 5.4 %; NRFA, 2018) and the land uses are very similar, with arable land covering 71 %–75 % in both (NRFA, 2018; Fig. 3). There are no dams (GRanD database, Lehner et al., 2011a, b) in either of the catchments. There are four sewage treatment works in the Blackwater catchment which have a minor impact on flow (NRFA, 2018), but there are no sewage treatment works in the benchmark catchment, the Chelmer. The observation data available for both
catch-ments ran from 1972 to 2015 with no missing data, covering a number of important drought events in the UK.
3.1.2 Drought comparison results
Table 3.Paired-catchment results for Australia: Cox (Human) and Cockburn (Benchmark).
Occurrence Duration (months) Deficit (mm)
Frequency Total Average Maximum Total Average Maximum duration duration duration deficit deficit deficit
Benchmark 14 52 3.7 10 14.3 1.0 3.4
Human 39 165 4.2 10 47.3 1.2 3.3
% difference +179 % +217 % +14 % 0 % +231 % +19 % −3 % due to the
human influence
Figure 5.Drought analysis for the Australian pair: Cox (Human) and Cockburn (Benchmark) (1982–2013). Flow higher than 5 mm month−1 is not shown. Black solid line represents streamflow, dashed black line represents 80 % variable threshold, and red areas are identified drought events.
shows that the water transfer mainly reduced the number of droughts in the human-influenced catchment.
3.2 Australian paired catchments: Cox and Cockburn 3.2.1 Paired-catchment selection
The Cox catchment in south-eastern Australia has heavy groundwater abstraction for irrigation (Ivkovic et al., 2014). For the paired-catchment analysis, the benchmark catchment, Cockburn, was chosen based on its similarity in precipita-tion and geology (Table 1) and its proximity (Fig. 3). BFI for the benchmark catchment is much lower than that of the UK benchmark catchment, showing that the Australian catchments are responding faster to precipitation (Table 1). Observation data were available from 1982–2013, with no missing data.
3.2.2 Drought comparison results
Results showed an overall aggravation of drought metrics due to the groundwater abstraction in the human-influenced catchment, especially for the total number of months in drought and the total deficit (Fig. 5, Table 3). The well-documented Millennium Drought in Australia (2001–2009; Van Dijk et al., 2013) shows clearly as a series of hydro-logical drought events in the human-influenced catchment, whereas it was not as persistent in the benchmark catchment (Fig. 5). Like the water transfer in the UK case study, the water abstraction in Australia mainly influenced the drought frequency. Abstraction resulted in more frequent drought events, not so much in more severe drought events. The max-imum drought event characteristics are probably not affected (Table 3) because during these rare events the flow is zero in both catchments.
4 Discussion
As a scientific community we need to improve our under-standing of the effect of human processes on hydrology and quantify the two-way interactions to be able to char-acterise, model, and manage them (Srinivasan et al., 2017). These processes can only be fully explored through observa-tions (Jaramillo and Destouni, 2015). Here we have demon-strated that a paired-catchment approach is a suitable tool to assess and quantify the human influence on hydrologi-cal droughts using observation data. There are limitations to this approach, as any observation- and/or model-based ap-proach has uncertainties. Model-based methods for quantify-ing the human influence have uncertainties associated with input data, parameters, and model structure, which often do not include human processes (Wagener et al., 2004; Kreibich et al., 2017; Srinivasan et al., 2017), and observation-based methods have uncertainties with regards to temporal or spa-tial resolution and data quality (McMillan et al., 2012; Coxon et al., 2015). Also, isolation of one type of human-influence is often more difficult in observation data.
As discussed in this paper, for an effective paired-catchment analysis it is important for the paired-catchment prop-erties to be as similar as possible, enabling isolation of the human influence. In this study, we selected the catchment pairs based on four characteristics: climate (precipitation, po-tential evapotranspiration), geology, land use, and qualitative information on human influences (Fig. 1). Paired catchments in this study were chosen manually using expert judgement; however, recent advances in catchment classification and similarity frameworks (see Hrachowitz et al., 2013) could be an alternative because these might provide a more objective and automated method to select paired catchments. Never-theless, currently local knowledge is still a highly valuable part of catchment selection.
We focused on geology and precipitation as these two characteristics have been found elsewhere to be the most im-portant drivers of hydrological droughts (Van Lanen et al., 2004a, 2013; Haslinger et al., 2014; Stoelzle et al., 2014; Van Loon and Laaha, 2015). In particular, we argue that dif-ferences in geology are more important in the analysis of low flows and droughts than for floods and annual flow analysis, because of the importance of catchment storage in the catch-ment response to precipitation and the drought propagation process (Van Lanen et al., 2013; Van Loon and Laaha, 2015; Barker et al., 2016). Differences in geology affect the stor-age and response of catchments, and therefore response to meteorological drought events in one geology type could be very different to another, making it difficult to distinguish the effect of human influence from the effects of geological dif-ferences.
Similarity in precipitation is important as it is the driving meteorological factor for drought development. Both precip-itation variability and annual averages should be similar for the paired catchments (Fig. 1). Firstly, it is important that the total precipitation inputs are similar for both catchments because of the transfer of the benchmark catchment thresh-old to the human-influenced catchment (Fig. 2). Significantly higher or lower precipitation in the benchmark catchment re-sults in higher or lower discharge, which reduces the transfer-ability of the threshold to the human-influenced catchment. We suggest a maximum difference of 10 %. Alternatively, discharge could be scaled by dividing by average discharge, as done for example by Andréassian et al. (2012). Precipi-tation distribution may be very different even if total aver-age values are similar, meaning that meteorological drought events experienced by the two catchments could be different. Ideally, the monthly and annual precipitation records of both catchments are also similar, which can be checked with the linear regression coefficient andR2values.
Moreover, it is important to make sure that there are not multiple human activities influencing streamflow in the human-influenced catchment. If we want to increase our un-derstanding of the effect of different human activities on drought, we need to isolate the human influence under study. Here the focus was on the human activities of adding wa-ter via wawa-ter transfer and removing wawa-ter via groundwa-ter abstraction, and therefore we made sure that both catch-ments had the same urbanisation and that neither had dams or other large water infrastructure. These other human influ-ences (land use change, water infrastructure) can, however, also be analysed using the paired-catchment approach.
equa-tion (Hornbeck et al., 1993; Bari et al., 1996). However, gen-erally this assumes a linear relationship between the catch-ments, which is a very crude assumption. Furthermore, a pre-disturbance period might not be available for paired catch-ments when they are not planned treatcatch-ments and the human activity started before the hydrological measurements (Peñas et al., 2016). Peñas et al. (2016) tested the paired-catchment approach without a pre-disturbance period (CI set-up) to that with a pre-disturbance period (BACI set-up) and found that over 80 % of the impacted hydrological variables were iden-tified correctly by the CI set-up, and they therefore suggest using this approach when no pre-disturbance data are avail-able.
There are some challenges which remain specific to the paired-catchment analysis. Firstly, it can be very difficult to find a benchmark catchment, which is identical to the human-influenced catchment except for the human activity. Keeping a close proximity between the pairs can often help to reduce differences in geology and precipitation; however, ground-water abstractions are known to impact the surrounding areas beyond the catchment boundary, and therefore neighbouring catchments might not be regarded as undisturbed by the hu-man activity under study and should then not be used in a paired-catchment analysis. Instead, we suggest compromis-ing on another selection criterion (Fig. 1), such as precipita-tion, to locate a suitable benchmark catchment.
A second challenge, which is relevant for all observation-based methods, is data availability. Data availability and quality can severely affect the success of a catchment pair-ing or analysis. There is also a need for information on the type and extent of human disturbance, which may not always be available or known (Fig. 1). Differences in drought be-tween the catchments cannot fully be attributed to the hu-man influence, as there will always be a remaining uncer-tainty in the catchment pairing. However, the approach can be used for a first estimate of the human influence on drought, to steer campaigns to collect more data, and to complement other existing methods (e.g. model-based, large-sample, and observation-modelling approaches).
Given the criticism of the method, the paired-catchment approach needs to be applied with care. For example, a one-to-one comparison of events (chronological pairing) is not recommended (Alila et al., 2009; Zégre et al., 2010); instead multiple characteristics like frequency and magnitude, tak-ing into account all events in the period of record, should be analysed to prevent underestimation of effects. Here, we transferred the threshold from the benchmark catchment to the human-influenced catchment to make sure that the effect of the human activities is not included in the threshold, again preventing underestimation (Rangecroft et al., 2019). How-ever, there might be reasons to look at anomalies relative to each catchment’s own threshold, for example by using stan-dardised drought indices. This approach is often applied in paired-catchment studies focusing on flooding, in which the threshold for a peak-over-threshold analysis is determined
for both catchments independently (e.g. Prosdocimi et al., 2015). A different way to calculate the threshold gives differ-ent outcomes (Rangecroft et al., 2019) and researchers need to be aware of this. It is important that it is clearly stated which approach is used and that benefits and limitations of that approach are discussed (Birkinshaw, 2014).
The application in this paper is the first use of paired catchments to quantify the human influence on hydrologi-cal droughts. One possible way forward from this could be to use data from published paired-catchment studies, but to focus the analysis on droughts rather than annual hydrolog-ical regime to assess how treatments of land cover change (e.g. deforestation, afforestation) have impacted hydrologi-cal droughts. These existing datasets have pre-disturbed time periods, and catchment selection has already been done rig-orously. Another option would be to analyse other human activities such as urbanisation and the building of reservoirs.
5 Concluding remarks
In our human-dominated world we need to find ways to use our tools and methods to study the human influence on hy-drology. In this study, we show the first application of the paired-catchment approach to quantify the human influence on hydrological droughts. We discussed how the selection of the paired catchments must be done with rigorous criteria (e.g. similar climate and geology) and identified the advan-tages and limitations of the approach. The main advantage is that the same time periods are automatically compared, therefore allowing climatic variability to be accounted for in the analysis. Furthermore, the approach uses catchment-scale observation data, allowing information to be gained on the catchment level, with all of the catchment processes in-cluded. The other advantage of using an observation-only ap-proach is that human actions and feedbacks are represented in the data, whereas most hydrological models currently do not include all anthropogenic processes yet. Whilst there are some uncertainties with regard to input data and catchment similarity, it is important to note that these uncertainties are similar to other methods used to quantifying the human in-fluence on hydrological drought.
influence hydrological droughts. Paired catchments could be used to further investigate the impact of other human activities on hydrological droughts using observation data. Through an increased understanding of how human activities influence hydrological droughts, this knowledge can then be used for water resource management and for improving hy-drological modelling.
Data availability. The UK data and metadata are available via the National River Flow Archive (NRFA, 2018). The data of the human-influenced catchment Blackwater (37017, at Stisted) can be downloaded here: https://nrfa.ceh.ac.uk/data/station/meanflow/ 37017 (NRFA, 2019a). The data of the benchmark catchment Chelmer (37011, at Churchend) can be downloaded here: https: //nrfa.ceh.ac.uk/data/station/meanflow/37011 (NRFA, 2019b). The Australian data and metadata are available via the Bureau of Meteorology (http://www.bom.gov.au/waterdata/) (BOM, 2019). The human-influenced catchment Cox at Tambar Springs is sta-tion no. 419033, and the Cockburn at Mulla Crossing is stasta-tion no. 419016.
Author contributions. AFVL and SR contributed equally to this work. AFVL and HAJVL conceived the original idea, AFVL de-veloped the analysis code, SR performed the analysis, GC and FVO contributed local data for the case studies and helped with the interpretation of the results, and all authors helped shape the re-search and discussed results. SR, AFVL, GC, FVO, and JABN made the figures and AFVL and SR wrote the paper with contributions from all co-authors.
Competing interests. The authors declare that they have no conflict of interest.
Acknowledgements. Anne F. Van Loon and Sally Rangecroft were supported by Rubicon NWO grant “Adding the human dimension to drought” (reference number: 2004/08338/ALW). Gemma Coxon was supported by NERC MaRIUS: Managing the Risks, Impacts and Uncertainties of droughts and water Scarcity, grant num-ber NE/L010399/1. We thank Wouter Coomans (Wageningen Uni-versity) for collating and analysing the Australian data. The re-search also contributed to the European Union-funded H2020 project ANYWHERE (contract no. 700099). It is part of the IAHS Panta Rhei Drought in the Anthropocene working group and it supports the work of the UNESCO-IHP VIII FRIEND-Water pro-gramme and the propro-gramme of the Wageningen Institute for En-vironment and Climate Research (WIMEK-SENSE). The drought analysis R code is available upon request. We thank the editor, Markus Hrachowitz, and the reviewers Jamie Hannaford, Sivara-jah Mylevaganam, and two anonymous reviewers for their com-ments and suggestions, which greatly improved this paper.
Review statement. This paper was edited by Markus Hrachowitz and reviewed by Jamie Hannaford and two anonymous referees.
References
AEDA: The Ely Ouse Essex water transfer scheme, Agri-cultural & Environmental Data Achieve, available at: http://www.environmentdata.org/archive/ealit:4162 (last ac-cess: 24 March 2019), 1990.
Alila, Y., Kura´s, P. K., Schnorbus, M., and Hudson, R.: Forests and floods: A new paradigm sheds light on age-old controversies, Water Resour. Res., 45, W08416, https://doi.org/10.1029/2008WR007207, 2009.
Andréassian, V.: Waters and forests: from historical controversy to scientific debate, J. Hydrol., 291, 1–27, 2004.
Andréassian, V., Lerat, J., Le Moine, N., and Perrin, C. Neighbors: Nature’s own hydrological models, J. Hydrol., 414, 49–58, 2012. Bari, M. A., Smith, N., Ruprecht, J. K., and Boyd, B. W.: Changes in streamflow components following logging and re-generation in the Southern forest of Western Australia, Hy-drol. Process., 10, 447–461, https://doi.org/10.1002/(SICI)1099-1085(199603)10:3<447::AID-HYP431>3.0.CO;2-1, 1996. Barker, L. J., Hannaford, J., Chiverton, A., and Svensson, C.:
From meteorological to hydrological drought using standard-ised indicators, Hydrol. Earth Syst. Sci., 20, 2483–2505, https://doi.org/10.5194/hess-20-2483-2016, 2016.
Bates, C. G.: First results in the streamflow experiment, Wagon Wheel Gap, Colorado, J. Forest., 19, 402–408, 1921.
Best, A., Zhang, L., McMahon, T., Western, A., and Vertessy, R.: A critical review of paired catchment studies with reference to seasonal flows and climatic variability, Murray-Darling Basin Commission, CSIRO Land and Water Technical Report 25/03, CSIRO, Canberra, 2003.
Birkinshaw, S. J.: Comment on “A paradigm shift in understanding and quantifying the effects of forest harvesting on floods in snow environments” by Kim C. Green and Younes Alila, Water Resour. Res., 50, 2765–2768, 2014.
BOM – Bureau of Meteorology: Water Data Online, available at: http://www.bom.gov.au/waterdata/, last access: 25 March 2019. Bosch, J. M. and Hewlett, J. D.: A review of catchment
ex-periments to determine the effect of vegetation changes on water yield and evapotranspiration, J. Hydrol., 55, 3–23, https://doi.org/10.1016/0022-1694(82)90117-2, 1982.
Brooks, A. P., Brierley, G. J., and Millar, R. G.: The long-term control of vegetation and woody debris on channel and flood-plain evolution: insights from a paired catchment study in southeastern Australia, Geomorphology, 51, 7–29, https://doi.org/10.1016/S0169-555X(02)00323-9, 2003. Brown, A. E., Zhang, L., McMahon, T. A., Western, A.
W., and Vertessy, R. A.: A review of paired catch-ment studies for determining changes in water yield result-ing from alterations in vegetation, J. Hydrol., 310, 28–61, https://doi.org/10.1016/j.jhydrol.2004.12.010, 2005.
Calder, I. R. and Aylward, B.: Forest and Floods, Water Int., 31, 87–99, https://doi.org/10.1080/02508060608691918, 2006. Cornish, P. M.: The effect of logging and forest regeneration on
wa-ter yields in a moist eucalypt forest in New South Wales, Aus-tralia, J. Hydrol., 150, 301–322, https://doi.org/10.1016/0022-1694(93)90114-O, 1993.
Res., 51, 5531–5546, https://doi.org/10.1002/2014WR016532, 2015.
Destouni, G., Jaramillo, F., and Prieto, C.: Hydroclimatic shifts driven by human water use for food and energy production, Nat. Clim. Change, 3, 213–217, 2013.
Ellison, D. N., Futter, M., and Bishop, K.: On the forest cover– water yield debate: from demand-to supply-side thinking, Global Change Biol., 18, 806–820, 2012.
Farley, K. A., Jobbagy, E. G., and Jackson, R. B.: Effects of afforestation on water yield: a global synthesis with im-plications for policy, Global Change Biol., 11, 1565–1576, https://doi.org/10.1111/j.1365-2486.2005.01011.x, 2005. Fleig, A. K., Tallaksen, L. M., Hisdal, H., and Demuth, S.: A
global evaluation of streamflow drought characteristics, Hydrol. Earth Syst. Sci., 10, 535–552, https://doi.org/10.5194/hess-10-535-2006, 2006.
Folton, N., Andréassian, V., and Duperray, R.: Hydrological im-pact of forest-fire from paired-catchment and rainfall-runoff modelling perspectives, Hydrolog. Sci. J., 60, 1213–1224, https://doi.org/10.1080/02626667.2015.1035274, 2015. Green, D., Petrovic, J., Moss, P., and Burrell, M.: Water resources
and management overview: Namoi catchment, NSW Office of Water, Sydney, 2011.
Gupta, H. V., Perrin, C., Blöschl, G., Montanari, A., Kumar, R., Clark, M., and Andréassian, V.: Large-sample hydrology: a need to balance depth with breadth, Hydrol. Earth Syst. Sci., 18, 463– 477, https://doi.org/10.5194/hess-18-463-2014, 2014.
Harris, D. D.: Hydrologic changes after logging in two small Ore-gon Coastal watersheds, US Geological Survey Water-Supply Paper 2037, US Geological Survey, Washington, D.C., USA, 1977.
Haslinger, K., Koffler, D., Schöner, W., and Laaha, G.: Exploring the link between meteorological drought and streamflow: Effects of climate-catchment interaction, Water Resour. Res., 50, 2468– 2487, https://doi.org/10.1002/2013WR015051, 2014.
Heudorfer, B. and Stahl, K.: Comparison of different threshold level methods for drought propagation analysis in Germany, Hydrol. Res., 48, 1311–1326, https://doi.org/10.2166/nh.2016.258, 2016. Hewlett, J. D.: Comments on the catchment experiment to deter-mine vegetal effects on water yield, Water Resour. Bull., 7, 376– 381, https://doi.org/10.1111/j.1752-1688.1971.tb05920.x, 1971. Hewlett, J. D. and Hibbert, A. R.: Increases in water yield after several types of forest cutting, in: IAHS Bulletin, Vol. 6, IAHS, Wallingford, 5–17, 1961.
Hisdal, H. and Tallaksen, L. M.: Drought Event Definition, Techni-cal Report No. 6: Assessment of the Regional Impact of Droughts in Europe, Department of Geophysics, University of Oslo, Oslo, Norway, 2000.
Hisdal, H., Tallaksen, L. M., Clausen, B., Peters, E., and Gustard, A.: Drought characteristics, in: Hydrological drought: processes and estimation methods for streamflow and groundwater, De-velopments in Water Science, edited by: Tallaksen, L. M. and Van Lanen, H. A. J., Elsevier, Amsterdam, the Netherlands, 139– 198, 2004.
Hornbeck, J. W., Adams, M. B., Corbett, E. S., Verry, E. S., and Lynch, J. A.: Long-term impacts of forest treatments on water yield: a summary for northeastern USA, J. Hydrol., 150, 323– 344, https://doi.org/10.1016/0022-1694(93)90115-P, 1993.
Hrachowitz, M., Savenije, H. H. G., Blöschl, G., McDonnell, J. J., Sivapalan, M., Pomeroy, J. W., Arheimer, B., Blume, T., Clark, M. P., Ehret, U., Fenicia, F., Freer, J. E., Gelfan, A., Gupta, H. V., Hughes, D. A., Hut, R. W., Montanari, A., Pande, S., Tetzlaff, D., Troch, P. A., Uhlenbrook, S., Wagener, T., Winsemius, H. C., Woods, R. A., Zehe, E., and Cudennec, C.: A decade of Predic-tions in Ungauged Basins (PUB) – a review, Hydrolog. Sci. J., 58, 1198–1255, https://doi.org/10.1080/02626667.2013.803183, 2013.
Ivkovic, K. M., Croke, B. F. W., and Kelly, R. A.: Overcoming the challenges of using a rainfall-runoff model to estimate the im-pacts of groundwater extraction on low flows in an ephemeral stream, Hydrol. Res., 45, 58–72, 2014.
Jackson, R. B., Jobbagy, E. G., and Nosetto, M. D.: Ecohydrol-ogy in a human-dominated landscape, EcohydrolEcohydrol-ogy, 2, 383– 389, https://doi.org/10.1002/eco.81, 2009.
Jaramillo, F. and Destouni, G.: Local flow regulation and irrigation raise global human water consumption and footprint, Science, 350, 1248–1251, 2015.
Keller, V. D. J., Tanguy, M., Prosdocimi, I., Terry, A., Hitt, O., Cole, S. J., Fry, M., Morris, D. G., and Dixon, H.: CEH-GEAR: 1 km resolution daily and monthly areal rainfall estimates for the UK for hydrological and other applications, Earth Syst. Sci. Data, 7, 143–155, https://doi.org/10.5194/essd-7-143-2015, 2015. Keppeler, E. and Ziemer, R.: Logging effects on streamflow:
water yield and summer low flows at Caspar Creek in northwestern California, Water Resour. Res., 26, 1669–1679, https://doi.org/10.1029/WR026i007p01669, 1990.
Kreibich, H., Krueger, T., Van Loon, A. F., Mejia, A., Junguo Liu, J., McMillan, H., and Castellarin, A.: Scientific debate of Panta Rhei research – how to advance our knowledge of changes in hydrology and society?, Hydrolog. Sci. J., 62, 331–333, https://doi.org/10.1080/02626667.2016.1150032, 2017. Lehner, B., Reidy Liermann, C., Revenga, C., Vorosmarty, C.,
Fekete, B., Crouzet, P., Doll, P., Endejan, M., Frenken, K., Magome, J., Nilsson, C., Robertson, J. C., Rodel, R., Sindorf, N., and Wisser, D.: Global Reservoir and Dam Database, Ver-sion 1 (GRanDv1): Reservoirs, ReviVer-sion 01, NASA Socioeco-nomic Data and Applications Center (SEDAC), Palisades, NY, https://doi.org/10.7927/H4HH6H08, 2011a.
Lehner, B., Reidy Liermann, C., Revenga, C., Vörösmarty, C., Fekete, B., Crouzet, P., Döll, P., Endejan, M., Frenken, K., Magome, J., Nilsson, C., Robertson, J. C., Rodel, R., Sindorf, N., and Wisser, D.: High-Resolution Mapping of the World’s Reser-voirs and Dams for Sustainable River-Flow Management, Front. Ecol. Environ., 9, 494–502, https://doi.org/10.1890/100125, 2011b.
Liu, Y., Ren, L., Zhu, Y., Yang, X., Yuan, F., Jiang, S., abd Ma, M.: Evolution of Hydrological Drought in Hu-man Disturbed Areas: A Case Study in the Laohahe Catch-ment, Northern China, Adv. Meteorol., 2016, 5102568, https://doi.org/10.1155/2016/5102568, 2016.
Mathews, R. and Richter, B. D.: Application of the Indicators of hydrologic alteration software in environmental flow setting 1, J. Am. Water Resour. Assoc., 43, 1400–1413, 2007.
McMillan, H., Krueger, T., and Freer, J.: Benchmarking ob-servational uncertainties for hydrology: rainfall, river dis-charge and water quality, Hydrol. Process., 26, 4078–4111., https://doi.org/10.1002/hyp.9384, 2012.
McMillan, H., Montanari, A., Cudennec, C., Savenije, H., Kreibich, H., Krueger, T., Liu, J., Mejia, A., Van Loon, A. F., Aksoy, H., Di Baldassarre, G., Huang, Y., Mazvimavi, D., Rogger, M., Sivakumar, B., Bibikova, T., Castellarin, A., Chen, Y., Finger, D., Gelfan, A., Hannah, D. M., Hoekstra, A. Y., Li, H., Maskey, S., Mathevet, T., Mijic, A., Pedrozo Acuña, A., Polo, M. J., Rosales, V., Smith, P., Viglione, A., Srinivasan, V., Toth, E., van Nooyen, R., and Xia, J.: Panta Rhei 2013–2015: global perspectives on hydrology, society and change, Hydrolog. Sci. J., 61, 1174–1191, https://doi.org/10.1080/02626667.2016.1159308, 2016. Montanari, A., Young, G., Savenije, H. H. G., Hughes, D.,
Wa-gener, T., Ren, L. L., Koutsoyiannis, D., Cudennec, C., Toth, E., Grimaldi, S., Blöschl, G., Sivapalan, M., Beven, K., Gupta, H., Hipsey, M., Schaefli , B., Arheimer, B., Boegh, E., Schy-manski, S. J., Di Baldassarre, G., Yu, B., Hubert, P., Huang, Y., Schumann, A., Post, D., Srinivasan, V., Harman, C., Thomp-son, S., Rogger, M., Viglione, A., McMillan, H., Charack-lis, G., Pang, Z., and Belyaev, V.: “Panta Rhei – Everything Flows”: Change in hydrology and society – The IAHS Sci-entific Decade 2013–2022, Hydrolog. Sci. J., 58, 1256–1275, https://doi.org/10.1080/02626667.2013.809088, 2013.
NRFA: National River Flow Archive, UK, available at: http://nrfa. ceh.ac.uk (last access: 7 March 2019), 2018.
NRFA: 37017 – Blackwater at Stisted, available at: https://nrfa. ceh.ac.uk/data/station/info/37017 (last access: 25 March 2019), 2019a.
NRFA: 37011 – Chelmer at Churchend, available at: https://nrfa. ceh.ac.uk/data/station/info/37011 (last access: 25 March 2019), 2019b.
NSW – New South Wales Government: WaterNSW, Aus-tralia, available at: http://waterinfo.nsw.gov.au/ (last access: 7 March 2019), 2018.
Oudin, L., Kay, A., Andréassian, V., and Perrin, C.: Are seemingly physically similar catchments truly hydro-logically similar?, Water Resour. Res., 46, W11558, https://doi.org/10.1029/2009WR008887, 2010.
Peñas, F. J., Barquín, J., and Álvarez, C.: Assessing hydrologic al-teration: Evaluation of different alternatives according to data availability, Ecol. Indicat., 60, 470–482, 2016.
Poff, N. L., Richter, B. D., Arthington, A. H., Bunn, S. E., Naiman, R. J., Kendy, E., Acreman, M., Apse, C., Bledsoe, B. P., Freeman, M. C., and Henriksen, J.: The ecological limits of hydrologic alteration (ELOHA): a new framework for developing regional environmental flow standards, Freshwater Biol., 55., 147–170, 2010.
Prosdocimi, I., Kjeldsen, T. S., and Miller, J. D.: Detection and attri-bution of urbanization effect on flood extremes using nonstation-ary flood-frequency models, Water Resour. Res., 51, 4244–4262, https://doi.org/10.1002/2015WR017065, 2015.
Putro, B., Kjeldsen, T. R., Hutchins, M. G., and Miller, J.: An empirical investigation of climate and land-use effects on water quantity and quality in two urbanising catchments in the south-ern United Kingdom, Sci. Total Environ., 548–549, 164–172, https://doi.org/10.1016/j.scitotenv.2015.12.132, 2016.
Querner, E. P. and Van Lanen, H. A. J.: Impact assessment of drought mitigation measures in two adjacent Dutch basins using simulation modelling, J. Hydrol., 252, 51–64, 2001.
Querner, E. P., Tallaksen, L. M., Kašpárek, L., and Van Lanen, H. A. J.: Impact of land-use, climate change and groundwater abstrac-tion on streamflow droughts basin using physically-based mod-els, in: FRIEND’97 – Regional Hydrology: Concepts and Mod-els for Sustainable Water Resource Management, IAHS Publ. no. 246, edited by: Gustard, A., Blaskova, S., Brilly, M., Demuth, S., Dixon, J., van Lanen, H., Llasat, C., Mkhandi, S., and Servat, E., Wallingford, UK, 171–179, 1997.
Rangecroft, S., Van Loon, A. F., Maureira, H., Verbist, K., and Hannah, D. M.: An observation-based method to quantify the human influence on hydrological drought: upstream–downstream comparison, Hydrolog. Sci. J., https://doi.org/10.1080/02626667.2019.1581365, in press, 2019.
Rees, G., Marsh, T. J., Roald, L., Demuth, S., Van Lanen, H. A. J., and Kašpárek, L.: Hydrological Data, in: chap. 4, Hydrological drought: processes and estimation methods for streamflow and groundwater, Developments in Water Science 48, edited by: Tal-laksen, L. M. and Van Lanen, H. A. J., Elsevier, Amsterdam, the Netherlands, 99–138, 2004.
Robinson, M. and Rycroft, D. W.: The impact of drainage on streamflow, in: in: cahp. 23, Agricultural Drainage. Agronomy. Monograph 38, edited by: Skaggs, W. and van Schilfgaarde, J., American Society of Agronomy, Madison, Wisconsin, 753–786, 1999.
Scott, D. F. and Smith, R. E.: Preliminary empirical models to pre-dict reductions in annual and low flows resulting from afforesta-tion, Water SA, 23, 135–140, 1997.
Smakhtin, V. U.: Low flow hydrology: a review, J. Hydrol., 240, 147–186, 2001.
Srinivasan, V., Sanderson, M., Garcia, M., Konar, M., Blöschl, and Sivapalan, M.: Prediction in a socio-hydrological world, Hydrolog. Sci. J., 62, 338–345, https://doi.org/10.1080/02626667.2016.1253844, 2017. Stoelzle, M., Stahl, K., Morhard, A., and Weiler, M.:
Stream-flow sensitivity to drought scenarios in catchments with different geology, Geophys. Res. Lett., 41, 6174–6183, https://doi.org/10.1002/2014GL061344, 2014.
Swank, W. T., Vose, J. M., and Elliott, K. J.: Long-term hydrologic and water quality responses following commercial clearcutting of mixed hardwoods on a southern Appalachian catchment, For-est Ecol. Manage., 143, 163–178, 2001.
Tallaksen, L. M. and Van Lanen, H. A. J. (Eds.): Hydrological drought: processes and estimation methods for streamflow and groundwater, in: Developments in Water Science 48, Elsevier Science B.V., Amsterdam, the Netherlands, 2004.
Tijdeman, E., Hannaford, J., and Stahl, K.: Human influ-ences on streamflow drought characteristics in England and Wales, Hydrol. Earth Syst. Sci., 22, 1051–1064, https://doi.org/10.5194/hess-22-1051-2018, 2018.
UNESCO: Water in a changing world. The United Nations World Water Development Report 3, World Water Assessment Pro-gramme, UNESCO, Paris, France, 2009.
Pro-gramme VIII, IHP-VIII (2014–2021), UNESCO, Paris, France, 2012.
Van Dijk, A. I. J. M., Beck, H. E., Crosbie, R. S., de Jeu, R. A. M., Liu, Y. Y., Podger, G. M., Timbal, B., and Viney, N. R.: The Mil-lennium Drought in southeast Australia (2001–2009): Natural and human causes and implications for water resources, ecosys-tems, economy and society, Water Resour. Res., 49, 1040–1057, https://doi.org/10.1002/wrcr.20123, 2013.
Van Lanen, H. A. J., Fendeková, M., Kupczyk, E., Kasprzyk, A., and Pokojski, W.: Flow Generating Processes, in: chap. 3, Hydro-logical Drought, Processes and Estimation Methods for Stream-flow and Groundwater, Developments in Water Science 48, edited by: Tallaksen, L. M. and Van Lanen, H. A. J., Elsevier Science B.V., Amsterdam, the Netherlands, 53–96, 2004a. Van Lanen, H. A. J., Kašpárek, L., Novický, O., Querner, E.
P., Fendeková, M., and Kupczyk, E.: Human Influences, in: chap. 9. Hydrological Drought, Processes and Estimation Meth-ods for Streamflow and Groundwater, Developments in Water Science 48, edited by: Tallaksen, L. M. and van Lanen, H. A. J., Elsevier Science B.V., Amsterdam, the Netherlands, 347–410, 2004b.
Van Lanen, H. A. J., Wanders, N., Tallaksen, L. M., and Van Loon, A. F.: Hydrological drought across the world: impact of climate and physical catchment structure, Hydrol. Earth Syst. Sci., 17, 1715–1732, https://doi.org/10.5194/hess-17-1715-2013, 2013. Van Loon, A. F.: Hydrological drought explained, WIREs Water, 2,
359–392, https://doi.org/10.1002/wat2.1085, 2015.
Van Loon, A. F. and Laaha, G.: Hydrological drought severity ex-plained by climate and catchment characteristics, J. Hydrol., 526, 3–14, https://doi.org/10.1016/j.jhydrol.2014.10.059, 2015. Van Loon, A. F. and Van Lanen, H. A. J. Making the
distinc-tion between water scarcity and drought using an observadistinc-tion- observation-modeling framework, Water Resour. Res., 49, 1483–1502, https://doi.org/10.1002/wrcr.20147, 2013.
Van Loon, A. F. and Van Lanen, H. A. J.: Testing the observation-modelling framework to distinguish between hydrological drought and water scarcity in case studies around Europe, Eu-ropean Water, 49, 65–75, 2015.
Van Loon, A. F., Gleeson, T., Clark, J., Van Dijk, A. I. J. M., Stahl, K., Hannaford, J., Di Baldassarre, G., Teuling, A. J., Tallaksen, L. M., Uijlenhoet, R., Hannah, D. M., Sheffield, J., Svoboda, M., Verbeiren, B., Wagener, T., Rangecroft, S., Wanders, N., and Van Lanen, H. A. J.: Drought in the Anthropocene, Nat. Geosci., 9, 89–91, https://doi.org/10.1038/ngeo2646, 2016a.
Van Loon, A. F., Gleeson, T., Clark, J., Van Dijk, A. I. J. M., Stahl, K., Hannaford, J., Di Baldassarre, G., Teuling, A. J., Tallaksen, L. M., Uijlenhoet, R., Hannah, D. M., Sheffield, J., Svoboda, M., Verbeiren, B., Wagener, T., Rangecroft, S., Wanders, N., and Van Lanen, H. A. J.: Drought in a human-modified world: reframing drought definitions, understanding and analysis approaches, Hydrol. Earth Syst. Sci., 20, 3631– 3650, https://doi.org/10.5194/hess-20-3631-2016, 2016b. Veldkamp, T. I. E., Wada, Y., de Moel, H., Kummuc,
M., Eisner, S., Aerts, J. C. J. H., and Ward, P. J.: Changing mechanism of global water scarcity events: Im-pacts of socioeconomic changes and inter-annual hydro-climatic variability, Global Environ. Change, 32, 18–29, https://doi.org/10.1016/j.gloenvcha.2015.02.011, 2015. Wada, Y., Bierkens, M. F. P., De Roo, A., Dirmeyer, P. A.,
Famigli-etti, J. S., Hanasaki, N., Konar, M., Liu, J., Müller-Schmied, H., Oki, T., Pokhrel, Y., Sivapalan, M., Troy, T. J., van Dijk, A. I. J. M., Van Emmerik, T., Van Huijgevoort, M. H. J., Van La-nen, H. A. J., Vörösmarty, C. J., Wanders, N., and Wheater, H. Human-water interface in hydrological modeling: current status and future directions, Hydrol Earth Syst. Sci., 21, 4169–4193, https://doi.org/10.5194/hess-21-4169-2017, 2017.
Wagener, T., Wheater, H. S., and Gupta, H. V.: Rainfall-Runoff Modelling in Gauged and Ungauged Catchments, Imperial Col-lege Press, London, p. 300, 2004.
Wagener, T., Sivapalan, M., Troch, P. A., McGlynn, B. L., Har-man, C. J., Gupta, H. V., Kumar, P., Rao, P. S. C., Basu, N. B., and Wilson, J. S.: The future of hydrology: An evolving sci-ence for a changing world, Water Resour. Res., 46, W05301, https://doi.org/10.1029/2009WR008906, 2010.
Wanders, N. and Wada, Y.: Human and climate impacts on the 21st century hydrological drought, J. Hydrol., 526, 208–220, 2015.
Wilhite, D. A. and Glantz, M. H.: Understanding the drought phe-nomenon: the role of definitions, Water Int., 10, 111–120, 1985. Yevjevich, V. An objective approach to definition and investigations of continental hydrologic droughts, Hydrology Papers 23, Col-orado State University, Fort Collins, USA, 1967.