ScholarWorks @ Georgia State University
ScholarWorks @ Georgia State University
Mathematics Dissertations Department of Mathematics and Statistics
Spring 5-13-2013
Advanced Designs of Cancer Phase I and Phase II Clinical Trials
Advanced Designs of Cancer Phase I and Phase II Clinical Trials
Ye Cui
Follow this and additional works at: https://scholarworks.gsu.edu/math_diss
Recommended Citation Recommended Citation
Cui, Ye, "Advanced Designs of Cancer Phase I and Phase II Clinical Trials." Dissertation, Georgia State University, 2013.
https://scholarworks.gsu.edu/math_diss/15
This Dissertation is brought to you for free and open access by the Department of Mathematics and Statistics at ScholarWorks @ Georgia State University. It has been accepted for inclusion in Mathematics Dissertations by an authorized administrator of ScholarWorks @ Georgia State University. For more information, please contact
ADVANCED DESIGNS OF CANCER PHASE I AND PHASE II CLINICAL TRIALS
by
YE CUI
Under the Direction of Ruiyan Luo and Zhengjia Chen
ABSTRACT
The clinical trial is the most import study for the development of successful novel drugs.
The aim of this dissertation is to develop innovative statistical methods to overcome the three
main obstacles in clinical trials: (1) lengthy trial duration and inaccurate maximum tolerated dose
(MTD) in phase I trials; (2) heterogeneity in drug effect when patients are given the same
prescription and same dose; and (3) high failure rates of expensive phase III confirmatory trials
due to the discrepancy in the endpoints adopted in phase II and III trials. Towards overcoming
the first obstacle, we originally develop a hybrid design for the time-to-event dose escalation
method with overdose control using a normalized equivalent toxicity score (NETS) system. This
hybrid design can substantially reduce sample size, shorten study length, and estimate accurate
MTD by employing a parametric model and adaptive Bayesian approach. Toward overcoming
proposed design in phase I clinical trials which considers the personalized information for
patients who participant in the trials. To conquer the third obstacle, we propose a novel
two-stage screening design for phase II trials whereby the endpoint of percent change in of tumor size
is used in an initial screening to select potentially effective agents within a short time interval
followed by a second screening stage where progression free survival is estimated to confirm the
efficacy of agents. These research projects will substantially benefit both cancer patients and
researchers by improving clinical trial efficiency and reducing cost and trial duration. Moreover,
they are of great practical meaning since cancer medicine development is of paramount
importance to human health care.
ADVANCED DESIGNS OF CANCER PHASE I AND PHASE II CLINICAL TRIALS
by
YE CUI
A Dissertation Submitted in Partial Fulfillment of the Requirements for the Degree of
Doctor of Philosophy
in the College of Arts and Sciences
Georgia State University
Copyright by
Ye Cui
ADVANCED DESIGNS OF CANCER PHASE I AND PHASE II CLINICAL TRIALS
by
YE CUI
Committee Chair: Ruiyan Luo
Committee: Zhengjia Chen
Xin Qi
Yichuan Zhao
Electronic Version Approved:
Office of Graduate Studies
College of Arts and Sciences
Georgia State University
DEDICATION
I dedicate this dissertation to my husband, who supported me each step of the way.
Also, my unreserved gratitude goes to my parents who always encouraged and support all of my
ACKNOWLEDGEMENTS
The writing of this dissertation has been one of the most significant academic challenges
I have ever had to face. I would not be able to finish this dissertation without the help of so many
people in so many ways.
I would like to express my deepest appreciation to my committee chair, Dr. Ruiyan Luo
for her guidance, understanding, patience, and most importantly, her friendship during my
graduate studies at Georgia State. She was always there, listening and encouraging me for both
my study and life.
I would like to gratefully and sincerely thank my co-advisor Dr. Zhengjia Chen, who
continually and convincingly conveyed a spirit of adventure and an excitement in regard to
research. Had I not attended his presentation, I would not have pursued the study of clinical trial
design.
I would like to thank my committee members, Dr. Zhao and Dr. Qi, who patiently
corrected my writing and gave me many valuable suggestions with my research and further
work. I would also like to thank Dr. Qin, and Dr. Xiao, for guiding my research for the past
several years and helping me to develop my background in statistics, and public health.
I would also thank Department of Mathematics and Statistics at Georgia State, especially
those members of my doctoral committee for their input, valuable discussions and accessibility.
My research would not have been possible without their helps.
Finally, and most importantly, I would like to thank my parents, and my family. They
were always supporting me and encouraging me with their best wishes. And a special thank you
to my husband, Zhibo Wang. He was always there cheering me up and stood by me through the
TABLE OF CONTENTS
ACKNOWLEDGEMENTS ... v
TABLE OF CONTENTS ... vi
LIST OF TABLES ... x
LIST OF FIGURES ... xiii
1 INTRODUCTION ... 1
1.1 Statement of Need ... 1
1.2 Background Introduction ... 2
1.3 Purpose of the Study ... 7
1.4 A Outline Structure ... 9
2 A REVIEW OF PHASE I AND PHASE II CLINICAL TRIALS ... 11
2.1 Adaptive and Sequential Methods in Clinical Trials ... 11
Adaptive Design... 12
2.1.1 2.1.2 Sequential Design ... 14
2.2 Statistical Methodology of Phase I Clinical Trials ... 15
2.2.1 Rule Based Designs ... 20
2.2.2 Model Based Designs ... 24
2.3 Statistical Methodology of Phase II Clinical Trials ... 25
2.3.1 Standard Single-Arm Designs... 27
2.3.2 Randomized Phase II Design ... 29
3 HYBRID PHASE I DESIGN — EWOC-NETS-TITE ... 31
3.1 Introduction ... 33
3.1.2 Time-to-Event Approach in Dose-Finding Studies ... 35
3.1.3 Novel Toxicity Scoring System ... 36
3.2 A Hybrid Design for Phase I Clinical Trials — EWOC-NETS-TITE ... 39
3.2.1 EWOC ... 39
3.2.2 EWOC-TITE ... 41
3.2.3 EWOC-NETS-TITE ... 42
3.3 Simulation Study ... 45
3.3.1 Simulation Plan ... 46
3.3.2 Simulation Setup ... 48
3.4 Simulation Results ... 50
3.4.1 Estimation of MTD ... 50
3.4.2 Comparison of Trial Duration ... 58
3.5 Conclusion and Discussion ... 59
3.5.1 Comparison of MTD Accuracy ... 60
3.5.2 Comparison of Trial Length... 63
4 PERSONALIZED MTD FOR PHASE I CLINICAL TRIALS ... 64
4.1 Introduction ... 64
4.2 Personalized MTD for Phase I Clinical Trials ... 67
4.2.1 Binary Covariate Effect ... 68
4.2.2 Continuous Covariate Effect ... 70
4.3 Simulation Study ... 74
4.3.1 Simulation Plan ... 74
4.4 Simulation Results ... 80
4.4.1 Assumption of Existing Covariate Effect ... 80
4.4.2 Assumption of No Covariate Effect ... 83
4.5 Conclusion and Discussion ... 85
5 NOVEL TWO-STAGE PHASE II DESIGN ... 87
5.1 Introduction ... 88
5.2 Two-Stage Double Screening Phase II Design ... 92
5.2.1 Design Scheme... 92
5.2.2 Advantages of Proposed Phase II Design ... 94
5.2.3 Model of Changes in Tumor Sizes... 94
5.3 Simulation Study ... 96
5.3.1 Simulation Plan ... 96
5.3.2 Simulation Setup ... 98
5.4 Simulation Result ... 99
5.4.1 Success Rate in Follow Up Phase III Trials... 100
5.4.2 Model Sensitivity ... 103
5.4.3 Comparison with Conventional Design ... 105
5.5 Conclusion and Discussion ... 107
5.5.1 Percent Changes in Tumor Sizes as Endpoint in First Stage ... 107
5.5.2 PFS as Surrogate Endpoint of OS in Second Stage ... 108
5.5.3 Double Screening ... 108
5.5.4 Critical Value in First Stage ... 109
LIST OF TABLES
Table 1.1 Characteristic of cancer phase I, phase II, and phase III trials. ... 6
Table 2.1 Grade level for toxicity defined by CTCAE ... 17
Table 2.2 Terms in common phase I clinical trial designs ... 18
Table 2.3 Commonly used rule-based designs and model-based designs ... 20
Table 2.4 Common designs of phase II clinical trials ... 27
Table 3.1 Adjusted toxicity grade ... 37
Table 3.2 Summary of toxicity score system ... 38
Table 3.3 TNETS calculation with sample target toxicity profile ... 47
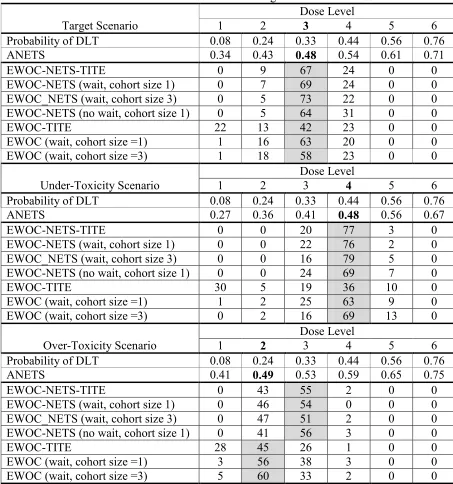
Table 3.4 Target scenario for toxicity profile ... 48
Table 3.5 Under-toxicity scenario for toxicity profile ... 48
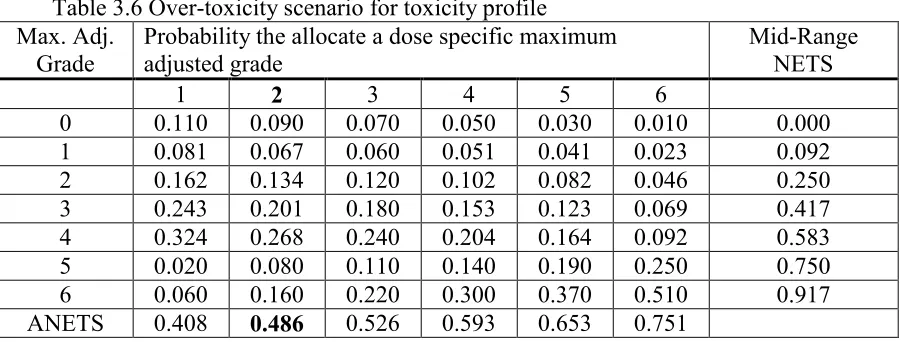
Table 3.6 Over-toxicity scenario for toxicity profile ... 49
Table 3.7 Over-toxicity scenario of 33% TTL and grade 3 true MTD ... 49
Table 3.8 Under-toxicity scenario for 33% TTL and grade 3 true MTD ... 49
Table 3.9 Percent of MTD recommended according to ANETS = 47.6% ... 51
Table 3.10 Percent of patients treated at each dose level ... 52
Table 3.11 MTD recommended for toxicity profile scenario 4 and scenario 5 ... 53
Table 3.12 Patients' distribution in dose levels for scenario 4 and scenario 5 ... 54
Table 3.13 Percent of MTD recommended according to ANETS = 47.6% sample of 30... 55
Table 3.14 Percent of patients treated at each dose level sample of 30 ... 56
Table 3.15 MTD recommended for toxicity profile scenario 4 and scenario 5 sample of 30 ... 57
Table 3.16 Patients' distribution in dose levels for scenario 4 and scenario 5 sample of 30 ... 58
Table 3.18 Simulated trial duration by mean arrival time ... 59
Table 4.1 Model setup for MTD estimation with covariate effect ... 77
Table 4.2 Model setup for MTD estimation without covariate effect ... 78
Table 4.3 Model setup for MTD estimation with covariate effect ... 79
Table 4.4 Model setup for MTD estimation without covariate effect ... 79
Table 4.5 Comparison of MTD estimation with/without binary covariate ... 81
Table 4.6 Comparison of MTD estimation using model with /ignoring covariate ... 81
Table 4.7 Accuracy of estimation for with binary covariate ... 82
Table 4.8 Accuracy of estimation for ... 82
Table 4.9 Proportion of overdosing with/without continuous covariate in the model... 82
Table 4.10 Proportion of overdosing with/without continuous covariate in the model... 83
Table 4.11Comparison of MTD estimation no binary covariate assumption ... 84
Table 4.12 Comparison of MTD estimation no continuous covariate assumption ... 84
Table 4.13Accuracy of estimation for parameters no binary covariate assumption ... 84
Table 4.14Accuracy of estimation for parameters no continuous covariate assumption ... 84
Table 4.15Proportion of overdosing no binary covariate assumption ... 85
Table 4.16 Proportion of overdosing no continuous covariate assumption ... 85
Table 5.1WHO and RECIST criteria for tumor response ... 90
Table 5.2 Sample size setup for simulation study... 98
Table 5.3 Parameter estimate for tumor size model ... 99
Table 5.5 Comparison of sensitivity, specificity, and accuracy in Simon’s two-stage design and
LIST OF FIGURES
Figure 1-1 Cancer Clinical Trial Process ... 3
Figure 2-1 3+3 dose escalation scheme (Chen et al., 2012) ... 22
Figure 3-1 Dose-toxicity relationship ... 43
Figure 4-1 Heterogeneity among patients ... 65
Figure 5-1 Two-stage double screening design ... 93
Figure 5-2 Progression-free survival time generation ... 97
1 INTRODUCTION
This dissertation consists of a series of studies conducted as part of cancer phase I and
phase II clinical trial designs. The first part of this dissertation sought to determine how and to
what extent the proposed hybrid phase I design reduces the trial duration and improve the dosage
accuracy. The second part of the dissertation sought to adjust the current phase I design with
respect to patients’ individualized characteristic among the population. The third part of the
dissertation sought to measure the improvement to the success rate and model sensitivity of
proposed two-stage phase II trial design.
1.1Statement of Need
Healthcare is a global topic. It is the common expectation for people to live a prolonged
and high quality of life, regardless of where we inhabit, what we eat or how we live. In one way
or another, people are connected by many of the same health issues, such as deaths from
non-communicable diseases — cancer, cardiovascular disease, diabetes and so forth. Today, the
purpose of medical research thus is to turn biomedical discoveries into practice to improve
human health. It worth unremitting study via the help of clinical trial researches and is of
paramount importance for the society as a whole.
Medical research has provided benefits for everyone with a longer and healthier life in
the United States — a world leader in the field. However, challenges are still exists. Tremendous
efforts have been made towards life-threatening diseases, such as cancer and AIDS on decades;
but little has been known to these persistent unsolved problems. Hence, continuous studies are
indispensable. Now, it has been the essential objectives of medical research to discover curative
Throughout the United States, cancer is the second leading cause of death, exceeded only
by heart disease, accounting for nearly one in every four deaths (Siegel, et al., 2012). In 2012,
about 1,638,910 new cancer cases would be diagnosed, and 577,190 Americans are expected to
die of this disease, more than 1,500 people per day (ACS, 2012). Cancer causes severe pain and
suffering for patients, as well as their families and friends. Moreover, the financial costs of
cancer are high for both cancer patients and the society as a whole. According to National
Institutes of Health estimates, direct cancer care costs $124.6 billion in the United States in 2010.
It is expected that the expenditures will increase at a faster rate as cancer prevalence increases.
Total costs will double if indirect costs are included, such as expenditure of cancer-related illness
and death (NIH, 2012). Today, forty years after President Richard Nixon signed the National
Cancer Act in 1971, with unremitting effort from all cancer researchers, the five-year relative
survival rate — an important standard to compare the effectiveness of treatments for all cancers
diagnosed between 2001 and 2007 grew to 67%, from 49% in the period 1975-1977 (Siegel, et
al., 2012). This improvement in survival reflects both progresses in diagnosing certain cancers at
an earlier stage and advance in medical treatment.
On the way of seeking effective therapeutic regimens for cancer, researchers have taken
big step forward in both diagnosing and treating the disease by using mechanisms of advanced
methods. Notably improvements in cancer treatment and relative survival rate have been made
through the help of clinical trials since 1975 (Jemal, et al., 2008), which is the prevailing
approach to develop candidate therapies.
1.2Background Introduction
Cancer clinical trials are investigations that conducted in human beings intended to
regulate the conduction of such trials are provided by FDA nationally, or international
[image:19.612.93.521.126.302.2]organizations, such as EU.
Figure 1-1 Cancer Clinical Trial Process
These studies apply the gold standard conveying biomedical theory and laboratory result
into practical therapeutic regimens. There are several steps—called “phases” that conducted
consecutively, with approval before performing each phase. Figure 1-1 illustrates the process of
a complete cancer trial which lasts more than 10 years. Patients who participate in a cancer
clinical trial, take part in only one phase most of the time. Phases are designed according to
different purposes.
Phase 0 trials are conducted before initiating traditional phase I dose escalation, which
primary goal is to evaluate pharmacodynamics and/or pharmacokinetic properties of the new
drug or the drug combination (Gupta, et al., 2011). In response to Investigational New Drug
(IND) guidance of FDA and European Medicines Agency, a phase 0 trial is an exploratory study
(Robinson, 2008). It is conducted only on a small number of patients (approximately 10-15) by
very small doses of the new drug or drug combinations as the safety or effectiveness of the new
drug or the drug combinations is unknown. It is used to investigate whether the drug approaches
the drug. A significant difference between phase 0 trials and later phases of cancer trials is that
phase 0 trials have no therapeutic intent (Kummar, et al., 2008). Because drug doses are low,
there’s also less risk to the patient in phase 0 studies compared to phase I studies. The patients
who take part in these trials usually have advanced disease, and no known effective treatment
options are available to them. Phase 0 studies help researchers find out whether the drugs do
what they are expected to do. This process may help avoid the delay and expense of finding out
years later in phase II or even phase III clinical trials that the drug doesn’t act as it was expected
to base on lab studies.
The principal purpose of cancer phase I clinical trials is to evaluate the safety of the new
anticancer drug, and determine the recommended dose and/or schedule of an experimental drug
or drug combination for efficacy testing in subsequent phase II trials (Lin, et al., 2001). A cancer
phase I trial may involve new drugs or drug combinations under development or new
combinations of already available drugs. It is usually conducted to small numbers of people (15
to 30), who are at advanced cancer stage that have progressed in spite of standard treatments
(Tourneau, et al., 2009). Since little is known with the new drugs or the drug combinations under
testing, it is essential to conduct a phase I trial carefully and thoughtfully. Usually the study
begins at a low dose and move forward if the treatment is considered to be safe. A distinction
between cancer phase I trials and other phase I trials is that the former ones have therapeutic aim.
The primary assumption underlying an anticancer drug is that toxicity is a prerequisite for
optimal antitumor activity. Therefore, cancer phase I designs should minimize exposures to
unnecessary non-therapeutic doses while preserve safety by minimize the number of patients
dose level or so called maximum tolerated dose (MTD) will be recommended in the subsequent
phase II and phase III trials.
Phase II studies play a pivotal role in anticancer drug development, which are conducted
to assess whether a new drug or a drug combination has sufficient the efficacy to warrant further
investigation. A cancer phase II trial usually involves fewer than 100 patients who have a
specific type of cancer or related cancers. Adopting information of MTD from preceding phase I
trials, these phase II studies aim to obtain a preliminary estimate of the effectiveness of antitumor
activities of new drugs or drug combinations (Brown, et al., 2011). Patients who take part in
phase II trials may or may not have been treated previously with standard treatment. In cancer
phase II trials effectiveness is usually measured by tumor response (shrinkage) that a 50% or
more shrinkage in tumor size is considered to be a successful treatment. Various alternate
endpoints have been proposed to assess the efficacy of treatment such as progression-free
survival (PFS), overall survival, biomarkers, and more recently, evaluation of tumor size as a
continuous variable (Dhani, et al., 2009). New drugs or drug combinations showing sufficient
activity in the phase II setting might be evaluated subsequently in a phase III comparative trial.
Phase III trials are the last step before approval, which primary goal is to compare the
effectiveness and side effects of the new drugs or drug combinations with the current standard
treatment for specific type of cancer. Phase III trials take one step forward than phase II trials
that only assess the effectiveness without comparing with standard treatment. If a new drug or a
drug combination is proven to be effective but shows no significant benefits over the current
used treatment; it is still considered as “failed”, and will not be approved for production. If a new
drug or a drug combination is more effective than the standard treatment and/or is easier to
1000s) are included in a phase III trial. A phase III trial usually designs as a randomized two
arms experiment; because patients who participate in phase III trials may or may not have been
treated previously as in proceeding phase II trials. New drugs or drug combinations that
identified as “success” in phase III studies will be approved for market and also be observed for
post-marketing surveillance trials to follow up safety and effectiveness issues (NCI, 2013). In
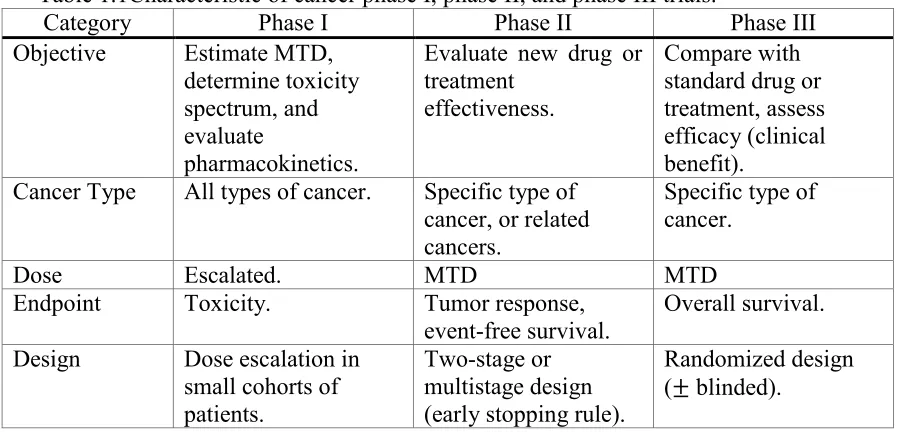
Table 1.1 we summarize the characteristics of phase I through phase III trials in the process of
[image:22.612.80.530.275.493.2]anticancer drug development.
Table 1.1Characteristic of cancer phase I, phase II, and phase III trials.
Category Phase I Phase II Phase III Objective Estimate MTD,
determine toxicity spectrum, and evaluate
pharmacokinetics.
Evaluate new drug or treatment
effectiveness.
Compare with standard drug or treatment, assess efficacy (clinical benefit).
Cancer Type All types of cancer. Specific type of cancer, or related cancers.
Specific type of cancer.
Dose Escalated. MTD MTD
Endpoint Toxicity. Tumor response,
event-free survival. Overall survival. Design Dose escalation in
small cohorts of patients.
Two-stage or multistage design (early stopping rule).
Randomized design ( blinded).
A phase IV trials — also called a post-marketing surveillance trial is the stage after a new
drug or drug combination has been approved by the FDA or other regulatory agencies for
standard use. The purpose of cancer phase IV studies is to continue investigating the new drugs
or drug combinations with the treatment effects and long-term safety. Phase IV trials usually
involves large number of patients from several hundred to as many as several thousand people.
These studies play a more and more important role in oncology drug development as it is
investigators will determine further research plans with the data collected during the trials (NCI,
2013).
1.3Purpose of the Study
In developing new anti-cancer drugs, statistics is an indispensable and crucial element
since clinical trial is a process that applies statistical inference theory into pharmaceutical
research. In this dissertation, we will focus on improving statistical designs of phase I and II
trials to find solutions to several major obstacles in cancer clinical studies.
In cancer phase I trials researchers determine the dose toxicity relation by observing how
the new drugs or drug combinations affect patients within a predefined time frame. A new
patient will not be enrolled in the trial until all current observations obtain their information
completely for majority of dose-escalation methods. In some other trials, new accrual is made
with simply omitting the most recent incomplete observations; and assessment of the toxicity is
based on all acquired information. However, both accrual methods raise some issues. The
former accrual plan complicates accesses of the patients. The repeated accrual suspensions will
also lead to longer trial duration and higher administrative cost. The reduced trial duration in the
later accrual plan causes a loss of dose-toxicity information.
Moreover, in most of all phase I trials the toxicity response is represented by a binary
indicator — dose limiting toxicity (DLT), which is defined as the toxic effects that are
considered to be severe enough to prevent further dose escalation. However, using the binary
indicator DLT may cause a loss in valuable information of the dose toxicity effect. For example,
the actual grade 4 non-reversible renal toxicity and grade 3 reversible neutropenia as both
classified as DLT, but the former one is much more severe than later one (Chen, et al., 2012).
are relatively small and designed with very limited number of patients, all toxicity information is
very precious and should be fully used to maximize the trial efficacy.
In recent years, more and more concerns are raised towards the assumption of population
homogeneity. Usually, in a cancer phase I trial, patients from the population are assumed to have
the same MTD. However, this assumption is considered to be violated as recent knowledge
obtained by the pharmacokinetics and the genetics of drug metabolism. For example, impaired
renal function can result in reduced clearance of carboplatin and a dosing formulae based on
renal function was developed (Newell, 1994). Taking patients individual characteristics into
account is a new direction in cancer phase I trial designs.
Additionally, in the conventional phase II trials, researchers assess the effectiveness of
the new drugs or drug combinations by investigating how and to what extent the tumor sizes
change. Usually, tumor shrinkages more than 50% is considered to be an objective response
(Julka, et al., 2008). The response rate is defined as the proportion of objective responses to all
responses, and is utilized as the primary endpoint to evaluate effectiveness of the anti-tumor
activity for the new drug or treatment. But concerns over the choice of response rate as the
primary endpoint in cancer phase II trials have been raised (Karrison, et al., 2007). First, loss of
information is the direct result of using the categorized variable tumor response. For example, a
tumor size shrinks of 40% and a tumor size increases of 80% are both identified as a
non-objective response, however, the treatment effects might be significantly distinct. Additionally,
the high failure rate in subsequent phase III trials also dues to the discrepancy of endpoints
between phase II and phase III trials.
In this dissertation, therefore, we will focus on the above concerns that have been well
efficiency, we will propose a hybrid design that considers four main competing interests: (1)
preserve the safety of patients take part in the trial; (2) take into account of time factor allowing
incomplete observations; (3) fully utilize all toxicity information; (4) incorporate patient’s
characteristics in the dose-toxicity model. For phase II trials, we proposed a novel two-stage
design with double screening stages to improve the conventional phase II trial designs from the
following aspects: (1) use continuous tumor size changes as endpoint in first screening stage; (2)
utilize PFS as endpoint in second screening stage enhance subsequent phase III trial success rate;
(3) double screening allows early termination which reduces the trial duration when no
promising results present in stage I.
1.4A Outline Structure
The rest part of this dissertation will follow the structure listed below.
In section 2.1 we will review two major methodologies — adaptive and sequential
methods that are frequently used in clinical trials. Additionally, section 2.2 explores statistical
methods adopted in phase I clinical trials with particular attention given to rule based designs
and model based designs. We will also review some commonly used statistical methods in phase
II clinical trials in section 2.3, where different types of phase II designs will also be introduced
and discussed.
In chapter 3 we will describe the first part of our research that had been done in the
program. We will propose a hybrid design for cancer phase I clinical trials. In section 3.1, we
will discuss the challenges for current phase I designs and the motivation to develop a new
design method. In section 3.2, we will provide a detailed description of our base model, dose
escalation method with overdose control, time to event method and the novel toxicity scoring
foundation for this design. In the last section of this chapter — section 3.3, we will provide a
description of how we set up the simulation scheme. Finally, we will summarize and discuss our
simulation results.
In chapter 4 we will discuss the second part of this dissertation. In section 4.1 we will
propose a design base on EWOC-NETS-TITE to incorporate patients’ characteristics. And in
section 4.2, we will provide a description of the simulation plan to assess the performance of the
model. In section 4.3 and section 4.4 are the simulation results and conclusion.
In chapter 5 we will describe the third part of research that had been done in the program.
In the first section — section 5.1, we will propose a novel two-stage phase II design with double
screening stages, and will provide an introduction to the research motivation. In section 5.2, we
will provide a detailed description of the design scheme that how do we set up the simulation
model. In the subsequent section — section 5.3, we will apply our proposed design to a
simulated trial to construct a comparison with the most popular used design—Simon’s two-stage
design for phase II clinical trials. This simulation study examines the performance of our
proposed phase II design by comparing success rate and model sensitivities to Simon’s design.
Finally in chapter 6, we will conclude our proposed designs, summarize the research we
have done for cancer clinical trial topic. In addition, we will explore possible directions and
2 A REVIEW OF PHASE I AND PHASE II CLINICAL TRIALS
2.1Adaptive and Sequential Methods in Clinical Trials
As we know, sample size in classical clinical trial designs is usually fixed and schedule is
set up without using ongoing information during the trials. However, there is an increasing
pressure on pharmaceutical companies and clinicians to re-examine the classical designs because
of the fact that increasing spending in biomedical research didn’t result in an increase of success
rate (Chow, et al., 2008). Therefore, adaptive and sequential designs have been increasingly
popular in clinical studies in recent years, which make the studies more efficient, more
informative and more flexible.
Both adaptive and sequential designs allow changes of one or more specified aspects in
the design or statistical procedure after initiation without impairing the validity and integrity of
the trial (FDA, 2010). The goal of using such methods is not only to be more efficient to identify
clinical benefits of the new drug under investigation, but also to improve the success rate of
process of drug development. Statistical procedures that allowed changing can be the criteria to
select and evaluate eligible patients, dose level of the testing drug or treatment, and schedule of
the study. Other modifiable aspects include, but not limited to: study endpoints, measurement
of clinical response, formulation of study objectives into statistical hypotheses, calculation of
minimum sample size, participant randomization, study monitoring with interim/futility analysis,
statistical data analysis plan, and so forth. Modifications are made to improve the performance of
a trial with prompt use accumulated data from ongoing trial as well as upcoming related
Adaptive Design 2.1.1
Adaptive design has been well discussed recently. An adaptive design is a clinical trial
design that allows clinicians to modify some aspects of the study using accumulating data while
it continues, without compromising the scientific method (Gallo, et al., 2006). This method is
commonly adopted by adaptive randomization design, group sequential design, sample size
re-estimation design, play-the-winner-and-drop-the-loser design, adaptive dose-finding design,
adaptive treatment-switching design, hypothesis-adaptive design, and adaptive seamless phase
II/III trial design to modify some aspects, such as sample size re-estimation, addition or removal
of a study arm, treatment switch, and so on. All these designs can be classified into two
categories — Bayesian and frequentist approaches. The frequentist approach performs the
modification of trials while controlling for type I and type II errors. The Bayesian approach
allows adaption according to the predicted probability. Recently, Bayesian approaches are
increasingly popular in clinical trial designs.
As we discussed in chapter 1, we focus only on the early phases trial designs in this
dissertation. An early phase I trial is conducted to determine MTD that dose levels are chosen
adaptively based on the response to the most recent dose. A phase II trial, which is conducted to
assess the new drug or treatment efficacy, is often done in two or more stages. It is also
considered to be an adaptive method, because the decision in later stage is made based on the
response in the previous stage (Cook, et al., 2010).
In phase I clinical trials an ongoing trial can be formulated by a function that logistic
function is often used to model many different dose toxicity response relationships. Here, we use
indicator of DLT. The logistic dose-toxicity model is defined by the probability of toxicity
response :
( ) ( )
( )
where we assume that so that the probability of DLT is an increasing function of dose,
and update is made when new response data become available (Chen, et al., 2012).
As we mentioned above, a phase II design with multi-stages is also considered to be
adaptive. Early stop feature is desired to reduce the trial duration and cost when the efficacy or
futility of the testing drug or treatment becomes obvious. In most phase II cancer clinical trials,
primary endpoint in one of the multi-stages (usually two-stages) is tumor response rate (Kramar,
et al., 1995). Then the hypothesis is usually stated as:
where true response rate is denoted by , is the uninteresting response rate, and is chosen
to be new drug or treatment’s target response rate.
A predefined type I error rate is utilized to control the null hypothesis. If the null
hypothesis is true, then stage II is preceded and a statistical power should be specified in
alternative hypothesis (Lin, et al., 2004). In a clinical trial, is easily to be identified but in
contrast, is not. In the early 1960’s, when anticancer treatment is not as efficient as of today,
Gehan (Gehan, 1960) proposed to use , and it is widely used for decades. Then in 1989,
Simon’s two-stage design was proposed, which generalize and initiate the idea “optimal” and
“minimax” design (Simon, 1989). There are many designs proposed later extend Simon’s
two-stage design, such as planned versus attained design (Green, et al., 1992), optimal three-two-stage
on. Additionally, some Bayesian designs have also been proposed recently, for example,
Bayesian two-stage designs for phase II clinical trials (Tan, et al., 2002).
2.1.2 Sequential Design
Sequential designs in clinical trials have some common characteristics with adaptive
design. They both allow modifications during the conduct of trial to design or statistical
procedures according to the accumulated data. But it is required to have a choice of a primary
patient response and of corresponding test statistics, a choice of stopping rule and a framework
for the analysis to perform a sequential clinical trial. In other words, a sequential method mainly
refers to the sequentially monitoring of stopping criteria for futility and efficacy (Todd, 1999).
When a clinical trial design is sequential, then infinite repetitions of the same sequential
scheme must be contemplated. This raises the issue of lack in valid analysis that results in the
design is not formally organized. But minor distinctions from the rule will only lead to negligible
inaccuracies of analysis. Therefore, it is common to establish a safety monitoring mechanism
(usually a committee) for major studies of life-threatening diseases. Recently, an unavoidable
conflict in all clinical trials between the welfare of patients in the study and the scientific goals of
the investigators attracts researchers’ attention. This conflict can be minimized if the stopping
rule is designed to cease the trial when it is predictable that the study has harmful impact on
patients’ safety or benefit. Therefore, a sequential design has the advantage of less likely to be in
conflict with ethical requirements than a fixed-sample design. The sample size of a sequential
study will be a random variable, with a distribution depending on the true treatment difference
and the stopping rule used. Therefore, a sequential design has the benefit of reduction in sample
However, disadvantages also exist in a sequential design. The major drawback of a
sequential design is that if the therapies under investigation are similar in their efficacies, the trial
may require more patients than fixed-sample analysis (Thompson, 1980). It is also stated by
researchers that a reliable statistical model need to be formulated before conducting the trial
which is sometimes impossible.
To conquer the above stated issues, considerable novel statistical researches have been
conducted in the development of adaptive and sequential approaches, especially for early phase’s
clinical trials — phase I and II trials. However, only limited numbers of the newly proposed
methods have actually been applied to the daily practice of real clinical trials (Chen, et al., 2012).
In section 2.2 and section 2.3, we will review significant and popularly used adaptive and
sequential methods that have been applied to phase I and phase II clinical trials and have had a
high impact on the field of clinical trials.
2.2Statistical Methodology of Phase I Clinical Trials
It must be agreed by investigators participant in clinical trial studies that designing a
clinical trial is when the researchers are struggling or are caught in the middle of two-front war.
One front of designing a clinical trial is driven by the requirement that the research effort should
be productive; the other is driven by statistical concerns.
There are two goals in conducting a phase I trial in cancer research: (1) determine an
optimal dose (recommended for phase II trial), and (2) preserve the safety of the treatment for
each individual patient as well as avoid too many cases to be treated at a conservative dose level.
The two goals are proposed because unlike researches conducted in most therapeutic areas, a
phase I trial is usually the first step to test the new drug or treatment in human beings
It is usually considered that a phase I trial is one of the most important steps in a drug
development process after laboratory and animal studies that confirm a therapeutic agent has
potential curative effect. Usually, the number of subjects in a phase I clinical trial is relatively
small, fifteen to thirty, sometime sample size can varies in the range of twenty to eighty.
Dose-toxicity response is used to model and determine the optimal dose which is set up by the widely
accepted assumption that the therapeutic effect of a drug depends on its toxicity and increases
monotonically with its dosage level (Tourneau, et al., 2009). Higher doses are associated with
both severe toxicity and better therapeutic effect. Therefore, a balance is to be achieved between
toxicity level and therapeutic benefit (Fanouriakis, et al., 2011). Seeking for the balance of
toxicity level and therapeutic effect is equivalent to searching for a maximum dosage of the new
drug under development. A patient should be treated with this maximum dose in the proceeding
phase II and phase III trials, at which level the patient can tolerate its associated toxicities but
should be with close monitoring.
Among all toxicities patients experience, some are so severe that to escalate the dose
level. When the side effects developed are severe enough during the study, investigators should
prevent for further dose escalation; and these toxicities are called dose limiting toxicity (DLT).
National Cancer Institute (NCI, 2010) published their fourth version of Common Toxicity
Criteria; DLT is defined as a group of grade 3 or higher non-hematologic toxicities and grade 4
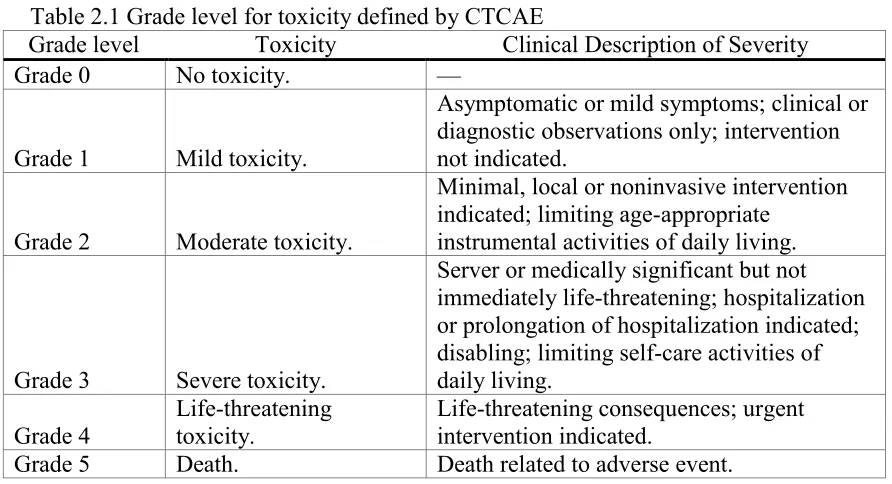
hematologic non-transient toxicities. Table 2.1 lists the grade levels of all toxicities classified
based on clinical descriptions of severity.
Designs for phase I cancer clinical trials have changed little in past decades. As
efficacy. Therefore, in practical clinical studies dose-related toxicity is considered to be a
[image:33.612.84.530.126.368.2]surrogate for measurement of efficacy. Hence, the logic becomes
Table 2.1 Grade level for toxicity defined by CTCAE
Grade level Toxicity Clinical Description of Severity Grade 0 No toxicity. —
Grade 1 Mild toxicity.
Asymptomatic or mild symptoms; clinical or diagnostic observations only; intervention not indicated.
Grade 2 Moderate toxicity.
Minimal, local or noninvasive intervention indicated; limiting age-appropriate
instrumental activities of daily living.
Grade 3 Severe toxicity.
Server or medically significant but not immediately life-threatening; hospitalization or prolongation of hospitalization indicated; disabling; limiting self-care activities of daily living.
Grade 4
Life-threatening toxicity.
Life-threatening consequences; urgent intervention indicated.
Grade 5 Death. Death related to adverse event.
the highest safe dose represents the most efficacious treatment effect. To estimate the maximum
tolerated dose (MTD) of a new drug, a specific tolerable toxicity level needed to predefine. The
highest acceptable DLT level is usually defined as a target toxicity level (TTL) (Parulekar, et al.,
2004). The choice of the TTL is based on the preliminary knowledge of the new drug or
treatment under investigation. If a new drug tends to have more server toxicity, then TTL
selection should be more conservative. In other word, the choice of TTL determines the MTD of
the new drug. Therefore, a careful and thoughtful approach to design phase I clinical trials and
determine more accurate MTD is critical for the fate of the new drug in subsequent trials (Chen,
et al., 2012).
For a cancer phase I trial, the guiding principle for dose escalation is to treat as many
patients as possible at the therapeutic dose level to avoid unnecessary exposure of patients at the
scheme, we use the assumption that the probability of toxicity increases monotonically with
increasing drug dose to establish the dose-toxicity relationship. Here in Table 2.2 we listed
definitions of basic concepts used in phase I trials models from Tourneau et al., (Tourneau, et al.,
[image:34.612.73.548.178.718.2]2009), which will help us better understand the terminologies used later in this dissertation.
Table 2.2 Terms in common phase I clinical trial designs
Term Definition
Cohort Group of patients treated at a dose level.
Starting dose The dose chosen to treat the first cohort of patients in a phase I trial. Does increment
(decrement)
The percent increase (or decrease) between dose levels.
Dose-limiting toxicity (DLT)
Toxic effects that are presumably related to the drug that are considered unacceptable (because of their severity and/or irreversibility) and that limit further dose escalation. DLTs are defined before beginning the trial and are protocol specific. They are typically defined based on toxic effects seen in the first cycle and specified using a standardized grading criteria, for example, CTCAE.
Dose-toxicity curve
The dose-toxicity curve reflects the relationship between dose and probability of toxicity for an anticancer agent. A logistic function is commonly assumed to describe the dose-toxicity curve for cytotoxic agents and is characterized by a parameter, , which represents the slope of the dose-toxicity curve. Small values of indicate that the probability of toxicity increase very slowly with increasing dose levels, whereas large values of indicate a sharp increase in toxicity with increasing dose levels.
Target toxicity level
The maximum probability of DLT that is considered acceptable in the trial. The TTL in phase I trials is typically between 20% and 33%. Maximum
tolerated dose (MTD)
Phase I trials conducted in the US: the highest dose level at which 33% of patients experience DLT. Phase I trials that use model-based methods: the dose that produces the target toxicity level (TTL). Optimal biological
dose (OBD)
Dose associated with a prespecified most desirable effect on a biomarker among all doses studied.
Recommended phase II dose
Phase I trials with a toxicity endpoint MTD.
Pharmacokinetics Pharmacologic effects of the body on the drug, such as the time course of drug absorption, distribution, metabolism, and excretion.
Pharmacodynamics Pharmacologic effects of the drug on the body, such as nadir neutrophil or platelet count, non-hematologic toxicity, molecular correlates, imaging endpoints.
Although it is popular to use an increasing relationship to describe the probability of
toxicity, sometimes a decrease in the probability of toxicity at high dose levels could happen in
some special cases. Since this type of cases is rare in practice, we will only focus on the common
scenario in this dissertation. Dose escalation approaches for phase I cancer clinical trials can be
divided in to broad classes: one uses nonparametric manner and is called rule-based design,
including the traditional 3+3 design and its variations (Storer, 1989); the other is in the
parametric way and called model-based design including CRM, EWOC, and their extensions.
When the nonparametric design is adopted, the only assumption used to describe the
dose-toxicity relationship is that dose-toxicity is non-decreasing with dose. The rule-based designs assign
patients to dose levels according to pre-specified rules based on actual observations of target
events from the clinical data.
Sometimes the MTD or recommended dose for the subsequent phase II trial is also
determined by the predefined rules. In contrary, the parametric method uses a model that adapts
a distribution with some parameters to formulate the toxicity-dose curve. We can explain the
mechanism of a dose-toxicity response biologically, that is the human body has stabilization and
self-salvage systems to defend toxic invasion. The body will protect the person him/herself from
mild toxicity when a drug dose is at a low level below a certain threshold level, but the
probability of toxicity increases at an accelerated speed once the stabilization and self-salvage
systems have been overcome, and reaches rapidly the worst condition, death, and then levels off.
Therefore a sigmoid-shaped distribution is an appropriate model to describe the relationship
between toxicity probability and dose. Many statistical designs have been proposed base on
above considerations for phase I clinical trials; the most commonly used are summarized and
Table 2.3 Commonly used rule-based designs and model-based designs
Design class Design Advantages Disadvantages Rule-based designs Standard 3+3 design Robust. Simple.
Easy to implement and safe.
Many patients treated at lower subtherapeutic doses. Slow dose escalation. MTD is not a dose with any particular probability of DLT, but in the range from 20% to 25% DLT. Cannot estimate MTD with target probability of DLT < 20% OR 33%.
Not all toxicity data of all patients are used to determine the MTD. Isotonic
design (ID) Only assumes a monotonically increasing relationship between dose and toxicity.
Semiparametric.
Can estimate MTD with different TTL (0-100%). Robust and easy to implement.
Good for combination of multiple drugs and treatments.
The accuracy of MTD may not be as good as CRM or EWOC.
The trial efficiency may not be as good as CRM or EWOC.
Model-based
designs Continual reassessment method (CRM)
Fit parametric model for dose-toxicity relationship.
Adaptive optimal design. Accurate estimation of MTD. Improved trial efficiency. Allow flexible MTD with different TTL.
High risk of patients being treated with over toxic dosages.
If the parametric model is not reliable, the result could be questionable. May fail to find MTD. Escalation
with overdose control
(EWOC)
Includes all advantages of CRM.
Controls the probability of overdosing a patient to toxic doses.
Further improves MTD accuracy and trial efficiency.
If the parametric model is not reliable, the result could be questionable. May fail to find MTD.
2.2.1 Rule Based Designs
All the rule-based designs are considered to follow a sequential approach. It is very
which is the only assumption for a rule-based design. Although considerable new designs have
been proposed by researchers in the past 20 years, rule-based designs are still playing a very
important part (more than half of the clinical studies conducted) in cancer clinical study because
of its feature — easy to implement. The most frequently used designs is standard 3+3 design
(traditional 3+3 design) (Korn, et al., 1994), and isotonic design (ID) which was proposed
(Leung, et al., 2001) to adjust the toxicity estimates using isotonic regression. Other popularly
used rule-based designs include: standard A+B design, up-and-down design (Storer, 1989), and
accelerated titration design (Simon, et al., 1997), and so on. In this section, we will review some
of the commonly utilized rule-based designs.
The standard 3+3 design is used in phase I protocol templates of the cancer therapy
evaluation program (CTEP), which primary goal is to improve the quality of lives of cancer
patients by sponsoring clinical trials that investigate new anticancer drug or treatment with a
particular emphasis on translational research to elucidate molecular targets and mechanisms of
drug effects (Chen, et al., 2012). The standard 3+3 design can be described as follow. Assume a
predefined dose range with ordinal dose levels and the corresponding probabilities
of toxicity are r(toxicity) . The design is named 3+3 indicates the
cohort size in the clinical trial is 3. The first cohort of 3 patients begins the trial at the starting
lowest dose. Then simple version of dose escalation (without de-escalation) follows the scheme
in Figure 2-1 with the following descriptions: for the dose level,
1. Evaluate all 3 patients at , when 0 out of 3 patients experience toxic event, then
escalate to . Otherwise, if no more than 1 patients experience toxic events, then
go to step 2, if more than 1 patients experience toxic event, then terminate the trial,
Figure 2-1 3+3 dose escalation scheme (Chen et al., 2012)
2. Evaluate an additional 3 patients at , if no more than 1 toxic events are seen in total,
then escalate; otherwise terminate the trial and recommend as the MTD.
Although 3+3 design has been used as the protocol template in cancer phase I clinical
trials, the MTD is not a dose with any particular probability of DLT. They are designed to screen
drugs quickly and identify a dose level that does not exhibit too much toxicity in a very small
group of patients. There are two types of 3+3 designs, the one we described above is 3+3 design
without de-escalation, and there is another version with de-escalation that allows three new
patients to be treated at a previous dose level. We will not discuss it here in this dissertation.
The isotonic design improves the standard designs in two ways. When summarizing
toxicity risk at a dose, the method uses information at other doses in contrary to a standard
the dose-toxicity relationship. The design scheme adjusts 3+3 design is described by Leung et
al., as follow (Leung, et al., 2001), for dose level ,
1. Treat a cohort of 3 patients at .
2. Evaluate toxicity at different doses, and choose the dose at which ̂ is closest to the
tolerable toxicity 0.33, where is the dose last used. When ̂ 0. , then the dose
escalates if smaller difference detected with next dose level with ̂ than
with ̂. That is 0. ̂ ̂ 0. , otherwise continue at the same dose level.
When ̂ 0. , then de-escalate the dose if 0. ̂ ̂ 0. , otherwise
continue at the same dose.
Many researchers have applied the isotonic designs to their clinical studies (Stylianou, et
al., 2002) (Yuan, et al., 2004), the pool-adjacent-violators algorithm (PAVA) and isotonic
regression are used in the method to update the probability of DLT of each dose level after
obtaining the information that patients experience the toxic events. Because of its feature of
model-free, it is suitable to cases where the parametric dose-toxicity relationship is not well
understood (Chen, et al., 2012). However, simulation studies shows that using one-parameter
model of isotonic design tends to overestimate the dose, and a very careful and thoughtful choice
on the parameter should be made based on Markov chain theory to ensure more frequent
assignments to the MTD and nearby doses (Ivanova, et al., 2009).
Rule-based designs, in practice, are still popular although many model-based designs
have been proposed to cancer phase I trials. The simplicity of operating process is the reason to
adopt these designs. There are many other rule-based designs have not been mentioned in this
dissertation. All these rule-based designs can be used to determine a reasonable MTD using a
levels can also be added when needed without any impact on their robustness. Rule-based
designs thus are well suited for first in human clinical trials in which the dose-toxicity
relationship is not well understood (Chen, et al., 2012).
2.2.2 Model Based Designs
In this section, we will provide an introduction to phase I model-based designs and a
specific example will give to CRM (O'Quigley, et al., 1990) because in the later chapter 3, we
will propose our hybrid design based on EWOC and provide a detailed description of it. As
mentioned above, the body will defend the toxicity when initiating a drug dose then there is a
steep increase in the probability of toxicity once the stabilization and self-salvage systems have
been overcome. Thus a sigmoid-shape distribution is a very practical choice to build the
dose-toxicity relationship. Among the model-based designs, three parametric dose-dose-toxicity functions
(logistic model, hyperbolic model, and power function) are frequently used to describe the
relationship between dose and toxicity (Kang, et al., 2001).
A model-based design is a statistical model used to determine a dose level which could
produce a prespecified probability of dose-limiting toxicity by using all enrolled patients in
computing a more accurate dose-toxicity cure. The design is an alternative choice for the dose
escalation method in cancer phase I trials. Recently, many multi-stage model-based designs have
been proposed, for example two-stage design to optimize cancer phase I trials (Zandvliet, et al.,
2010). But CRM (O'Quigley, et al., 1990) and EWOC (Babb, et al., 1998) are the ones that used
most frequently. These two designs both use Bayesian approach to fully and efficiently utilize all
available data and prior information in the phase I study. To use the CRM design, initial estimate
of — TTL is required to set up before the clinical study. This will need inputs from experts
the estimate may not be very accurate, but it provides a guidance for the dose escalation
(Tourneau, et al., 2009).
We can describe the CRM design scheme as follows:
1. Establish a dose-toxicity model ( ), where the predefined dose is levels; is a
model parameter, and a prior distribution for parameter (exponential distribution is
often used) is assumed. Then define the target probability of (usually 20-33%).
2. At the dose level , using the indicator denotes the toxic event, and the posterior
distribution of is updated by Bayesian rule shown as follows:
( ) ( ) ∏ [ ( )] [ ( )]
∫ ( )∏ [ ( )] [ ( )]
However, there is a controversial issue has been discussed in the CRM design. The CRM
has a higher probability to overdose a patient comparing with the standard designs (Ratain, et al.,
1993). Therefore, modified versions of CRM were proposed to avoid the overdosing problem.
EWOC is the design that also can be considered as a translation from CRM. The advantage of
this design is that it prevents patients from overdosing by controlling the probability of toxicity
at a feasible bound. We will use the EWOC as a base model to implement our idea for the cancer
phase I trial.
2.3Statistical Methodology of Phase II Clinical Trials
There are large numbers of new cancer therapies emerge over recent years, but only a
small number of the new drugs or treatments can be approved for market. Comparing with 20%
success rate in cardiovascular new drug development, cancer drug attrition rates are significantly
higher, only 5 out of 100 anticancer drugs under development would be approved (DiMasi, et al.,
drug development process, aiming to identify ways of reducing the failure rate. In reviewing the
whole process, researchers found phase II trials act as screening tools before entering the most
costly phase III trials (Brown, et al., 2011). Therefore, it is crucial for researchers to design the
trail to give more accurate predict for the subsequent phase III trials. A phase II clinical trial is
conducted to assess the new drug or treatment therapeutic effects using MTD recommended
from proceeding phase I trial (Seymour, et al., 2010). The result provides critical information to
determine whether conducting the large confirmatory phase III trials or not.
There are two types of phase II trials grouped by design method: single-arm designs and
randomized designs; both can be easily understood from the names of category (Seymour, et al.,
2010). In this chapter, we will review these two types of designs and construct a comparison of
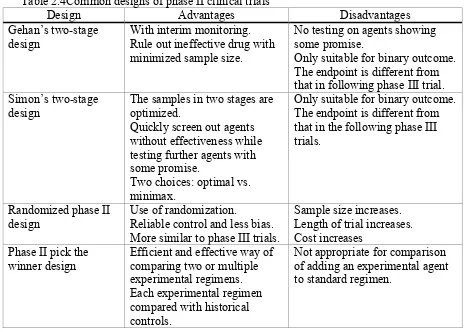
popularly used phase II designs which is described in Table 2.4 adopted from Chen et al., (Chen,
et al., 2012). On the other hand, there is another way to specify a phase II trial by its ultimate
aim, although the classification method is not quite popular. Divided by goals of the designs,
phase II trials can be grouped as phase IIa (concept screening) and phase IIb studies
(decision-making). Phase IIa trials aim to screen out the promising novel experimental agent with
significant antitumor activity and phase IIb trials are conducted for seeking sufficient robustness
to support progression to phase III studies.
The essential topic for designing a phase II trial is how to choose the most appropriate
primary endpoint. Usually, response rate is chosen as the primary endpoint in a phase II trial. It
was considered appropriate when unambiguous and clinically relevant antitumor activity is
hypothesized. But recently, more and more surrogate endpoints have been proposed to evaluate
the clinical benefit and treatment effects. Progression-free survival (PFS) of treated patients is
Table 2.4Common designs of phase II clinical trials
Design Advantages Disadvantages Gehan’s two-stage
design
With interim monitoring. Rule out ineffective drug with minimized sample size.
No testing on agents showing some promise.
Only suitable for binary outcome. The endpoint is different from that in following phase III trial. Simon’s two-stage
design
The samples in two stages are optimized.
Quickly screen out agents without effectiveness while testing further agents with some promise.
Two choices: optimal vs. minimax.
Only suitable for binary outcome. The endpoint is different from that in the following phase III trials.
Randomized phase II design
Use of randomization.
Reliable control and less bias. More similar to phase III trials.
Sample size increases. Length of trial increases. Cost increases
Phase II pick the
winner design Efficient and effective way of comparing two or multiple experimental regimens. Each experimental regimen compared with historical controls.
Not appropriate for comparison of adding an experimental agent to standard regimen.
2.3.1 Standard Single-Arm Designs
The standard single-arm designs are most commonly used in phase II clinical trials.
Single-arm is utilized to compare the new drug or treatment with the standard response rate
reported by historical data. As we mentioned before, the null hypothesis of such a design tests of
insufficient efficacy while the alternative hypothesis test whether the new drug or treatment has
sufficient activity to warrant further investigation. The type I error thus defines the chance that
an ineffective agent will be studied further, and the type II error specifies the chance that an
effective agent will not be studied further, which is usually regarded as the more serious error in
phase II testing. In a study of mono-therapy, an agent might be considered uninteresting if the
true response rate is 5% and interesting if the response rate is at least 20%; this criterion varies
A single-arm phase II trial design can have two or more stages, with the purpose to
improve the trial efficiency and save resources by the early termination decision. Gehan first
proposed a two-stage phase II design allowing early termination when no patients enrolled in
stage I show any objective response. Otherwise, the trial continues to stage II which provides a
more accurate response rate with additionally recruited patients (Gehan, 1960). However, there is
no statistical testing on agents in Gehan’s two-stage design and is not optimized. Simon (Simon,
1989) thus proposed an optimized two stage phase II design that controls both type I and type II
errors as well as optimizes the sample sizes in both stages. The benchmark mentioned in
previous paragraph is often tested with Simon’s two-stage design. This design can quickly filter
out ineffective drugs or treatments while further test more promising ones. The design has two
subtypes, optimal and minimax. The optimal subtype minimizes the expected overall sample size
with the probability to stop the trial after the first stage. It is appropriate to model experimental
drugs efficacy which ones with a high probability to fail after the first stage (Chen, et al., 2012).
Researches interests have been attracted to how to determine appropriate endpoint and
levels of activity for single-arm studies. PFS has been used as a surrogate endpoint in some
recent phase II trials because of its advantages of short follow-up time and best estimate for
overall survival (OS). Another commonly used surrogate endpoint is the continuous tumor
change percentage. Traditionally, the categorical variable — tumor response is the most common
endpoint in the phase II clinical trial designs. However, from a statistical point of view,
categorizing a continuous tumor change percentage into a categorical tumor response with 4
levels results in a loss of statistical power by not fully utilizing all available data. We will focus
problems, also compare the performance of our design with the standard protocol of most cancer
phase II trials — Simon’s two-stage design.
2.3.2 Randomized Phase II Design
There are several types of randomized phase II designs, include randomized control
phase II design, randomized selection phase II design, and randomized discontinuation design,
and so on. A randomize-controlled phase II study design typically compares an experimental
regimen to a control arm (with or without a placebo) (Korn, et al., 2001). Comparison to a
control arm is very useful when there is little prior information on expected efficacy rates in a
population; and also when endpoints that are heavily influenced by patient selection, for example
when PFS is used as an endpoint (Simon, et al., 2001). The endpoint could be a standard measure
of tumor status, such as response rate or PFS which allows the study to be completed with fewer
patients than required in a phase III study of survival. Type I and type II error rates are different
as in other phase II designs. And the type I error can generally be larger than the one used in
phase III studies; Korn et al. (Korn, et al., 2001) suggests considering one-sided type I error rates
as large as 20%. The magnitude of the difference between the null and alternative hypotheses
may also be larger than an appropriate value for a phase III study.
A randomized phase II selection design allows multiple single-arm studies to be
conducted in the same time frame and with the same entry criterion (Lee, et al., 2005). The
advantages of a randomized study over separate studies include decreasing the effects of patient
selection bias, population drift and stage migration, and the ability to ensure that uniform
evaluation criteria are used (Simon, et al., 1985). Although these studies are often designed to
evaluate each arm separately and there is generally not adequate power for formal testing to