Copyright © 1998, American Society for Microbiology
Comparison of Three Methods for Testing
Azole Susceptibilities of Candida albicans
Strains Isolated Sequentially from Oral
Cavities of AIDS Patients
ANNA MARIA TORTORANO,
1MARIA ANNA VIVIANI,
1* FRANCESCO BARCHIESI,
2DANIELA ARZENI,
2ANNA LISA RIGONI,
1MASSIMO COGLIATI,
1PATRIZIA COMPAGNUCCI,
2ANDGIORGIO SCALISE
2Istituto di Igiene e Medicina Preventiva, Universita` degli Studi di Milano—IRCCS Ospedale
Maggiore di Milano, Milan,
1and Istituto di Malattie Infettive e Medicina Pubblica,
Universita` degli Studi di Ancona, Ancona,
2Italy
Received 4 August 1997/Returned for modification 13 September 1997/Accepted 19 February 1998
Three susceptibility testing procedures were compared to determine fluconazole, itraconazole, and
ketocon-azole MICs against 47 Candida albicans strains isolated sequentially from the oral cavities of five AIDS patients
undergoing azole therapy. They included the broth microdilution method (BM), performed according to the
National Committee for Clinical Laboratory Standards’ tentative standard, the agar dilution method (AD),
and the Etest; the latter two tests were performed both in Casitone agar (AD-Cas and Etest-Cas) and in RPMI
(AD-RPMI and Etest-RPMI). Twenty-four- and 48-h MICs obtained by AD and Etest were compared with 48-h
MICs obtained by BM. The MICs of all the azoles determined by BM were usually lower than those obtained
by the other methods, mainly due to different reading criteria. In order to assess the most appropriate way of
evaluating the agreement of MICs obtained by different methods with those produced by the proposed
reference method (BM), we used the mean differences calculated according to Bland and Altman’s method.
Comparison of fluconazole MICs obtained by BM and AD-Cas yielded a mean difference of 3, and the
percentages of agreement within
6
2 dilutions were 98 and 100% at 24 and 48 h, respectively. For ketoconazole
and itraconazole MICs, lower mean differences were noted, and agreement ranged from 96 to 100%. Agreement
between the AD-RPMI and BM results was poor for all azoles, and an increase in MICs was always observed
between the 1st- and 2nd-day readings. Similarly, Cas gave better agreement with BM than did
Etest-RPMI for all the azoles. BM, AD-Cas, and Etest-Cas each demonstrated a progressive increase in fluconazole
MICs against strains isolated sequentially from a given patient, in accordance with the decreased clinical
response to fluconazole.
The rising incidence of fungal infections and the increasingly
frequent use of antifungal agents have intensified the need for
useful and reliable antifungal susceptibility test methods.
Sus-ceptibility testing of antifungal agents is greatly influenced by a
variety of factors (5, 6, 10, 16, 18, 25, 26). After several
collab-orative studies, the Subcommittee on Antifungal Susceptibility
Tests of the National Committee for Clinical Laboratory
Stan-dards (NCCLS) published a reference method for broth
dilu-tion antifungal susceptibility testing of yeasts which includes
the less-expensive and less-cumbersome broth microdilution
method (BM) (13). Another widely used antifungal
suscepti-bility testing procedure is the agar dilution method (AD),
which is easy to perform and allows simultaneous testing of a
large number of organisms and the easy detection of microbial
contaminants (6, 18, 28). Recently, several commercially
avail-able tests, such as Etest, have been introduced as alternative
methods (4, 7, 14, 15, 22–24). Different media have been used
with both AD and Etest (6, 9, 26).
In the last few years, the application of in vitro antifungal
susceptibility tests for strains of Candida albicans causing
thrush or esophagitis in AIDS patients showed higher MICs
for isolates from patients refractory to azole treatment (8, 19).
A progression from low to high MICs during the course of the
infection was reported for C. albicans strains isolated
sequen-tially from the oral cavities of patients with AIDS receiving
azole therapy (2, 11, 12, 17, 20). Therefore, in vitro procedures
could be helpful in monitoring antifungal therapy in this
pop-ulation of patients.
In the study described here, we compared three different
methods and two media (RPMI 1640 and Casitone) for testing
fluconazole, itraconazole, and ketoconazole against 47 strains
of C. albicans isolated sequentially from the oral cavities of five
AIDS patients undergoing azole treatment in order to verify
the validity of AD and Etest.
(This work was presented as a poster at the Congress of the
International Society for Human and Animal Mycology,
Sal-somaggiore Terme, Italy, 8 to 13 June 1997.)
MATERIALS AND METHODS
Sources of isolates.Forty-seven strains of C. albicans isolated from the oral
cavities of five AIDS patients who had recurrent episodes of oropharyngeal candidosis were used. All the patients were being treated with azoles. Yeasts were identified at species level by standard morphological and biochemical methods (27) and were stocked at270°C in 10% glycerin until used. Candida
krusei ATCC 6258 and Candida kefyr IP 706 were employed as quality control
strains and tested in each run of the experiments for the three antifungal agents.
* Corresponding author. Mailing address: Istituto di Igiene e
Medi-cina Preventiva, Universita` degli Studi di Milano, via F. Sforza 35,
20122 Milan, Italy. Phone: 39 2 55188373. Fax: 39 2 55191561. E-mail:
viviani@imiucca.csi.unimi.it.
1578
on May 15, 2020 by guest
http://jcm.asm.org/
Susceptibility testing procedures.The antifungal agents used in this study were an intravenous fluconazole preparation (Diflucan i.v.; Roerig Farmaceutici Italiani, Latina, Italy) and itraconazole and ketoconazole powders (kindly given by Janssen Pharmaceutica, Beerse, Belgium). Preliminary experiments showed no difference between the results obtained with the commercial preparation of fluconazole and those obtained with pure fluconazole (Pfizer Inc., New York, N.Y.). Azole susceptibility testing of all isolates of C. albicans were performed by three different methods: BM, AD, and Etest.
(i) BM.BM was performed according to the NCCLS M27-T guidelines (13).
Briefly, we used RPMI 1640 medium (Sigma Chemical Co., St. Louis, Mo.) buffered to pH 7.0 with 0.165 M morpholinepropanesulfonic acid (MOPS; Sigma Chemical Co.). Fluconazole was diluted to obtain final drug concentrations ranging from 0.125 to 64mg/ml. Itraconazole and ketoconazole powders were dissolved in polyethylene glycol 400 (Janssen Chemicals, Beerse, Belgium) and diluted to obtain final drug concentrations ranging from 0.03 to 8.0mg/ml for both drugs. Fifty microliters of the inoculum prepared spectrophotometrically as described elsewhere (13) was added to each well of the microtiter plates (final inoculum, 0.53103to 2.53103CFU/ml). Plates were incubated at 35°C for 48 h. The MIC was defined as the lowest concentration at which a prominent decrease in turbidity was observed (13).
(ii) AD.AD was performed both in RPMI 1640 buffered to pH 7.0 with MOPS
(AD-RPMI) and in phosphate-buffered Casitone agar, pH 7 (AD-Cas) (Casitone [Difco Laboratories, Detroit, Mich.], 9 g; yeast extract [Difco], 5 g; glucose, 20 g; sodium citrate, 10 g; Bacto Agar [Difco], 18 g; phosphate buffer [pH 7], 1 liter). Fluconazole was diluted in distilled water. Itraconazole and ketoconazole pow-ders (10 mg of each) were dissolved in 1 ml of solvent (1 N HCl and ethyl alcohol in a 2:8 ratio) and then diluted with the same solvent mixture to 80mg/ml. The drug solution was further diluted in distilled water. Twofold dilutions of each
drug were added to RPMI and Casitone agar to obtain final concentrations ranging from 0.06 to 64mg of fluconazole/ml and from 0.008 to 8mg of itracon-azole or ketoconitracon-azole/ml. Plates containing different antifungal dilutions and those containing diluents were inoculated by using a multipoint inoculator. Each pin delivered 1ml of a yeast suspension containing 53105cells/ml from a 24-h culture. The inoculum size was determined by the count in Burker’s chamber. MICs were recorded as the lowest concentrations of drug that suppressed visible growth after 24 and 48 h of incubation at 35°C. All tests were performed in duplicate.
(iii) Etest.Etest was performed in Casitone (Etest-Cas) and RPMI agar
(Etest-RPMI). Petri plates (150 mm in diameter) containing 60 ml of medium were flooded with a yeast suspension of 5 3105cells/ml. Excess fluid was removed with a pipette, and after moisture was allowed to be absorbed, Etest strips were applied on each medium. The plates were incubated at 35°C and were read according to the manufacturer’s instructions at 24 and 48 h.
Analysis of the results.All the AD and Etest MICs at 24 and 48 h were
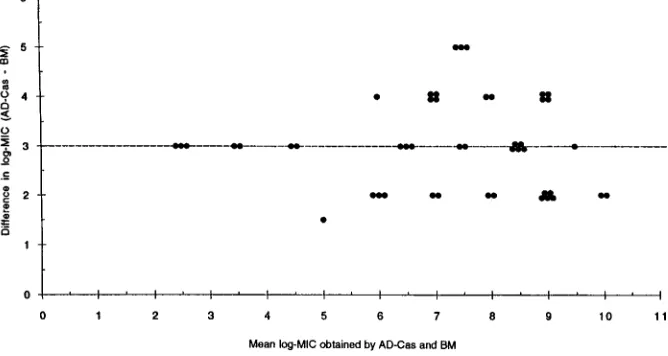
[image:2.612.49.555.82.249.2]compared with the BM MICs at 48 h. Both on-scale and off-scale results were included in the analysis. MIC results obtained with the different procedures were compared according to the measuring agreement method reported by Bland and Altman (3). Every MIC was logarithmically transformed and deviated to avoid negative values (log-MIC) (e.g., 1,#0.12mg/ml; 2, 0.25mg/ml; 11,$128mg/ml). The difference (d) between the log-MIC obtained by AD or Etest and that obtained by BM for each isolate was calculated, and the mean of these differ-ences (mean difference, or d) was determined. Results for MIC pairs obtained with different methodologies were considered in agreement when the difference between d and d was within 1 (agreement61 dilution) or 2 (agreement62 dilutions) dilutions. The Mann-Whitney U test was applied to ascertain the
[image:2.612.132.466.537.715.2]FIG. 1. Difference from mean for fluconazole log-MIC (reading at 48 h). The horizontal line indicates d.
TABLE 1. Fluconazole, itraconazole, and ketoconazole MICs for 47 clinical isolates of C. albicans obtained by three methods
Method reading (h)Time of
MIC (mg/ml) ofa:
Fluconazole Itraconazole Ketoconazole
Range 50% 90% Range 50% 90% Range 50% 90%
BM
48
0.125–32
4.0
16
0.03–0.5
0.125
0.25
0.03–0.5
0.06
0.25
AD-Cas
24
1.0–
.
64
32
.
64
0.03–2.0
0.125
0.25
0.03–0.5
0.125
0.25
48
1.0–
.
64
32
.
64
0.03–2.0
0.125
2.0
0.03–0.5
0.125
0.5
AD-RPMI
24
0.25–
.
64
16
.
64
0.03–
.
8.0
0.125
.
8.0
0.03–8.0
0.125
0.25
48
8.0–
.
64
.
64
.
64
0.125–
.
8.0
.
8.0
.
8.0
0.03–
.
8.0
8.0
.
8.0
Etest-Cas
24
0.5–
.
256
32
128
0.03–12
1.0
4.0
0.008–0.5
0.125
0.25
48
1.0–
.
256
64
128
0.06–12
2.0
8.0
0.008–0.75
0.25
0.5
Etest-RPMI
24
0.125–
.
256
16
.
256
0.08–
.
16
1.0
.
16
0.008–
.
32
0.25
0.5
48
8.0–
.
256
128
.
256
0.08–
.
16
2.0
.
16
0.008–
.
32
0.5
.
32
a50% and 90%, MICs at which 50 and 90% of the isolates are inhibited, respectively.
on May 15, 2020 by guest
http://jcm.asm.org/
distribution of itraconazole and ketoconazole MICs for fluconazole-susceptible and -resistant isolates. A P value of,0.05 was considered statistically significant.
RESULTS
[image:3.612.53.296.70.496.2]A total of 1,269 MIC data points were available for analysis.
Table 1 summarizes azole MICs obtained by the three
meth-ods. Generally, MICs obtained by BM were lower than those
obtained by the other methods for all three azole drugs.
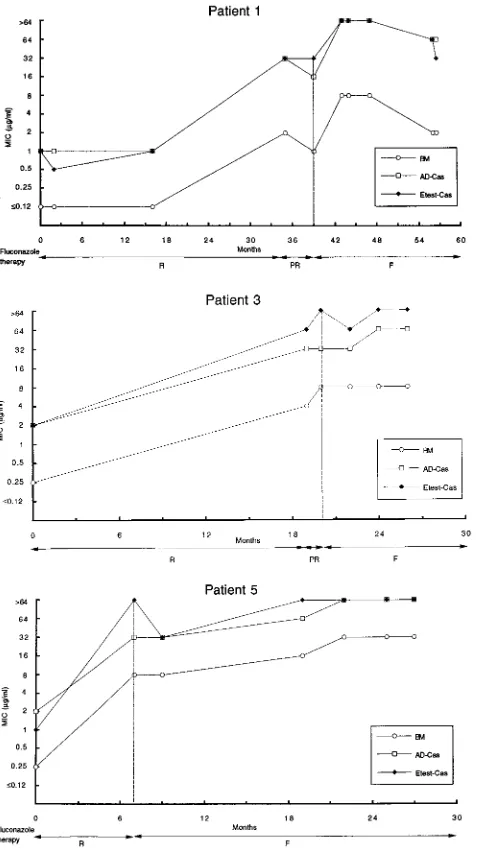
Fluconazole MICs generated in AD-CAs were always 3
[image:3.612.308.545.74.354.2]di-FIG. 2. Trends of fluconazole MICs for C. albicans strains isolated sequen-tially from five AIDS patients undergoing azole therapy (readings at 48 h). Outcomes of fluconazole therapy are abbreviated as follows: R, response to 100 to 200 mg/day; PR, partial response to 200 mg/day; F, failure to respond to 200 to 400 mg/day. Vertical lines indicate the start of failure of fluconazole therapy.
TABLE 2. Agreement of MICs obtained by AD and by Etest with MICs obtained by NCCLS BM
Method reading (h)Time of
Fluconazole MICs Itraconazole MICs Ketoconazole MICs
d % Agreement
a
d % Agreement
a
d % Agreement
a
61 Dil 62 Dil 61 Dil 62 Dil 61 Dil 62 Dil
AD-Cas
24
2.6
72
98
0.32
79
98
0.16
98
100
48
3.0
91
100
0.79
74
96
0.57
83
100
AD-RPMI
24
2.5
49
83
2.1
23
70
0.07
75
84
48
4.8
45
64
5.8
34
57
4.8
23
25
Etest-Cas
24
4.0
62
91
3.5
49
85
0.27
98
98
48
3.5
64
94
3.6
51
87
0.5
96
100
Etest-RPMI
24
2.5
26
81
3.9
43
60
2.6
26
51
48
5.0
45
64
4.5
23
43
4.3
6
20
a% of agreement within 1 or 2 dilutions (Dil) referred to d.
on May 15, 2020 by guest
http://jcm.asm.org/
[image:3.612.50.549.567.717.2]lutions higher than those obtained with BM. When d measured
by Bland and Altman’s method was considered, the
percent-ages of agreement within 2 dilutions were 98 and 100% at 24
and 48 h, respectively (Table 2; Fig. 1). d between BM and
AD-Cas was lower (,1.0) for both itraconazole and
ketocon-azole MICs than for fluconketocon-azole MICs. The percentages of
agreement within 2 dilutions were 98 and 96% for itraconazole
at 24 and 48 h, respectively, and 100% for ketoconazole at both
24 and 48 h (Table 2). AD-RPMI yielded poorer agreement
with BM than did AD-Cas for all azoles (Table 2). In this
medium an increase of MICs was always observed between the
1st- and the 2nd-day readings for all azoles (Table 1).
Similarly, Etest-Cas gave better agreement with BM than
did Etest-RPMI for all azoles (Table 2). In general,
interpre-tation of MICs by Etest was more difficult in RPMI than in
Casitone due to the marked trailing observed in the former
medium with most of the strains tested. The same
phenome-non was also observed when selected isolates were tested on
RPMI containing 2% glucose.
Overall, AD-Cas showed higher agreement with BM than
did Cas for all azoles (Table 2). BM, AD-Cas, and
Etest-Cas each demonstrated a progressive increase in fluconazole
MICs against strains isolated sequentially from a given patient,
in accordance with the decreased clinical response to
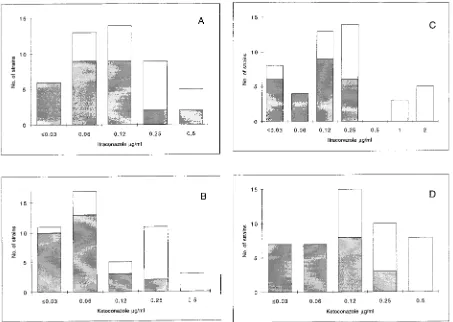
flucon-azole (Fig. 2). In order to detect possible cross-resistance
among azoles, we further analyzed the distributions of
itracon-azole and ketoconitracon-azole MICs for fluconitracon-azole-susceptible and
-resistant isolates of C. albicans. Because of the d of 3 dilutions
between fluconazole MICs obtained by BM and by AD-Cas,
we arbitrarily chose fluconazole breakpoints of 4 and 32
mg/ml
to define isolates susceptible to fluconazole by BM and by
AD-Cas, respectively. When the Mann-Whitney U test was
used to determine the distribution of itraconazole and
keto-conazole MICs for the two groups of isolates, a statistically
significant difference was found with both the methods
em-ployed (P
5
0.0001) (Fig. 3). A decrease in susceptibility to
itraconazole and ketoconazole was observed in strains that
developed resistance to fluconazole.
DISCUSSION
[image:4.612.74.527.70.392.2]Antifungal susceptibility tests, like those for antibacterial
agents, may be an important aid in the decisions on starting
antifungal treatment and in monitoring the outcome. So far,
the use of these particular tests to monitor antifungal therapy
has been limited by the lack of reproducibility and uncertain
clinical relevance (5, 10). Following the increasing prevalence
of fungal infections, new antifungal agents have been
intro-duced and yeast isolates with reintro-duced susceptibility to
antifun-gal agents have been recognized (2, 8, 11, 12, 19, 20). Lately,
the long-term use of azoles in the prophylaxis of systemic
FIG. 3. Distribution of itraconazole and ketoconazole MICs for 47 strains of C. albicans obtained by BM (A and B) and AD-Cas (C and D). Shaded bars represent the distributions of itraconazole and ketoconazole MICs for fluconazole-susceptible isolates (fluconazole MICs,#4.0 and#32mg/ml by BM and AD-Cas, respectively); open bars represent the distributions of itraconazole and ketoconazole MICs for fluconazole-resistant isolates (fluconazole MICs,$8.0 and$64mg/ml by BM and AD-Cas, respectively). When the Mann-Whitney U test was applied to determine the distribution of itraconazole and ketoconazole MICs for the two groups of isolates, a statistically significant difference was found with both the methods employed (P50.0001).
on May 15, 2020 by guest
http://jcm.asm.org/
mycoses for bone marrow transplant patients and in
suppres-sive therapy for AIDS patients has resulted in the selection of
isolates that are more resistant to azole therapy (8, 11, 12, 19,
20).
Both BM and AD have been widely employed in clinical
laboratories. Little information is available on the correlation
between these two procedures. Since the NCCLS suggests
per-forming the broth procedure in RPMI 1640 buffered with
MOPS, we compared the azole MICs obtained by the
pro-posed standard method with those obtained by agar dilution in
the same medium and in Casitone medium buffered with
phos-phate.
Generally, AD MICs were higher than BM MICs. This could
be explained by the different reading criteria considered in the
definition of the endpoints. The different methods of reading
will produce a consistent bias resulting in very poor agreement
if the percentage of agreement is calculated, as usual, on the
basis of discrepancies between MIC endpoints of no more than
2 dilutions. In order to assess the most appropriate way of
evaluating agreement of MICs obtained by different
method-ologies, such as AD and BM, data analysis was performed
according to Bland and Altman’s method (3). By this
method of analysis, based on the notion that the mean of
two measurements is the best estimate, since the “true”
value is not known, it is possible to remove the consistent
bias estimated by d.
Interestingly, analysis of our data showed that the MICs of
all three azoles determined by AD-Cas were in better
agree-ment with the MICs obtained with BM than were those
pro-duced by AD-RPMI. The MICs of all three azoles obtained
with AD-RPMI showed a marked increase between the
1st-and the 2nd-day readings. This was rarely observed for the
MICs obtained by AD-Cas. A tendency to higher fluconazole
MICs in assays with agar dilutions buffered with MOPS
com-pared to those obtained in phosphate- or
endomethylene-tet-rahydrophthalic acid (EMTA)-buffered media has been
re-ported (28).
Recently, the Etest has been introduced as a means of
pro-ducing an accurate quantitative MIC result by using an agar
diffusion format (4, 9, 24). So far, literature data comparing
MICs obtained by Etest with those obtained by macro- or
microdilution have shown variable results depending on the
antifungal agent and the Candida species tested, as well as on
the medium used for testing (4, 9, 21, 24). Sewell et al. (24)
reported an agreement of 84% (62 dilutions) between
Etest-RPMI and broth macro- and microdilution methods for
flu-conazole susceptibility testing of Candida isolates when
end-point determinations were made after 24 h of incubation.
Our data demonstrated that fluconazole, ketoconazole, and
itraconazole MICs determined by Etest-Cas were in better
agreement with the BM MICs than those produced in
RPMI.
This study, which compared three different azole
suscepti-bility testing procedures for strains of C. albicans isolated
se-quentially from the oral cavities of AIDS patients undergoing
azole therapy, indicates that AD-Cas and Etest-Cas, as well as
BM, can demonstrate progressive increases in fluconazole
MICs against yeasts isolated from patients during the course of
their oral infections, in accordance with the decrease in clinical
response to fluconazole. In addition, all three methods were
able to reveal a decrease in susceptibility to itraconazole and
ketoconazole for some of the strains that developed resistance
to fluconazole, as previously reported (1).
In conclusion, our study indicates that Cas, unlike
AD-RPMI, is a suitable method for testing azoles against isolates of
C. albicans. AD-Cas produces results that agree with those
obtained by BM, provided that an appropriate method is used
to calculate the agreement. Etest-Cas can be used as an
alter-native method to determine azole susceptibility.
ACKNOWLEDGMENTS
This work was supported in part by grants from the IRCCS
Osped-ale Maggiore di Milano and the Istituto Superiore di Sanita`, Roma,
Italy (IX AIDS project).
REFERENCES
1. Barchiesi, F., A. L. Colombo, D. A. McGough, A. W. Fothergill, and M. G.
Rinaldi.1994. In vitro activity of itraconazole against fluconazole-susceptible
and -resistant Candida albicans isolates from oral cavities of patients infected with human immunodeficiency virus. Antimicrob. Agents Chemother. 38: 1530–1533.
2. Barchiesi, F., R. J. Hollis, D. A. McGough, G. Scalise, M. G. Rinaldi, and
M. A. Pfaller.1995. DNA subtypes and fluconazole susceptibilities of
Can-dida albicans from the oral cavities of patients with AIDS. Clin. Infect. Dis.
20:634–640.
3. Bland, J. M., and D. G. Altman. 1986. Statistical methods for assessing agreement between two methods of clinical measurement. Lancet i:307–311. 4. Colombo, A. L., F. Barchiesi, D. A. McGough, and M. G. Rinaldi. 1995. Comparison of Etest and National Committee for Clinical Laboratory Stan-dards broth macrodilution method for azole antifungal susceptibility testing. J. Clin. Microbiol. 33:535–540.
5. Cook, R. A., K. A. McIntyre, and J. N. Galgiani. 1990. Effects of incubation temperature, inoculum size, and medium on agreement of macro- and mi-crodilution broth susceptibility test results for yeasts. Antimicrob. Agents Chemother. 34:1542–1545.
6. Drouhet, E., B. Dupont, L. Improvisi, M. A. Viviani, and A. M. Tortorano. 1986. Disc agar diffusion and microplate automatized technics for in vitro evaluation of antifungal agents on yeasts and sporulated pathogenic fungi, p. 31–49. In K. Iwata and H. Vanden Bossche (ed.), In vitro and in vivo evaluation of antifungal agents. Elsevier Science Publishers B.V, Amster-dam, The Netherlands.
7. Druetta, A., A. Freydiere, R. Guinet, and Y. Gille. 1993. Evaluation of five commercial antifungal susceptibility testing systems. Eur. J. Clin. Microbiol. Infect. Dis. 12:336–342.
8. Dupont, B., L. Improvisi, M. Eliaszewicz, G. Pialoux, and the GEMO. 1992. Resistance of Candida albicans to fluconazole in AIDS patients, abstr. 1203, p. 311. In Program and abstracts of the 32nd Interscience Conference on Antimicrobial Agents and Chemotherapy. American Society for Microbiol-ogy, Washington, D.C.
9. Espinel-Ingroff, A., M. Pfaller, M. E. Erwin, and R. N. Jones. 1996. An interlaboratory evaluation of Etest method for testing antifungal suscepti-bilities of pathogenic yeasts to five antifungal agents by using Casitone agar and solidified RPMI 1640 medium with 2% glucose. J. Clin. Microbiol.
34:848–852.
10. Galgiani, J. N. 1987. Antifungal susceptibility tests. Antimicrob. Agents Chemother. 31:1867–1870.
11. He, X., R. N. Tiballi, L. T. Zarins, S. F. Bradley, J. A. Sangeorzan, and C. A.
Kauffman.1994. Azole resistance in oropharyngeal Candida albicans strains
isolated from patients infected with human immunodeficiency virus. Anti-microb. Agents Chemother. 38:2495–2497.
12. Johnson, E. M., D. W. Warnock, J. Luker, S. R. Porter, and C. Scully. 1995. Emergence of azole resistance in Candida species from HIV-infected pa-tients receiving prolonged fluconazole therapy for oral candidosis. J. Anti-microb. Chemother. 35:103–114.
13. National Committee for Clinical Laboratory Standards. 1995. Reference method for broth dilution antifungal susceptibility testing of yeasts. Tenta-tive standard M27-T. National Committee for Clinical Laboratory Stan-dards, Villanova, Pa.
14. Pfaller, M. A., B. Buschelman, M. J. Bale, M. Lancaster, A. Espinel-Ingroff,
J. H. Rex, and M. G. Rinaldi.1994. Multicenter comparison of a colorimetric
microdilution broth method with the reference macrodilution method for in vitro susceptibility testing of yeast isolates. Diagn. Microbiol. Infect. Dis.
19:9–13.
15. Pfaller, M. A., C. Grant, V. Mortland, and J. Rhine-Chalberg. 1994. Com-parative evaluation of alternative methods for broth dilution susceptibility testing of fluconazole against Candida albicans. J. Clin. Microbiol. 32:506– 509.
16. Pfaller, M. A., and M. G. Rinaldi. 1993. Antifungal susceptibility testing. Current state of technology, limitations, and standardization. Infect. Dis. Clin. N. Am. 7:435–444.
17. Redding, S., J. Smith, G. Farinacci, M. G. Rinaldi, A. Fothergill, J.
Rhine-Chalberg, and M. Pfaller.1994. Resistance of Candida albicans to
flucon-azole during treatment of oropharyngeal candidiasis in a patient with AIDS: documentation of in vitro susceptibility testing and DNA subtype analysis. Clin. Infect. Dis. 18:240–242.
on May 15, 2020 by guest
http://jcm.asm.org/
18. Rex, J. H., M. A. Pfaller, M. G. Rinaldi, A. Polak, and J. N. Galgiani. 1993. Antifungal susceptibility testing. Clin. Microbiol. Rev. 6:367–381. 19. Rex, J. H., M. G. Rinaldi, and M. A. Pfaller. 1995. Resistance of Candida
species to fluconazole. Antimicrob. Agents Chemother. 39:1–8.
20. Ruhnke, M., A. Eigler, E. Engelmann, B. Geiseler, and M. Trautmann. 1994. Correlation between antifungal susceptibility testing of Candida isolates from patients with HIV infection and clinical results after treatment with fluconazole. Infection 22:132–136.
21. Ruhnke, M., A. Schmidt-Westhausen, E. Engelmann, and M. Trautmann. 1996. Comparative evaluation of three antifungal susceptibility test methods for Candida albicans isolates and correlation with response to fluconazole therapy. J. Clin. Microbiol. 34:3208–3211.
22. Sanchez, M. L., and R. N. Jones. 1992. Etest, an antimicrobial susceptibility testing method with broad clinical and epidemiologic application. Antimi-crob. Newsl. 8:1–7.
23. Schmalreck, A. F., et al. 1996. Empfindlichkeitsprufung von Fluconazole: Auswertung einer Multizenter-Studie der Arbeitsgemeinschaft “Klinische
Mykologie” der deutschsprachigen mykologischen Gesellschaft. Mycoses
39(Suppl. 2):1–11.
24. Sewell, D. L., M. A. Pfaller, and A. L. Barry. 1994. Comparison of broth macrodilution, broth microdilution, and E test antifungal susceptibility tests for fluconazole. J. Clin. Microbiol. 32:2099–2102.
25. Sheehan, D. J., A. Espinel-Ingroff, L. S. Moore, and C. D. Webb. 1993. Antifungal susceptibility testing of yeasts: a brief overview. Clin. Infect. Dis.
17(Suppl. 2):S494–S500.
26. Viviani, M. A., A. M. Tortorano, E. Cabrini, and A. Restelli. 1980. Effetto del terreno di coltura sull’attivita` in vitro di tre derivati dell’imidazolo: micon-azolo, econmicon-azolo, ketoconazolo. Chemioter. Antimicrob. 3:129–134. 27. Warren, N. G., and H. J. Shadomy. 1991. Yeasts of medical importance, p.
617–629. In A. Balows, W. J. Hausler, Jr., K. L. Herrmann, H. D. Isenberg, and H. J. Shadomy (ed.), Manual of clinical microbiology, 5th ed. American Society for Microbiology. Washington, D.C.
28. Werner, E., M. Seilbold, and E. Antweiler. 1993. Susceptibility testing of
Candida species for fluconazole: the role of buffering in the agar dilution
assay. Mycoses 36:125–130.