© 2016, IRJET | Impact Factor value: 4.45 | ISO 9001:2008 Certified Journal | Page 107
AN EXPERIMENTAL INVESTIGATION ON BEHAVIOUR OF OPEN END
PIPES IN SANDY SOIL
Prof
.HARISH C
1, VINOD B.R
2,
NITHIN YADAV S
31 Assistant professor, Department of Civil Engineering, EWIT, Bengaluru, Karnataka, India
2 Assistant professor, Department of Civil Engineering, BMSIT&M , Bengaluru, Karnataka, India
3 M.Tech Student, Department of Civil Engineering, EWIT, Bengaluru, Karnataka, India
---***---Abstract -An experimental program in laboratory
is conducted on model piled rafts in sand soil. The aim of the experimental program is to study the behavior of piled raft foundation system subjected to vertical load. The experimental program includes the model test on un piled raft, raft supported by single pile, two, three, four and five pile and pile groups. The model piles used in this test are hollow steel rods of diameter 26 mm and the varying length of 280 mm, 210 mm and 140 mm. The raft was made of mild steel plate with plan dimensions of 190mm x 190mm with different thicknesses of 10mm ,15mm and 20mm.
The load carrying capacity may depend with the area and thickness of raft. The steel piles which are placed below the raft to support will help in reducing the differential and overall settlement with increase in number of pile and length of the pile. The refinement in the bearing capacity is represented by load improvement ratio and the reduction in settlement is represented by settlement reduction ratio. The influence of number of piles and raft thickness on load improvement ratio and settlement reduction ratio are presented and discussed.
Key Words: diameter, raft pile L/d ratio 40%,
60%&80%.
1.0INTRODUCTION
Pile foundations are a kind of deep foundations which are usually long slender members of small diameter transferring the load of the superstructure to a suitable bearing stratum. The pile foundations are useful when the soil layers are weak to lay the shallow foundation and the suitable hard bearing stratum is found at greater depths
.
1.1 Uses of piles
1) These help to achieve the required compressive
strength in soft soils.
2) To build the foundation in river bed and within the
scour depth.
3) The tension force in tall towers is resisted by piles
and prevents their overturning due to winds.
4) Pile foundations are economical for the structures
supporting vibrating machines such as turbines etc. to
transmit their vibrations deep into the strata.
5) To compact the loose soil, the compaction piles are
used to increase the bearing the capacity.
© 2016, IRJET | Impact Factor value: 4.45 | ISO 9001:2008 Certified Journal | Page 108 The soil material taken for the experiment is sandy soil.
[image:2.595.25.298.172.711.2]The properties of sandy soil are as listed
Table -1
Properties of sand
Sl no.
Property
Value
1)
Specific Gravity
2.64
2)
D
10(mm)
0.28
3)
D
30(mm)
0.45
4)
D
60(mm)
0.8
5)
Coefficient of curvature “C
C”
0.9
6)
Coefficient of uniformity “ C
u”
2.86
7)
Maximum void ratio “e
max”
0.512
8)
Minimum void ratio, “e
min”
0.355
9)
Maximum dry density,
“𝛾
max”(kN/m
3)
19.1
10)
Minimum dry density,
“𝛾
min”(kN/m
3)
17.2
11)
Angle of internal friction (Φ)
37
012)
Relative density attained by
compaction
66%
13)
Density achieved by compaction
(kN/m
3)
18.52
2.1 EXPERIMENTAL PROCEDURE
Step 1: About 40 kg of loose sand is collected which is
passing through IS 4.75mm sieve is filled in the square test tank.
Step 2: A square test tank of size of
350mm×350mm×350mm is used for the model test, sides of the square test tank was made smooth by coating bitumen gel to reduce the boundary effects.
Step 3: The sand is filled in the three layers and
compacted to obtain the density 18.52 kN/m3, the piles
whose length equal to 280 mm (80% of the tank height) is installed at the centre of the tank during the process of filling and compaction.
Step 4: The model raft is placed in the tank at the
centre, on the surface of the inserted steel piles to avoid eccentric loading.
Step 5: The tank is placed on the universal testing
machine to apply the load, which consist of movable platform that can move up and down in the different rates by a motorized mechanism and it facilitates to measure the load and settlement.
Step 6: The capacity of loading frame chosen should
exceed the maximum load that has been applied throughout the experiment.
Step 7: A square model raft of size 190mm×190mm
and 20mm thick made of mild steel is placed centrally on the surface of the steel pile.
Step 9: To measure the settlement dial gauge is fixed
on the loading platform.
Step 10: The load applied on the raft by universal
testing machine was taken analogue display and
settlement of the raft and pile was measured by dial
gauge.
The load is applied to the raft at constant rate.Step 11: After testing for the single pile, whose length
© 2016, IRJET | Impact Factor value: 4.45 | ISO 9001:2008 Certified Journal | Page 109 carried out for two, three, four and five number of
piles, installed at the spacing of 100mm.
Step 12:The above procedure is repeated for varying
[image:3.595.308.562.79.273.2]raft thickness of 15mm, 10mm and for the pile length of 210 mm (60% length of the tank) and 140 mm (40% length of the tank).
Fig 1.0 Experimental setup with a square tank and dial gauge
2.2 RESULTS AND DISCUSSION
2.2.1 COMPARISON OF LOAD-SETTLEMENT GRAPH FOR 20 MM THICK UN-PILED RAFT AND PILED RAFT
The sand is filled in the test tank in three layers and it is properly compacted to achieve the required density of 18.52.kN/m3, to maintain the relative density of
[image:3.595.48.275.240.501.2]66%. The 190×190×20mm raft was placed over the surface of the sand and load was applied till the total settlement reaches 25 mm.
Fig 1.1 Comparison of load -settlement plot for 20 mm thick un-piled raft and piled raft system.
2.2.2 COMPARISON OF LOAD-SETTLEMENT GRAPH FOR 15 mm THICK UN-PILED RAFT AND PILED RAFT
The number of pile increases the load carried by the pile-raft system also increases and increase in load carrying capacity of pile is mainly due to the increase of proportion of load shared by the piles due to the increase of the number of piles
.
[image:3.595.308.555.508.699.2]© 2016, IRJET | Impact Factor value: 4.45 | ISO 9001:2008 Certified Journal | Page 110
2.2.COMPARISON OF LOAD-SETTLEMENT GRAPH
FOR 10 mm THICK UN-PILED RAFT AND PILED RAFT
The number of pile increases the load carried by the pile-raft system also increases and increase in load carrying capacity of pile is mainly due to the increase of proportion of load shared by the piles due to the increase of the number of piles
.
Fig 1. 3 Comparison of load -settlement plot for 10 mm thick un-piled raft and piled raft system.
2.3 COMPARISON OF LOAD CARRIED BY THE DIFFERENT THICKNESS OF UN-PILED RAFT
.
[image:4.595.306.565.62.327.2]The load-settlement curves for the unpiled raft system of different raft thicknesses. It is observed that the load carrying capacity of the unpiled raft increase with the increase in raft thickness. Therefore thickness of the raft has the influence on the load carried by the piles
.
Fig 1.4 Load-settlement curves for different thickness of un-piled rafts
2.4 INFLUENCE OF NUMBER OF PILES BENEATH THE RAFT ON LOAD IMPROVEMENT RATIO
[image:4.595.38.289.286.496.2]© 2016, IRJET | Impact Factor value: 4.45 | ISO 9001:2008 Certified Journal | Page 111
[image:5.595.265.559.50.277.2]Fig 1.5 Load improvement ratio with number of piles at 25 mm settlement
Fig 1.6 Load improvement ratio with number of piles at 15 mm settlement
3.0
Comparison of load improvement ratio at
25 mm settlement and 15 mm settlement with
respect to the raft thickness
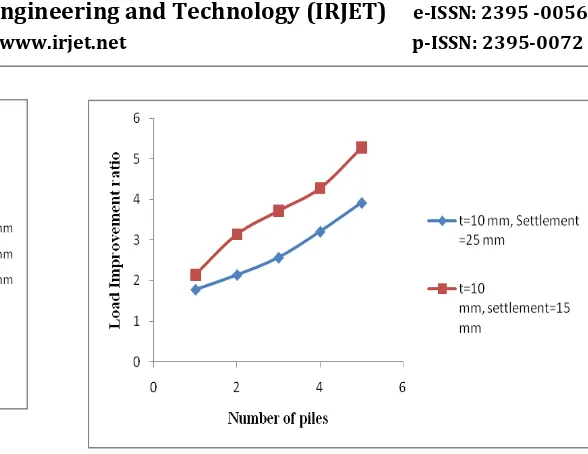
[image:5.595.35.293.348.507.2]The load improvement ratio for the raft thickness of 10 mm, 15 mm and 20 mm at 15 mm and 25 mm settlement respectively. From the graphs it is clear that load improvement ratio at 15 mm settlement is greater than the load improvement ratio at 25 mm settlement. The similar observation had been recorded by Phung (2010) and Jaymin D Patilet. al.,(2014)from their test results
Fig 1.7 Variation of Load improvement ratio for 10mm raft thickness at 15 mm settlement and 25 mm settlement.
[image:5.595.306.567.352.522.2]© 2016, IRJET | Impact Factor value: 4.45 | ISO 9001:2008 Certified Journal | Page 112 Fig 1.9 Variation of Load improvement ratio for 20 mm
raft thickness at 15 mm settlement and 25 mm settlement
[image:6.595.39.286.200.361.2]3.1 Influence of number of piles beneath the raft on settlement reduction ratio
Fig 2.0 Settlement reduction ratio with number of piles
4.0 CONCLUSIONS
1. The load carrying capacity of piled raft system increased with increase in number of piles. 2. The load carrying capacity of un-piled raft
increased with increase in raft thickness. 3. The value of load improvement ratio increased
as the number of piles beneath the raft increased.
4. The value of load improvement ratio for 15mm settlement of piles proved to be greater than the load improvement ratio for 25mm settlement.
5. Load improvement ratio decreased with increase in raft thickness.
6. As the number of piles underneath the raft increased it exhibited an increase in settlement reduction ratio.
7. The load settlement behaviour for 20 mm piles raft thickness directly resting on sand surface is 7.6 KN for the 25mm settlement
8. The load carried for the 20mm piles raft thickness is more than the load carried by the 80% length single pile to five pile load will be improvement upto the 25mm settlement
9. The load settlement behaviour for 15 mm piles raft thickness directly resting on sand surface is 5.0 KN for the 25mm settlement
10. The load carried for the 15mm piles raft thickness is more than the load carried by the 60% length single pile to five pile load will be improvement upto the 25mm settlement 11. The load settlement behaviour for 10 mm
piles raft thickness directly resting on sand surface is 2.6 KN for the 25mm settlement
12.
The load carried for the 10mm piles raftthickness is more than the load carried by the 40% length single pile to five pile load will be improvement upto the 25mm settlement
13.Influence of number of piles beneath the raft on load improvement ratio of different piles raft thickness 20mm,15mm&10mm. It is observed that the load carrying capacity of the unpiled raft increase with the increase in raft thickness
14.
The Settlement reduction ratio with number of© 2016, IRJET | Impact Factor value: 4.45 | ISO 9001:2008 Certified Journal | Page 113
REFERENCES
[
1] Balakumar V and IllamparuthiK(2010), Piledraft behavior basede on 1-g model studies, Indian Geotechnical Conference 2010, IGS Mumbai chapter & IIT Bombay.
[2] Fioravante, V.Giretti, Jamiolkowski M (2010),
Contact versus non-contact piled raft foundation, Canadian Geotechnical Journal, Vol 47.
[3]Jaymin D. Patil, Sandeep A Vasanwala et al
(2014), An experimental investigation on behavior of
piled raft foundation, International Journal of Geomatics and Geosciences, Volume 5,No 2.
[4] JayminD.Patil, Prof. S. A. Vasanvala et al (2013),
A study on piled raft foundation: State of Art, International Journal of Engineering Research and Technology, Vol 2, Issue 8.
[5] Lee S-H, and Chung C-K (2005), An experimental
study of the interaction of the vertically loaded pile groups in sand, Canadian Geotechnical Journal, Vol 42.
[6] Matsumoto T, Nemato H, et al (2010), Load test of
piled raft models with different pile head connection conditions and their analysis, Soils and
foundations,
Japanese Society of soil mechanics and foundation engineering, Vol 50.
[7] V.A Barshov and G.G Boldyrev (2009),
Experimental and theoretical research on analytical models of piled raft foundations, Soil Mechanics and Foundation engineering, Vol 46, No 6.
[8] Textbook of Analysis and Design of
Substructures – Swami Saran
[9] Textbook of soil mechanics and foundation