TGF-
bb
1 mediates the hypertrophic
cardiomyocyte growth induced by angiotensin II
Jo El J. Schultz, … , Thomas R. Kimball, Thomas
Doetschman
J Clin Invest.
2002;
109(6)
:787-796.
https://doi.org/10.1172/JCI14190
.
Angiotensin II (Ang II), a potent hypertrophic stimulus, causes significant increases in
TGFb1
gene expression. However, it is not known whether there is a causal relationship
between increased levels of TGF-
b
1 and cardiac hypertrophy. Echocardiographic analysis
revealed that TGF-
b
1–deficient mice subjected to chronic subpressor doses of Ang II had
no significant change in left ventricular (LV) mass and percent fractional shortening during
Ang IItreatment. In contrast, Ang II–treated wild-type mice showed a >20% increase in LV
mass and impaired cardiac function. Cardiomyocyte cross-sectional area was also
markedly increased in Ang II–treated wild-type mice but unchanged in Ang II–treated
TGF-b
1–deficient mice. No significant levels of fibrosis, mitotic growth, or cytokine infiltration
were detected in Ang II–treated mice. Atrial natriuretic factor expression was
~
6-fold
elevated in Ang II–treated wild-type, but not TGF-
b
1–deficient mice. However, the
a
- to
b
-myosin heavy chain switch did not occur in Ang II–treated mice, indicating that isoform
switching is not obligatorily coupled with hypertrophy or TGF-
b
1. The Ang IIeffect on
hypertrophy was shown not to result from stimulation of the endogenous renin-angiotensis
system. These results indicate that TGF-
b
1 is an important mediator of the hypertrophic
growth response of the heart to Ang II.
Article
Find the latest version:
Introduction
TGF-β1 has activities important for the regulation of development, cell differentiation, tissue maintenance, and repair in a variety of cells and tissues (1, 2). Gene ablation of Tgfb1has demonstrated important roles for TGF-β1 in preimplantation development (3), yolk sac development (4), lymphocyte function (5–7), tooth development (8), genetic stability (9), platelet activa-tion (10), and cancer (11–13). TGF-β1 is present in both cardiomyocytes and myocardial fibroblasts (14–18). In the heart, TGF-β1 has been shown to be expressed at high levels during cardiac development (19, 20) and pathology (2, 17, 18, 21). In fact, growth factors such as TGF-β1 and FGF-2 have been impli-cated in cardiomyocyte growth (16), fibrosis (22–24), and re-expression of the fetal isoforms of myofibrillar protein genes (25), all characteristics of hypertrophy. Recently, we have used Fgf2knockout mice to demon-strate that FGF-2 is required for a full hypertrophic response to high blood pressure, but that isoform switching is dependent upon high blood pressure rather than FGF-2 or hypertrophy (26).
Recent clinical evidence revealed that patients with idio-pathic hypertrophic obstructive cardiomyopathy have elevated Tgfb1mRNA and protein levels localized to car-diomyocytes and TGF-β1 receptor levels found on both cardiomyocytes and fibroblasts (17, 18). Human atrial tis-sue stimulated with angiotensin II (Ang II) resulted in a significant increase in Tgfb1mRNA (24). Conversely, Tiret and colleagues (27) investigated eight candidate genes, including Tgfb1, in the susceptibility of idiopathic dilat-ed cardiomyopathy and found that none of the poly-morphisms were significantly associated with the risk or severity of the disease. Similarly, Patel and group (28) cor-related functional variants of cardiac genes implicated in cardiac hypertrophy, including Tgfb1, with the severity of left ventricular (LV) hypertrophy in patients with hyper-trophic cardiomyopathy. However, only TNF-α correlat-ed with the indices of LV hypertrophy (28).
Other studies have demonstrated that Ang II, a potent hypertrophic stimulus, causes significant increases in
Tgfb1expression. The Ang II–mediated increases in Tgfb1
expression have been shown to correlate with cardiac hypertrophy (29), fibrosis (24, 30), and recapitulation of
TGF-
β
1 mediates the hypertrophic
cardiomyocyte growth induced
by angiotensin II
Jo El J. Schultz,
1,2Sandra A. Witt,
3Betty J. Glascock,
3Michelle L. Nieman,
4Peter J. Reiser,
5Stacey L. Nix,
1Thomas R. Kimball,
3and Thomas Doetschman
11Department of Molecular Genetics, Biochemistry, and Microbiology, and
2Department of Pharmacology and Cell Biophysics, Cincinnati College of Medicine, Cincinnati, Ohio, USA
3Noninvasive Cardiac Imaging and Hemodynamic Research Laboratory, Division of Cardiology, Department of Pediatrics,
Children’s Hospital Medical Center, Cincinnati, Ohio, USA
4Department of Molecular and Cellular Physiology, University of Cincinnati College of Medicine, Cincinnati, Ohio, USA 5Department of Oral Biology, The Ohio State University, Columbus, Ohio, USA
Address correspondence to: Jo El J. Schultz, Department of Pharmacology and Cell Biophysics, University of Cincinnati, College of Medicine, 231 Albert Sabin Way, ML 0575, Cincinnati, Ohio 45267, USA.
Phone: (513) 558-9754; Fax: (513) 558-1169; E-mail: schuljo@email.uc.edu.
Received for publication September 11, 2001, and accepted in revised form January 21, 2002.
Angiotensin II (Ang II), a potent hypertrophic stimulus, causes significant increases in TGFb1gene expression. However, it is not known whether there is a causal relationship between increased levels of TGF-β1 and cardiac hypertrophy. Echocardiographic analysis revealed that TGF-β1–deficient mice subjected to chronic subpressor doses of Ang II had no significant change in left ventricular (LV) mass and percent fractional shortening during Ang II treatment. In contrast, Ang II–treated wild-type mice showed a >20% increase in LV mass and impaired cardiac function. Cardiomyocyte cross-sectional area was also markedly increased in Ang II–treated wild-type mice but unchanged in Ang II–treated TGF-β1–deficient mice. No significant levels of fibrosis, mitotic growth, or cytokine infiltration were detected in Ang II–treated mice. Atrial natriuretic factor expression was ∼6-fold ele-vated in Ang II–treated wild-type, but not TGF-β1–deficient mice. However, the α- to β-myosin heavy chain switch did not occur in Ang II–treated mice, indicating that isoform switching is not obliga-torily coupled with hypertrophy or TGF-β1. The Ang II effect on hypertrophy was shown not to result from stimulation of the endogenous renin-angiotensis system. These results indicate that TGF-β1 is an important mediator of the hypertrophic growth response of the heart to Ang II.
J. Clin. Invest.109:787–796 (2002). DOI:10.1172/JCI200214190.
fetal isoforms of cardiac myofibrillar proteins (31). Fur-thermore, cardiac hypertrophy and increased gene expres-sion of Tgfb1and atrial natriuretic factor (Anf) have been demonstrated to be mediated by the Ang II type 1 (AT1) receptor (32). Recent work by Ichihara and colleagues (33) demonstrated that mice lacking the Ang II receptor (At2) gene, when treated with pressor doses of Ang II, had no cardiac hypertrophy and had suppressed mRNA lev-els of Tgfb1, collagen I and III, and fibronectin. This group suggested that the loss of AT2 signaling attenuated the Ang II–induced gene expression of extracellular matrix (33). Nonetheless, it is not known whether there is a causal relationship between increased levels of Tgfb1and hypertrophy, isoform switching and fibrosis.
Our laboratory has generated a mouse that carries a targeted disruption in the Tgfb1gene (5). These mice have provided a valuable in vivo model to study the role of TGF-β1 in development, cardiovascular func-tion, injury, and disease. Tgfb1knockout mice have a multifocal autoimmune-like inflammatory disease that leads to death by weaning age (5, 6). However, when these mice are bred onto an immune-compro-mised background, the inflammatory response is elim-inated and the mice become useful for studying the effects of TGF-β1 in cardiac pathophysiological situa-tions, including cardiac hypertrophy (7).
To examine whether TGF-β1 is essential for the devel-opment of cardiac hypertrophy, subpressor doses of Ang II were chronically administered for 4 weeks to
Tgfb1+/+Rag1–/–andTgfb1–/–Rag1–/–mice in the present study. Ang II was used instead of aortic banding because
Tgfb1–/–mice are acutely sensitive to major surgical stress and rarely survive invasive surgery, due, in part, to the platelet aggregation defect that results in a doubling of bleeding time (10). For this reason, we used pharmaco-logical treatment to induce hypertrophy. To avoid con-fusing the effects of Ang II with those of high blood pres-sure, we used chronic infusion of subpressor doses of Ang II. The results indicate that TGF-β1 is necessary for Ang II–mediated cardiac hypertrophy, but not for the re-expression of β-MHC protein, the fetal isoform of myosin heavy chain. The hypertrophic growth response of the heart occurred independently of an endogenously acti-vated renin-angiotensin system (RAS), thereby demon-strating a direct action of TGF-β1 on cardiac remodeling.
Methods
Tgfb1–/–mice (5) were genetically combined with Rag1–/– mice (34) resulting in a colony with a mixed back-ground of 129, CF1, and C57BL/6 (∼2:1:1 ratios, respectively). Mice were housed in a specific pathogen-free facility and handled in accordance with standard use protocols and animal welfare regulations. All pro-tocols were approved by the University of Cincinnati Institutional Animal Care and Use Committee.
Tgfb1+/+Rag1–/–and Tgfb1–/–Rag1–/–mice (6–8 weeks of age) were randomly assigned to the present study, and 11
Tgfb1+/+Rag1–/– and ten Tgfb1–/–Rag1–/– mice receiving Ang II and eight Tgfb1+/+Rag1–/–and 6 Tgfb1–/–Rag1–/–
mice receiving saline completed the project, which included echocardiography, blood pressure measure-ments, histology/morphology, and Anf expression and MHC protein determination. Exclusion from the study was based on signs of distress (i.e., loss of body weight, lethargy) following implantation of the mini-pump. One
Tgfb1+/+Rag1–/–mouse and five Tgfb1–/–Rag1–/–mice were excluded because of death or signs of morbidity.
Subcutaneous implantation of mini-osmotic pumps.
Tgfb1+/+Rag1–/–and Tgfb1–/–Rag1–/–mice of either sex weighing 18–24 g were anesthetized intraperitoneally with 2.5% Avertin (2 mg/0.01 kg). Under sterile condi-tions, a midscapular incision was made. With the use of a dissecting stereoscope, a blunt dissection to spread the subcutaneous tissue, creating a pocket for the mini-osmotic pump, was performed. A mini-mini-osmotic pump (ALZET, model 1002 or 2004; ALZA Corp., Palo Alto, California, USA) filled with saline or a subpressor dose of Ang II (100 ng/kg/min) was inserted underneath the skin. The incision was closed with 5-0 silk. The con-tents of the mini-osmotic pump were delivered into the local subcutaneous space at a rate of 0.25 µl/hour for 4 weeks. The mice were monitored daily for 4 weeks, not-ing body weight and water intake. The subpressor dose and delivery time of Ang II was based on preliminary, unpublished dose response data from our lab and pub-lished work by Harada and colleagues (35).
Echocardiography. Echocardiography was performed preoperatively and once a week postoperatively for 4 weeks on immunodeficient wild-type and Tgfb1 knock-out mice, as previously described (26). Intra- and inter-observer variability was similar to that previously noted in our laboratory (36). M-mode measurements of LV end-diastolic and end-systolic chamber size (LVED and LVES, respectively), septal wall thickness (SWT), LV posterior wall thickness (PWT) in diastole and systole, and R-R intervals were made from original tracings, as suggested by the American Society of Echocardiogra-phy (37). LV mass was estimated using the cube for-mula and cardiac function (fractional shortening, or FS) was calculated (26).
In vivo blood pressure measurements. Blood pressure meas-urements were obtained as described previously (26). Briefly, pretreated and 4-week saline- and Ang II–treated
Tgfb1+/+Rag1–/–and Tgfb1–/–Rag1–/–mice of either sex were anesthetized with intraperitoneal injections of ketamine and inactin. A tracheotomy was performed to allow the mice to breathe spontaneously. A catheter was placed in the femoral artery for the measurement of systemic blood pressure. A Millar (1.4F) catheter (Millar Instru-ments Inc., Houston, Texas, USA) was placed in the right common carotid artery and advanced into the left ven-tricle for the measurement of left intraventricular pres-sure. Body temperature was maintained at 37°C using a thermally controlled surgical table and monitored with a rectal probe. The mice were then allowed to stabilize for 30 minutes prior to the blood pressure measurements.
Tgfb1+/+Rag1–/–and Tgfb1–/–Rag1–/–mice before and after 4 weeks of saline or drug infusion. Extraction and determination of aldosterone levels in the urine were performed according to the Coat-A-Count aldosterone procedure (Diagnostic Products Corp., Los Angeles, California, USA). Hydrolysis of urine with 3.2 N HCl occurred overnight at room temperature in the dark, followed by an ethyl acetate extraction. To known stan-dard and urine samples, 1 ml of 125I aldosterone was added, and the samples were incubated for 18 hours at room temperature. Samples were counted for 1 minute in a gamma counter, and a standard calibration curve was produced. Aldosterone levels (picograms per milli-liter) in the urine samples from Tgfb1+/+Rag1–/–and Tgfb1–/–Rag1–/–mice were determined from the stan-dard calibration curve, and aldosterone concentration (micrograms per day) was calculated.
Electrolyte (Na+and K+) levels were also determined from 24-hour urine samples obtained from
Tgfb1+/+Rag1–/–and Tgfb1–/–Rag1–/– mice before and after 4 weeks of saline or drug infusion. Urine samples were diluted within the linear range for quantitation of Na+and K+levels by flame photometry (Corning model 480; Ciba Corning Diagnostics Corp., Medfield, Massachusetts, USA).
Cardiac myocyte staining. Morphological changes (i.e., myocyte cross-sectional area and longitudinal dimen-sion) were measured by fluorescence staining of heart (left ventricle) sections from 4-week saline- and Ang II– treated Tgfb1+/+Rag1–/–and Tgfb1–/–Rag1–/–mice as pre-viously described (26). Fluorescence-tagged wheat germ agglutinin was employed because it binds to saccha-rides of cellular membranes (38) and has been used by other investigators for the measurement of myocyte cross-sectional area (39). Images of LV cardiomyocyte cell membranes were captured digitally and analyzed using NIH Scion Image (version 1.62a).
Detection of Anf expression in the heart. Samples from the left ventricle of saline- and Ang II–treated Tgfb1+/+Rag1–/– and Tgfb1–/–Rag1–/–mice were prepared for real-time PCR employing RNA isolation and first-strand cDNA meth-ods. Total RNA was isolated with RNAzol B (Tel-Test Inc., Friendswood, Texas, USA), following the manufacturer’s instructions, with a final concentration of 1.3–2.9 µg/µl. RNA (7.5 µg) was transcribed into cDNA using oligo-dT (as the primer) and Superscript II Reverse Transcriptase (Life Technologies Inc., Rockville, Maryland, USA). The cDNA reaction was diluted to a final volume of 75 µl, and 1.5 µl from each sample was used for PCR amplification. Real-time PCR (Smart Cycler model; Cepheid, Sunny-vale, California, USA) with the Light Cycler DNA Master SYBR Green I dye intercalation assay (Roche Molecular Biochemicals Inc., Indianapolis, Indiana, USA) was per-formed to detect the cardiac expression of Anfin saline-and Ang II–treated Tgfb1+/+Rag1–/–and Tgfb1–/–Rag1–/– mice as described previously (40). Primers were generat-ed to murine Anf(upper 5′CCTGTGTACAGTGCGGTGTC3′ and lower 5′TGACCTCATCTTCTACCGGC3′; GenBank accession number K02781) to discriminate between
products derived from cDNA and genomic DNA tem-plates. The cDNA samples were subjected to real-time PCR, with an annealing temperature of 60°C, in which a 91-bp fragment of the Anf gene was amplified. Measure-ments were taken at the end of the 72°C extension step in each cycle, and the second derivative method was used to calculate the threshold cycle. Melt curve analysis showed a single sharp peak for all samples. Arabidopsis thalianamRNA spiked into each RNA sample was used to control for efficiencies of the cDNA and PCR reactions. The control (saline-treated wild-type) thresholds were averaged and this average was compared against the treatment groups of Tgfb1+/+Rag1–/–and Tgfb1–/–Rag1–/– mice. The threshold cycle differences correspond to the fold changes for Anfexpression in the different groups.
Gel electrophoresis and protein separation of α-MHC and
β-MHC. Samples from the left ventricle of saline- and Ang II–treated Tgfb1+/+Rag1–/–and Tgfb1–/–Rag1–/–mice were prepared for gel electrophoresis. The methods for sample preparation and for separation of α-MHC and β-MHC protein and quantification of the MHC iso-forms were performed as described previously (26, 41).
Statistical analysis of data. All values are expressed as mean plus or minus SEM. Myocyte cross-sectional area, tissue weight/tibia length ratios, renin-angiotensin parameters (blood pressure, urine aldosterone, and Na+levels), Anf gene expression, and MHC protein levels were compared by Student ttest. Differences between echocardiograph-ic data, body weights, and water intake at various time points were compared using two-way ANOVA for time and treatment with repeated measures with Fisher’s least significant difference test. Statistical differences were con-sidered significant when Pvalues were less than 0.05.
Results
Echocardiography was performed on Tgfb1+/+Rag1–/–and Tgfb1–/–Rag1–/– mice before and during the 4-week administration of a subpressor dose of Ang II (100 ng/kg/min). For all echocardiographic parameters stud-ied, Ang II–treated mice were compared with saline-treated mice. Table 1 depicts the echocardiographic measurements of LV chamber size (LVED and LVES), SWT and PWT, heart rate (HR), stroke volume (SV), and cardiac output (CO) obtained before and during the time course of Ang II treatment. By 3 weeks of Ang II, both LVED and PWT were significantly higher in
Tgfb1+/+Rag1–/–mice, and by 4 weeks of Ang II, LVED and LVES were significantly elevated compared with pre-treatment measurements (P< 0.05). At 4 weeks of Ang II,
sig-nificant difference in echocardiographic measures at any time point. Cardiac function (%FS) was generally unchanged in Ang II–treated Tgfb1–/–Rag1–/– mice, although %FS was significantly higher at 1 and 4 weeks of Ang II administration compared with Tgfb1+/+Rag1–/– mice. Consequently, cardiac function was significantly diminished by 4 weeks of Ang II treatment in
Tgfb1+/+Rag1–/–mice, correlating with the increase in LV mass (see Figure 1a). This observation of impaired func-tion in hypertrophic hearts supports our previous find-ings (26) and those of Ichihara and group (33). Table 2 shows the hemodynamic characteristics of
Tgfb1+/+Rag1–/– and Tgfb1–/–Rag1–/– mice following 4 weeks of saline or Ang II treatment. HR and the rate of relaxation, –dP/dt, were not significantly different among the groups. However, Ang II–treated
Tgfb1–/–Rag1–/–mice had significantly lower mean blood
pressure and LV pressure compared with saline-treated
Tgfb1–/–Rag1–/–mice and Ang II–treated Tgfb1+/+Rag1–/– mice (P< 0.05). The rate of contraction, +dP/dt, was also significantly lower compared with Ang II–treated
[image:5.576.59.537.80.291.2]Tgfb1+/+Rag1–/–mice (P< 0.05). The echocardiographic and hemodynamic indices of contractility did not corre-late in this study; however, this finding was similar to other experimental and clinical studies comparing echocardiographic and catheterization analyses (42–45). Table 1
Echocardiographic measures before and during 4 weeks of saline or Ang II (100 ng/kg/min) in Tgfb1+/+Rag1–/–and Tgfb1–/–Rag1–/–mice
LVED LVES SWT PWT %FS HR SV CO
Preinfusion Tgfb1+/+Rag1–/– 3.55 ± 0.14 2.08 ± 0.11 0.73 ± 0.02 0.56 ± 0.03 42 ± 1 498 ± 31 0.034 ± 0.005 17.3 ± 3.3
Tgfb1–/–Rag1–/– 3.45 ± 0.11 1.89 ± 0.15 0.68 ± 0.03 0.56 ± 0.01 46 ± 3 442 ± 17D 0.026 ± 0.004 11.4 ± 1.4D
1-week Tgfb1+/+Rag1–/– 3.62 ± 0.18 2.19 ± 0.20 0.72 ± 0.06 0.64 ± 0.04 38 ± 3 472 ± 22 0.028 ± 0.004 13.5 ± 2.5
saline infusion Tgfb1–/–Rag1–/– 2.96 ± 0.17A,B 1.43 ± 0.09B 0.61 ± 0.05 0.63 ± 0.03 52 ± 2A 447 ± 24 0.023 ± 0.003 10.0 ± 1.1
1-week Tgfb1+/+Rag1–/– 3.80 ± 0.22 2.42 ± 0.23 0.74 ± 0.05 0.55 ± 0.03 37 ± 4 522 ± 21B 0.030 ± 0.003 15.7 ± 1.7
Ang II infusion Tgfb1–/–Rag1–/– 3.54 ± 0.26C 1.92 ± 0.13D 0.64 ± 0.05 0.51 ± 0.02A,C 45 ± 2D 431 ± 19D 0.027 ± 0.005 11.6 ± 1.6D
2-week Tgfb1+/+Rag1–/– 3.64 ± 0.21 2.16 ± 0.11 0.77 ± 0.05 0.57 ± 0.06 43 ± 0.3 478 ± 24 0.040 ± 0.006 19.4 ± 3.1
saline infusion Tgfb1–/–Rag1–/– 3.12 ± 0.24B 1.74 ± 0.19B 0.76 ± 0.09 0.35 ± 0.02B 45 ± 2 566 ± 43B 0.023 ± 0.009 12.5 ± 3.6
2-week Tgfb1+/+Rag1–/– 3.78 ± 0.20 2.28 ± 0.15 0.71 ± 0.06 0.62 ± 0.07 40 ± 1 438 ± 13A 0.038 ± 0.008 17.1 ± 3.9
Ang II infusion Tgfb1–/–Rag1–/– 3.48 ± 0.28 2.18 ± 0.16 0.68 ± 0 .06 0.52 ± 0.06C 39 ± 2 429 ± 17 0.037 ± 0.008 16.0 ± 3.3
3-week Tgfb1+/+Rag1–/– 3.60 ± 0.12 2.13 ± 0.14 0.68 ± 0.05 0.56 ± 0.03 43 ± 2 536 ± 33 0.029 ± 0.003 15.7 ± 2.2
saline infusion Tgfb1–/–Rag1–/– 2.62 ± 0.36A,B 1.35 ± 0.43B 0.54 ± 0.03B 0.47 ± 0.13 54 ± 10 496 ± 35 0.026 ± 0.001 12.9 ± 0.8
3-week Tgfb1+/+Rag1–/– 3.95 ± 0.22A 2.26 ± 0.20 0.77 ± 0.07 0.65 ± 0.05A,B 43 ± 3 503 ± 38 0.038 ± 0.010 18.1 ± 3.7
Ang II infusion Tgfb1–/–Rag1–/– 3.55 ± 0.32C 2.01 ± 0.26 0.69 ± 0.07 0.64 ± 0.07 46 ± 3 445 ± 22 0.025 ± 0.001 11.0 ± 0.4D
4-week Tgfb1+/+Rag1–/– 3.68 ± 0.18 2.32 ± 0.15 0.74 ± 0.02 0.55 ± 0.03 43 ± 2 503 ± 24 0.038 ± 0.005 19.8 ± 2.6
saline infusion Tgfb1–/–Rag1–/– 2.87 ± 0.24A,B 1.22 ± 0.03B 0.67 ± 0.02B 0.48 ± 0.01B 57 ± 3A 414 ± 14B 0.033 ± 0.006 13.7 ± 3.0
4-week Tgfb1+/+Rag1–/– 3.85 ± 0.12A 2.64 ± 0.11A,B0.76 ± 0.02 0.58 ± 0.03 32 ± 1A,B 442 ± 34 0.040 ± 0.006 18.2 ± 3.4
Ang II infusion Tgfb1–/–Rag1–/– 3.03 ± 0.55D 1.51 ± 0.49D 0.69 ± 0.02D 0.59 ± 0.08 52 ± 5D 415 ± 90 0.026 ± 0.010 11.6 ± 4.8
LVED, LVES, SWT (at end-diastole), PWT (at end-diastole) in millimeters. FS was determined from the echocardiographic measurements of LVED and LVES. HR, in beats per minute; SV, in milliliters; CO, in milliliters per minute. All values are represented as mean ± SEM. AP< 0.05 vs. preinfusion cohort. BP< 0.05
[image:5.576.314.517.467.737.2]vs.Tgfb1+/+Rag1–/–saline for same week. CP< 0.05 vs. Tgfb1–/–Rag1–/–saline for same week. DP< 0.05 vs. Tgfb1+/+Rag1–/–Ang II for same week.
Figure 1
Serial echocardiographic results for Tgfb1+/+Rag1–/– and
Tgfb1–/–Rag1–/–mice before and weeks during saline or subpressor
Ang II treatment. LV mass was estimated from the echocardiographic measurements of SWT, PWT, and LVED. All values are expressed as mean ± SEM. *P< 0.05 vs. pre-Ang II. #P< 0.05 vs. Tgfb1+/+Rag1–/–.
n= 8 for saline-treated Tgfb1+/+Rag1–/–mice and n= 6 for
saline-treat-ed Tgfb1–/–Rag1–/–mice. n= 11 for Ang II–treated Tgfb1+/+Rag1–/–
mice, and n= 10 Ang II–treated Tgfb1–/–Rag1–/– mice. (a) Estimated
LV mass for pretreatment and 1–4 weeks of saline-treated (dark gray bars) or Ang II–treated (white bars) Tgfb1+/+Rag1–/–mice. By 3 weeks
of subpressor Ang II treatment, a marked increase in LV mass was observed in Tgfb1+/+Rag1–/–mice compared with their saline cohorts.
(b) Estimated LV mass for pretreatment and 1–4 weeks of saline-treated (light gray bars) or Ang II–saline-treated (black bars) Tgfb1–/–Rag1–/–
mice. No significant increase in LV mass was noted in Ang II–treated
Figure 1, a and b, illustrates the estimated LV mass for saline- and Ang II–treated Tgfb1+/+Rag1–/– and Tgfb1–/–Rag1–/–mice. No significant increase in LV mass was observed in Tgfb1–/–Rag1–/–mice during the course of Ang II administration compared with their pretreat-ment measurepretreat-ment or saline-treated Tgfb1–/–Rag1–/– mice (Figure 1b). Three and 4 weeks of chronic Ang II treatment resulted in a statistically significant degree of cardiac hypertrophy (20–28%) in Tgfb1+/+Rag1–/–mice compared with their pretreatment LV mass or saline-treated Tgfb1+/+Rag1–/– mice and Ang II–treated Tgfb1–/–Rag1–/–mice for the same time points (Figure 1a, P< 0.05). There was no significant change in LV mass or in LV dimensions in Tgfb1+/+Rag1–/–and Tgfb1–/–Rag1–/– mice during the course of saline treatment com-pared with their pretreatment measurements.
Gravimetrically, Tgfb1–/–Rag1–/–mice had no sig-nificant increase in heart weight (HW) normal-ized to tibia length compared with their age- and sex-matched 4-week saline-treated cohorts (Fig-ure 2). Similar to the echocardiographic analysis, HW/tibia length of Tgfb1+/+Rag1–/– mice was increased significantly following Ang II adminis-tration (P< 0.05). There were no changes in lung or kidney weights in the Ang II–treated
Tgfb1+/+Rag1–/–and Tgfb1–/–Rag1–/–mice compared with their saline-treated cohorts, indicating an absence of pulmonary edema and heart failure. Before any treatment, as well as during the course of the study, significant differences in body
weight and organ weight (∼1.3-fold less in knockout mice) were observed between Tgfb1+/+Rag1–/– and
[image:6.576.60.362.55.370.2]Tgfb1–/–Rag1–/–mice (see inset of Figure 2), although tibia length between the two groups was not different (17.2 ± 0.3 mm vs. 16.6 ± 0.3 mm, respectively; see inset). Body weight was not significantly altered in saline- or Ang II–treated Tgfb1+/+Rag1–/–mice during the course of the study (see inset). Since after 1 week of age the knockout mice gain weight at a slower rate than their wild-type littermates and often begin los-ing weight after 15 days of age (5, 7, 46), tibia length, which did not change throughout the experiment, was used to normalize against the organ weight. The increase in HW in Ang II–treated Tgfb1+/+Rag1–/–mice
Figure 2
Tissue weight-to-tibia length ratios for 4-week saline- and Ang II–treated Tgfb1+/+Rag1–/–and
Tgfb1–/–Rag1–/–mice. All values are expressed
as mean ± SEM. *P< 0.05 vs. saline treatment.
n= 8 for saline-treated Tgfb1+/+Rag1–/–mice,
and n= 6 for saline-treated Tgfb1–/–Rag1–/–
mice. n= 11 for Ang II–treated Tgfb1+/+Rag1–/–
mice, and n = 10 for Ang II–treated
Tgfb1–/–Rag1–/– mice. (a) Ang II–treated
Tgfb1+/+Rag1–/–mice (white bars) had a
signifi-cant increase in heart/tibia ratio compared with the saline-treated mice (dark gray bars). (b) No significant difference in heart/tibia was observed in 4-week saline-treated (light gray bars) and Ang II–treated Tgfb1–/–Rag1–/–mice
(black bars). Inset: Graph depicting changes in body weight (small symbols) and tibia length (large symbols) in saline- and Ang II–treated
Tgfb1+/+Rag1–/– and Tgfb1–/–Rag1–/– mice.
Saline-treated Tgfb1+/+Rag1–/–mice, filled
dia-monds. Saline-treated Tgfb1–/–Rag1–/–mice,
open squares. Ang II–treated Tgfb1+/+Rag1–/–
mice, open diamonds. Ang II–treated
Tgfb1–/–Rag1–/– mice, filled squares. Body
weight was significantly lower in
Tgfb1–/–Rag1–/– mice compared with
Tgfb1+/+Rag1–/–mice and continued to decrease
[image:6.576.289.536.605.693.2]during the course of the study, whereas tibia length for both groups of mice was similar.
Table 2
Hemodynamics of Tgfb1+/+Rag1–/–andTgfb1–/–Rag1–/–mice following 4
weeks of saline or Ang II treatment
Tgfb1+/+Rag1–/– Tgfb1–/–Rag1–/–
Saline Ang II Saline Ang II
HR 433 ± 11 427 ± 12 436 ± 15 429 ± 25 MAP 80 ± 8 78 ± 5 79 ± 3 63 ± 5A,B
LVP 110 ± 10 110 ± 7 100 ± 4 86 ± 2A,B
+dP/dt 10,369 ± 991 9,819 ± 594 9,048 ± 959 7,697 ± 646B
–dP/dt –10,311 ± 1,401 –9,163 ± 576 –9,719 ± 1,003 –8,358 ± 760
HR, beats per minute. MAP and LVP in millimeters of mercury. +dP/dt and –dP/dt in millimeters of mercury per second. All values are represented as mean ± SEM. MAP, mean arterial blood pressure. AP< 0.05 vs. saline-treated Tgfb1–/–Rag1–/–mice.
is probably not the result of cardiac volume overload or tissue edema since the lung and kidney weights of this group are not different between saline treatment or Ang II treatment (Figure 2).
Morphological changes in LV cardiomyocytes from 4-week saline- and Ang II–treated Tgfb1+/+Rag1–/–and Tgfb1–/–Rag1–/– mice are represented in Figure 3a. Although HW/tibia length ratio is smaller in knockout compared with wild-type mice, the myocyte size is sim-ilar between the two groups, suggesting fewer cells in
Tgfb1–/–Rag1–/–mice. Morphometric analysis showed that Tgfb1–/–Rag1–/–mice had no change in cardiomy-ocyte cross-sectional area following Ang II administra-tion, whereas 4-week Ang II–treated Tgfb1+/+Rag1–/– mice had a significant increase in myocyte cross-sec-tional area (P< 0.05; Figure 3b). These data are consis-tent with the echocardiographic and gravimetrical results and unequivocally demonstrate an in vivo role of TGF-β1 in the hypertrophic growth response of the heart. The longitudinal dimension of the cardiomy-ocytes were similar for saline- and Ang II–treated
Tgfb1+/+Rag1–/–and Tgfb1–/–Rag1–/–mice (155 ± 4 µm for saline-treated wild-type, 165 ± 21 µm for saline-treated knockout, 135 ± 16 µm for Ang II–treated wild-type, and 132 ± 16 µm for Ang II–treated knockout mice),
which indicates that the mice were not subjected to a volume overload from the treatment protocols.
Histological analysis via Masson’s trichrome stain revealed only mild perivascular fibrosis in both
Tgfb1+/+Rag1–/–and Tgfb1–/–Rag1–/–mice following 4 weeks of saline or subpressor Ang II dose (Figure 4a). Digital images (×25) of the entire left ventricle from saline- and Ang II–treated Tgfb1+/+Rag1–/–and Tgfb1–/–Rag1–/–mice were obtained using NIH Scion Image (version 1.62a). A 20 ×20 grid was superimposed over each image, and the number of points overlaying the Masson’s Trichrome blue–stained interstitial fibrosis was counted. The per-centage of cardiac fibrosis was determined as fibrosis points/left ventricle total points. There was no signifi-cant increase in the percentage of cardiac fibrosis in Ang II–treated Tgfb1+/+Rag1–/–and Tgfb1–/–Rag1–/–mice compared with saline-treated mice (Figure 4b).
[image:7.576.59.289.53.342.2]To confirm that changes in LV mass were the result of cardiomyocyte hypertrophy, 4-week saline- and Ang II– Figure 3
(a) Representative images of hearts from 4-week saline- and Ang II– treated Tgfb1+/+Rag1–/–and Tgfb1–/–Rag1–/–mice. Four-week Ang II–
treated Tgfb1+/+Rag1–/–heart depicting an increase in cardiomyocyte
size. ×500.Scale bar, 20 µm. (b) Cardiomyocyte cross-sectional area of 4-week Ang II–treated Tgfb1+/+Rag1–/–mice was significantly increased
compared with saline-treated Tgfb1+/+Rag1–/–and saline- or Ang
II–treat-ed Tgfb1–/–Rag1–/–mice. Each column represents approximately 100
myocytes from each of four to five hearts per group. *P< 0.05 vs. 4-week saline. #P< 0.05 vs. Tgfb1+/+Rag1–/–4-week Ang II.
Figure 4
(a) Representative images of fibrotic lesions (black arrows) from 4-week saline- and Ang II–treated Tgfb1+/+Rag1–/–and Tgfb1–/–Rag1–/–
mice. ×25. (b) Percentage of cardiac fibrosis in 4-week saline- and Ang II–treated Tgfb1+/+Rag1–/–and Tgfb1–/–Rag1–/–mice. Each column
[image:7.576.311.537.413.732.2]treated Tgfb1+/+Rag1–/– and Tgfb1–/–Rag1–/– mice were injected with bromodeoxyuridine (BrdU) to observe any mitotic growth of the heart. No BrdU incorporation was detected in LV myocytes and nonmyocytes of saline- or Ang II–treated Tgfb1+/+Rag1–/–and Tgfb1–/–Rag1–/–mice (data not shown). Proliferating colonic epithelium taken as positive control from the same mice showed high lev-els of BrdU incorporation as expected (data not shown). Since targeted disruption of the Tgfb1 gene resulted in an autoimmune-like disorder, causing multiorgan inflammation and postnatal death by the age of 15–36 days (5, 6, 46, 47), TGF-β1–deficient mice were bred on an immune-compromised, RAG1–deficient back-ground. These mice are still susceptible to infection. Therefore, to ensure that changes in LV mass were not due to mixed inflammatory cell infiltration into the heart, immunohistochemical detection of macrophages and neutrophils was performed. No macrophages or neutrophils were detected in the hearts of 4-week saline-and Ang II–treated Tgfb1+/+Rag1–/–and Tgfb1–/–Rag1–/– mice (data not shown). These results demonstrate that it was not fibrosis, cellular hyperplasia, or cytokine infil-tration, but rather hypertrophy that was the cause of the LV mass increase in Tgfb1+/+Rag1–/–mice.
The known biological actions of angiotensin II include vasoconstriction, triggering the thirst center in the brain and stimulation of aldosterone release from the adrenal glands (48–50). Subpressor doses of Ang II were used in the present study to examine the hypertrophic effects of TGF-β1 independent of a hemodynamic load. Therefore, to confirm that the cardiac remodeling response to Ang II administration was not the result of a pressure or volume overload, blood pressure, daily water intake, and urine aldosterone and Na+levels were measured. Systemic
blood pressure (Tgfb1+/+Rag1–/– pretreatment 85 ± 7 mmHg vs. 4-week saline 80 ± 8 mmHg vs. 4-week Ang II 78 ± 5 mmHg) and daily water intake (Tgfb1+/+Rag1–/– pre-treatment 5.1 ± 0.6 ml/day vs. 4-week saline 6.4 ± 0.9 ml/day vs. 4-week Ang II 5.8 ± 0.8 ml/day; Tgfb1–/–Rag1–/– pretreatment 5.8 ± 1.0 ml/day vs. 4-week saline 5.9 ± 1.4 ml/day vs. 4-week Ang II 4.7 ± 0.8 ml/day) were not dif-ferent before treatment or in saline- and Ang II–treated mice. The amount of Na+absorption versus excretion is a measure of aldosterone activity and indicates a stimu-lated renin-angiotensin system (51, 52). Urinary Na+ lev-els (Tgfb1+/+Rag1–/–pretreatment 0.12 ± 0.04 mmol/day vs. 4-week saline 0.10 ± 0.02 mmol/day vs. 4-week Ang II 0.13 ± 0.07 mmol/day; Tgfb1–/–Rag1–/– pretreatment 0.10 ± 0.03 mmol/day vs. 4-week saline 0.08 ± 0.03 mmol/day vs. 4-week Ang II 0.05 ± 0.02 mmol/day) as well as K+levels (unpublished data) were similar between
Tgfb1+/+Rag1–/–and between Tgfb1–/–Rag1–/–mice before and after saline or Ang II treatment, indicating that endogenous RAS was not activated by 4-week subpressor Ang II administration. Urine aldosterone levels were also measured. There was no significant difference in aldosterone levels between saline- and Ang II– treated Tgfb1+/+Rag1–/– mice (0.005 ± 0.001 µg/day vs. 0.009 ± 0.003 µg/day, respectively), demonstrating that the dose of Ang II used did not stimulate a significant release of aldosterone. Following 4-week saline treatment, urine aldosterone was markedly increased in Tgfb1–/–Rag1–/– mice compared with Ang II– treated Tgfb1–/–Rag1–/–mice (0.007 ± 0.001 µg/day vs. 0.004 ± 0.001 µg/day, respectively; P< 0.05). Nonetheless, these electrolyte and aldosterone data along with the blood pressure and water intake measurements indicate that the endogenous RAS was not activated at this dose of Ang II and suggest that neither a pressure overload or volume overload has occurred in this model.
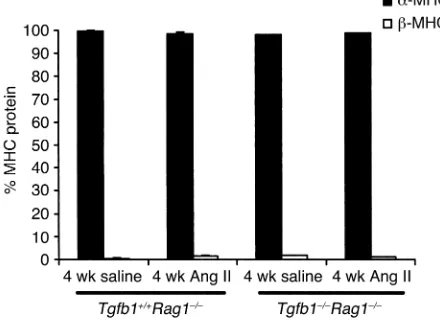
Re-expression of fetal isoforms of myofibrillar pro-tein genes, including that for β-MHC, has been used as a biomarker for cardiac hypertrophy. Growth factors such as TGF-β1 have been demonstrated to stimulate this recapitulation of fetal cardiac genes (25, 31). There
was 97–99% α-MHC and 1–3% β-MHC protein in
4-week saline-treated Tgfb1+/+Rag1–/–and Tgfb1–/–Rag1–/– mice (Figure 5). Following 4 weeks of Ang II treatment,
Tgfb1+/+Rag1–/–mice, which had cardiac hypertrophy, and Tgfb1–/–Rag1–/–mice, which had not undergone a hypertrophic growth response, had similar α- and β-MHC protein levels as saline-treated mice (Figure 5), indicating that changes in the protein isoforms of MHC are not coupled to hypertrophy or TGF-β1.
[image:8.576.58.278.60.221.2]Induction of the atrial natriuretic factor (Anf) gene is a response that occurs during cardiac hypertrophy (see review, ref. 53) and may represent a molecular marker that differentiates between physiological and patholog-ical hypertrophy (54, 55). Anf expression increased approximately sixfold (P< 0.05, n= 5) following Ang II treatment in Tgfb1+/+Rag1–/–mice compared with saline-treated cohorts (n= 5). These changes in Anfexpression correlate with the induction of the hypertrophic Figure 5
Expression pattern of MHC protein levels in saline- and Ang II–treat-ed Tgfb1+/+Rag1–/–and Tgfb1–/–Rag1–/–mice. n= 5 for saline- and
Ang II–treated Tgfb1+/+Rag1–/–mice, and n= 4 for saline- and Ang
II–treated Tgfb1–/–Rag1–/– mice. Saline- and Ang II–treated
Tgfb1+/+Rag1–/–and Tgfb1–/–Rag1–/–mice have similar levels of α-MHC
(black bars) and β-MHC (white bars) protein. The cardiac hyper-trophy observed in 4-week Ang II–treated Tgfb1+/+Rag1–/–mice did not
response of the Tgfb1+/+Rag1–/–heart. There was a no-fold increase in Ang II–treated Tgfb1–/–Rag1–/–mice (n= 4) compared with their saline-treated cohorts (n= 4).
Discussion
This is the first direct evidence to our knowledge to demonstrate a functional role of TGF-β1 in the hyper-trophic response of the heart. Echocardiographic, gravimetric, and morphologic analyses clearly demon-strate that an absence of TGF-β1 results in no cardiac hypertrophy in response to Ang II treatment (Figure 1b, Figure 2, and Figure 3). The hypertrophic response occurs independent of the hemodynamic (pressure and volume load alterations) effects of Ang II, a potent hypertrophic stimulus, because blood pressure, thirst stimulation, and urine aldosterone and Na+levels were not increased compared with saline treatment. Inter-estingly, re-expression of β-MHC was not observed, suggesting that isoform switching occurs independ-ently of cardiac hypertrophy or TGF-β1. This is consis-tent with the findings of our cardiac hypertrophy study using FGF-2–deficient mice in which we demonstrated little hypertrophy in the absence of FGF-2 (26). In that study, high blood pressure was used to induce hyper-trophy, and an isoform switch occurred in the presence of pressure overload, independently of the presence or absence of hypertrophy or of FGF-2. In the present study, Anfmessage levels were elevated in Ang II–treat-ed wild-type mice relative to saline-treatII–treat-ed wild-type mice, but Anflevels were not elevated in Ang II–treated
Tgfb1–/–Rag1–/–mice relative to saline-treated knockout mice, indicating that increased Anfexpression corre-lates with the hypertrophic response of the heart and not with pressure or volume overload.
A number of studies have demonstrated that mRNA levels of Tgfb1are markedly increased upon pressure overload or pharmacological manipulation and corre-lated these mRNA changes to hypertrophic growth (16), fibrosis (23), and recapitulation of fetal cardiac myofib-rillar protein genes (25). TGF-β1 has been shown to be secreted from cultured cardiomyocytes and fibroblasts during cyclic stretch (56). In fact, TGF-β1 has been a can-didate mediator for the cardiac remodeling activities of Ang II (24, 29–33). Ang II stimulated cardiomyocyte hypertrophy by paracrine release of TGF-β1 from cardiac fibroblasts in a neonatal rat cell culture model (29). Ang II increased Tgfb1expression in cardiac fibroblasts that may act as an autocrine/paracrine stimulus for col-lagen formation (30) and may be mediated by the AT2 receptor (33). Everett and colleagues (32) showed that cardiac hypertrophy and increased gene expression of
Tgfb1and Anf were mediated by the AT1 receptor. Ang II, via AT1 receptor, caused hypertrophy of cardiomyocytes and hyperplasia of nonmyocytes in culture and induced the protein expression of ANF, α-skeletal actin, and TGF-β1 in cardiac myocytes (31). Conversely, TGF-β1 did not appear to be involved in the Ang II–induced hypertrophic response of cultured neonatal cardiomy-ocytes (57). Nonetheless, most in vitro and in vivo
stud-ies have only demonstrated a correlative relationship between cardiac hypertrophy and TGF-β1. Our present study demonstrates a direct effect and a primary, func-tional role of TGF-β1 in the growth response of the heart during pharmacological stress. Our results support the previously reported clinical correlations demonstrating TGF-β1’s role in cardiac hypertrophy (17, 18, 24).
One could argue that the absence of a hypertrophic response in Ang II–treated Tgfb1–/–Rag1–/–mice may be due to an altered load on the heart. However, as judged by the similar water intake and urinary electrolyte and aldosterone levels of Tgfb1+/+Rag1–/–vs. Tgfb1–/–Rag1–/– mice, it is unlikely that volume overload is a major fac-tor. It was observed that Ang II–treated Tgfb1–/–Rag1–/– mice had an unexplained decrease in blood pressure (BP), and no hypertrophic response resulted from Ang II treatment. However, there is recent evidence by Knowles and colleagues (58) that uncouples cardiac hypertrophy and BP. This group showed that mice defi-cient in the ANF receptor A have cardiac hypertrophy under normal conditions and that chronic antihyper-tensive treatment (from 20 days to 4 months of age) to lower BP, below that of normal levels of wild-type mice, did not reduce their cardiac hypertrophy. Furthermore, this group coarcted these mice to generate pressure overload, which resulted in an enhanced hypertrophic response. They determined that the total cardiac load between wild-type and knockout mice was similar, but for any pressure load the knockout mice had an increased hypertrophic response, indicating that this effect is not simply a function of BP. This suggests that in our study it is the absence of TGF-β1 and not low BP that results in no hypertrophy.
Although we have shown that TGF-β1 is involved in cardiomyocyte hypertrophy during Ang II treatment, we did not detect any significant difference in the level of fibrotic lesions in Tgfb1+/+Rag1–/–vs. Tgfb1–/–Rag1–/– mice (Figure 4). Omura and group (59) demonstrated that alterations in levels of Tgfb1mRNA did not corre-late with the increased mRNA expression of fibronectin and collagen I and III during low-dose isoprenaline, suggesting that cardiac fibrosis is probably not medi-ated by TGF-β1. Also, Boivin and colleagues (46) observed significant levels of perivascular and multifo-cal fibrosis in the hearts and livers of immunocompe-tent TGF-β1–deficient mice that have an autoimmune inflammatory disorder, suggesting that fibrotic lesions in those mice are a response to inflammation and not dependent upon the presence of TGF-β1. Recently, Nakajima and group (60) generated transgenic mice with elevated levels of activated TGF-β1 in the heart. This group observed overt fibrosis only in the atria and an inhibition of ventricular fibroblast DNA synthesis, suggesting that TGF-β1 activity is insufficient to pro-mote ventricular fibrosis (60).
implicated in regulating the expression of fetal car-diac genes as seen with pressure overload hypertro-phy (25, 65–67). However, there is a small but grow-ing body of evidence that cardiac hypertrophy can be dissociated from the re-expression of embryonic iso-forms of myofibrillar protein genes (26, 54, 68–72). Previously, we clearly demonstrated using FGF-2– deficient mice that the degree of hypertrophy did not influence the isoform switch of MhcmRNA and pro-tein since these mice had much less cardiac hyper-trophy, yet the isoform switch from α- to β-MHC protein still occurred normally following pressure overload (26). In the present study, there was no iso-form switch in MHC isoiso-forms in saline- or subpres-sor Ang II–treated Tgfb1+/+Rag1–/–and Tgfb1–/–Rag1–/– mice, although Tgfb1+/+Rag1–/–mice had a significant degree of cardiac hypertrophy (Figure 5). These data indicate that the MHC isoform switch occurs inde-pendently of the degree of hypertrophy, which is con-sistent with the notion that it is the burden of load that triggers the isoform switch (Figure 5). Others (69, 73) have also shown that the MHC isoform switch is dependent on pressure overload. Finally, using subpressor and pressor doses of Ang II, Susic and colleagues (69) demonstrated that an Ang II–induced increase in LV mass was not the result of pressure overload, whereas the isoform switch in LV
MhcmRNA was.
Anfexpression levels were also determined in the pres-ent study and showed that Ang II–treated Tgfb1+/+Rag1–/– mice, which were hypertrophic, had approximately a six-fold increase in cardiac Anfexpression compared with saline-treated cohorts. However, a no-fold increase occurred in Ang II–treated Tgfb1–/–Rag1–/–mice compared with their saline-treated cohorts. Anfexpression has been shown to be elevated in forms of pathological cardiac hypertrophy, but not physiological hypertrophy (54, 55) and is used as a sensitive biomarker for the induction of the hypertrophic phenotype (see review, ref. 53).
In summary, our results demonstrate, we believe for the first time, an in vivo,functional role and direct effect of TGF-β1 in Ang II–induced cardiac hypertrophy. This effect is independent of an endogenously activated RAS or hemodynamic load. Surprisingly, the absence of TGF-β1 did not alter the level of fibrosis in this model. The α- to β-MHC isoform switch was dissociated from the hypertrophic growth of the heart, suggesting that mechanisms such as pressure overload, rather than car-diac hypertrophy, induce the re-expression of the fetal cardiac gene profile. Overall, our findings may provide a better understanding of the mechanism(s) of cardiac remodeling and new insight into the development of novel therapeutic strategies in cardiac hypertrophy.
Acknowledgments
This work was supported by grants from the NIH (HL-41496, HL-58511, HD-26470). The investigators acknowledge D. Puthoff for assistance with echocar-diographic data; I.E. Ormsby for her excellent animal
husbandry work; J.N. Lorenz for the use of blood pres-sure and flame photometry equipment; G.P. Boivin for pathological reports and for assistance with using the morphometric NIH imaging system; K. Hepner-Goss for assistance with using the fluorescence imaging sys-tem; Z. Spicer and D. Millhorn for expert scientific knowledge and technical assistance with the real-time PCR methodology, and R. Banks for critical review of the urinary aldosterone and Na+data and manuscript.
1. Massague, J. 1990. The transforming growth factor-beta family. Annu. Rev. Cell Biol. 6:597–641.
2. Brand, T., and Schneider, M.D. 1995. The TGF beta superfamily in myocardium: ligands, receptors, transduction, and function. J. Mol. Cell Cardiol. 27:5–18.
3. Kallapur, S., Ormsby, I., and Doetschman, T. 1999. Strain dependency of TGFbeta1 function during embryogenesis.Mol. Reprod. Dev.52:341–349. 4. Dickson, M.C., et al. 1995. Defective haematopoiesis and vasculogenesis in transforming growth factor-beta 1 knock out mice. Development.
121:1845–1854.
5. Shull, M.M., et al. 1992. Targeted disruption of the mouse transforming growth factor-beta 1 gene results in multifocal inflammatory disease.
Nature. 359:693–699.
6. Kulkarni, A.B., et al. 1993. Transforming growth factor beta 1 null muta-tion in mice causes excessive inflammatory response and early death.
Proc. Natl. Acad. Sci. USA. 90:770–774.
7. Diebold, R.J., et al. 1995. Early-onset multifocal inflammation in the transforming growth factor beta 1-null mouse is lymphocyte mediated.
Proc. Natl. Acad. Sci. USA. 92:12215–12229.
8. D’Souza, R.N., and Litz, M. 1995. Analysis of tooth development in mice bearing a TGF-beta 1 null mutation. Connect. Tissue Res. 32:41–46. 9. Glick, A.B., et al. 1996. Transforming growth factor beta 1 suppresses
genomic instability independent of a G1 arrest, p53, and Rb. Cancer Res.
56:3645–3650.
10. Hoying, J.B., et al. 1999. Transforming growth factor beta1 enhances platelet aggregation through a non-transcriptional effect on the fib-rinogen receptor. J. Biol. Chem.274:31008–31013.
11. Tang, B., et al. 1998. Transforming growth factor-beta1 is a new form of tumor suppressor with true haploid insufficiency.Nat. Med. 4:802–807. 12. Glick, A.B., et al. 1994. Targeted deletion of the TGF-beta 1 gene causes rapid progression to squamous cell carcinoma. Genes Dev.8:2429–2440. 13. Engle, S.J., et al. 1999. Transforming growth factor beta1 suppresses nonmetastatic colon cancer at an early stage of tumorigenesis. Cancer Res. 59:3379–3386.
14. Thompson, N.L., et al. 1988. Transforming growth factor beta-1 in acute myocardial infarction in rats. Growth Factors.1:91–99.
15. Eghbali, M. 1989. Cellular origin and distribution of transforming growth factor-beta in the normal rat myocardium. Cell Tissue Res.256:553–558. 16. Takahashi, N., et al. 1994. Hypertrophic stimuli induce transforming growth factor-beta 1 expression in rat ventricular myocytes. J. Clin. Invest.
94:1470–1476.
17. Li, R.K., et al. 1997. Overexpression of transforming growth factor-beta1 and insulin-like growth factor-I in patients with idiopathic hypertrophic cardiomyopathy. Circulation. 96:874–881.
18. Li, G., et al. 1998. Elevated insulin-like growth factor-I and transforming growth factor- beta 1 and their receptors in patients with idiopathic hypertrophic obstructive cardiomyopathy. A possible mechanism. Cir-culation. 98(Suppl. 19):II144–II149.
19. Millan, F.A., Denhez, F., Kondaiah, P., and Akhurst, R.J. 1991. Embry-onic gene expression patterns of TGF beta 1, beta 2 and beta 3 suggest different developmental functions in vivo. Development. 111:131–143. 20. Pelton, R.W., Saxena, B., Jones, M., Moses, H.L., and Gold, L.I. 1991. Immunohistochemical localization of TGF beta 1, TGF beta 2, and TGF beta 3 in the mouse embryo: expression patterns suggest multiple roles during embryonic development. J. Cell Biol.115:1091–1105.
21. MacLellan, W.R., Brand, T., and Schneider, M.D. 1993. Transforming growth factor-beta in cardiac ontogeny and adaptation. Circ. Res.
73:783–791.
22. Eghbali, M., Tomek, R., Sukhatme, V.P., Woods, C., and Bhambi, B. 1991. Differential effects of transforming growth factor-beta 1 and phorbol myristate acetate on cardiac fibroblasts. Regulation of fibrillar collagen mRNAs and expression of early transcription factors. Circ. Res.69:483–490. 23. Villarreal, F.J., and Dillmann, W.H. 1992. Cardiac hypertrophy-induced changes in mRNA levels for TGF-beta 1, fibronectin, and collagen. Am. J. Physiol.262:H1861–H1866.
25. Parker, T.G., Packer, S.E., and Schneider, M.D. 1990. Peptide growth fac-tors can provoke “fetal” contractile protein gene expression in rat car-diac myocytes. J. Clin. Invest.85:507–514.
26. Schultz, J.E., et al. 1999. Fibroblast growth factor-2 mediates pressure-induced hypertrophic response. J. Clin. Invest.104:709–719.
27. Tiret, L., et al. 2000. Lack of association between polymorphisms of eight candidate genes and idiopathic dilated cardiomyopathy: the CARDI-GENE study. J. Am. Coll. Cardiol. 35:29–35.
28. Patel, R., et al. 2000. Variants of trophic factors and expression of cardiac hypertrophy in patients with hypertrophic cardiomyopathy. J. Mol. Cell. Cardiol. 32:2369–2377.
29. Gray, M.O., Long, C.S., Kalinyak, J.E., Li, H.T., and Karliner, J.S. 1998. Angiotensin II stimulates cardiac myocyte hypertrophy via paracrine release of TGF-beta 1 and endothelin-1 from fibroblasts. Cardiovasc. Res.
40:352–363.
30. Lee, A.A., Dillmann, W.H., McCulloch, A.D., and Villarreal, F.J. 1995. Angiotensin II stimulates the autocrine production of transforming growth factor-beta 1 in adult rat cardiac fibroblasts.J. Mol. Cell Cardiol.
27:2347–2357.
31. Sadoshima, J., and Izumo, S. 1993. Molecular characterization of angiotensin II-induced hypertrophy of cardiac myocytes and hyperpla-sia of cardiac fibroblasts. Critical role of the AT1 receptor subtype. Circ. Res. 73:413–423.
32. Everett, A.D., Tufro-McReddie, A., Fisher, A., and Gomez, R.A. 1994. Angiotensin receptor regulates cardiac hypertrophy and transforming growth factor-beta 1 expression. Hypertension. 23:587–592.
33. Ichihara, S., et al. 2001. Angiotensin II type 2 receptor is essential for left ventricular hypertrophy and cardiac fibrosis in chronic angiotensin II-induced hypertension. Circulation. 104:346–351.
34. Schatz, D.G., Oettinger, M.A., and Baltimore, D. 1989. The V(D)J recom-bination activating gene, RAG-1. Cell. 59:1035–1048.
35. Harada, K., et al. 1998. Pressure overload induces cardiac hypertrophy in angiotensin II type 1A receptor knockout mice. Circulation. 97:1952–1959. 36. Williams, R.V., et al. 1998. End-systolic stress-velocity and pressure-dimension relationships by transthoracic echocardiography in mice. Am. J. Physiol. 274:H1828–H1835.
37. Sahn, D.J., DeMaria, A., Kisslo, J., and Weyman, A. 1978. Recommenda-tions regarding quantitation in M-mode echocardiography: results of a survey of echocardiographic measurements. Circulation. 58:1072–1083. 38. Thoss, K., and Roth, J. 1977. The use of fluorescein isothiocyanate labeled lectins for immuno-histological demonstration of saccharides. III. Studies by use of Ricinus communislectin and wheat germ agglutinin.
Exp. Pathol. (Jena). 14:215–219.
39. D’Angelo, D.D., et al. 1997. Transgenic Galphaq overexpression induces cardiac contractile failure in mice.Proc. Natl. Acad. Sci. USA. 94:8121–8126. 40. Seta, K.A., Kim, R., Kim, H.W., Millhorn, D.E., and Beitner-Johnson, D. 2001. Hypoxia-induced regulation of MAPK phosphatase-1 as identified by subtractive suppression hybridization and cDNA microarray analy-sis.J. Biol. Chem. 276:44405–44412.
41. Reiser, P.J., and Kline, W.O. 1998. Electrophoretic separation and quan-titation of cardiac myosin heavy chain isoforms in eight mammalian species. Am. J. Physiol.274:H1048–H1053.
42. Rogers, W.J., et al. 1975. Comparison of indices of muscle and pump per-formance in patients with coronary artery disease. Cathet. Cardiovasc. Diagn. 1:17–34.
43. Osher, J., et al. 1976. Methylprednisolone treatment in acute myocardial infarction. Effect on regional and global myocardial function. Am. J. Car-diol.37:564–571.
44. Wood, M.A., Ellenbogen, K.A., Kapadia, K., Lu, B., and Valenta, H. 1990. Comparison of right ventricular impedance, pulse pressure and maximal dP/dt for determination of hemodynamic stability of ventricular arrhyth-mias associated with coronary artery disease. Am. J. Cardiol. 66:575–582. 45. Bolognesi, R., et al. 2001. Detection of early abnormalities of left ven-tricular function by hemodynamic, echo-tissue Doppler imaging, and mitral Doppler flow techniques in patients with coronary artery disease and normal ejection fraction. J. Am. Soc. Echocardiogr.14:764–772. 46. Boivin, G.P., et al. 1995. Onset and progression of pathological lesions in
transforming growth factor-beta 1-deficient mice.Am. J. Pathol.146:276–288. 47. Kulkarni, A.B., et al. 1995. Transforming growth factor-beta 1 null mice. An animal model for inflammatory disorders. Am. J. Pathol. 146:264–275.
48. Brody, M.J. 1981. New developments in our knowledge of blood pressure regulation. Fed. Proc. 40:2257–2261.
49. Reid, I.A. 1984. Actions of angiotensin II on the brain: mechanisms and physiologic role. Am. J. Physiol. 246:F533–F543.
50. Yang, G., Wan, Y., and Zhu, Y. 1996. Angiotensin II—an important stress hormone. Biol. Signals.5:1–8.
51. Chan, J.C. 1979. Control of aldosterone secretion. Nephron. 23:79–83. 52. Garty, H. 2000. Regulation of the epithelial Na+ channel by aldosterone:
open questions and emerging answers.Kidney Int. 57:1270–1276. 53. Silberbach, M., and Roberts, C.T., Jr. 2001. Natriuretic peptide signalling:
molecular and cellular pathways to growth regulation. Cell Signal.
13:221–231.
54. Buttrick, P.M., Kaplan, M., Leinwand, L.A., and Scheuer, J. 1994. Alter-ations in gene expression in the rat heart after chronic pathological and physiological loads. J. Mol. Cell Cardiol. 26:61–67.
55. Calderone, A., Murphy, R.J., Lavoie, J., Colombo, F., and Beliveau, L. 2001. TGF-beta(1) and prepro-ANP mRNAs are differentially regulated in exercise-induced cardiac hypertrophy. J. Appl. Physiol.91:771–776. 56. Ruwhof, C., van Wamel, A.E., Egas, J.M., and van der Laarse, A. 2000.
Cyclic stretch induces the release of growth promoting factors from cul-tured neonatal cardiomyocytes and cardiac fibroblasts. Mol. Cell Biochem.
208:89–98.
57. Kim, N.N., Villarreal, F.J., Printz, M.P., Lee, A.A., and Dillmann, W.H. 1995. Trophic effects of angiotensin II on neonatal rat cardiac myocytes are mediated by cardiac fibroblasts. Am. J. Physiol. 269:E426–E437. 58. Knowles, J.W., et al. 2001. Pressure-independent enhancement of cardiac
hypertrophy in natriuretic peptide receptor A-deficient mice. J. Clin. Invest. 107:975–984.
59. Omura, T., Kim, S., Takeuchi, K., Iwao, H., and Takeda, T. 1994. Trans-forming growth factor beta 1 and extracellular matrix gene expression in isoprenaline induced cardiac hypertrophy: effects of inhibition of the renin-angiotensin system.Cardiovasc. Res. 28:1835–1842.
60. Nakajima, H., et al. 2000. Atrial but not ventricular fibrosis in mice expressing a mutant transforming growth factor-beta(1) transgene in the heart.Circ. Res. 86:571–579.
61. Lompre, A.M., et al. 1979. Myosin isoenzyme redistribution in chronic heart overload. Nature. 282:105–107.
62. Mercadier, J.J., et al. 1981. Myosin isoenzyme changes in several models of rat cardiac hypertrophy. Circ. Res. 49:525–532.
63. Tsuchimochi, H., et al. 1984. Isozymic changes in myosin of human atri-al myocardium induced by overload. Immunohistochemicatri-al study using monoclonal antibodies. J. Clin. Invest. 74:662–665.
64. Lompre, A.M., Mercadier, J.J., and Schwartz, K. 1991. Changes in gene expression during cardiac growth. Int. Rev. Cytol. 124:137–186. 65. Schneider, M.D., and Parker, T.G. 1990. Cardiac myocytes as targets for
the action of peptide growth factors. Circulation. 81:1443–1456. 66. Parker, T.G., and Schneider, M.D. 1991. Growth factors,
proto-onco-genes, and plasticity of the cardiac phenotype. Annu. Rev. Physiol.
53:179–200.
67. Parker, T.G., Chow, K.L., Schwartz, R.J., and Schneider, M.D. 1991. TGF-beta 1 and fibroblast growth factors selectively up-regulate tissue-spe-cific fetal genes in cardiac muscle cells. Ciba Found. Symp.157:152–160. 68. Mercadier, J.J., et al. 1983. Myosin isoenzymes in normal and
hypertro-phied human ventricular myocardium. Circ. Res. 53:52–62.
69. Susic, D., Nunez, E., Frohlich, E.D., and Prakash, O. 1996. Angiotensin II increases left ventricular mass without affecting myosin isoform mRNAs. Hypertension. 28:265–268.
70. Bauer, E.P., Kuki, S., Zimmermann, R., and Schaper, W. 1998. Upregu-lated and downreguUpregu-lated transcription of myocardial genes after pul-monary artery banding in pigs.Ann. Thorac. Surg. 66:527–531. 71. Vikstrom, K.L., Bohlmeyer, T., Factor, S.M., and Leinwand, L.A. 1998.
Hypertrophy, pathology, and molecular markers of cardiac pathogene-sis.Circ. Res.82:773–778.
72. Sadoshima, J., and Izumo, S. 1995. Rapamycin selectively inhibits angiotensin II-induced increase in protein synthesis in cardiac myocytes in vitro. Potential role of 70-kD S6 kinase in angiotensin II-induced car-diac hypertrophy. Circ. Res.77:1040–1052.