endothelium of critically ill patients
Lies Langouche, … , Troels K. Hansen, Greet Van den
Berghe
J Clin Invest.
2005;115(8):2277-2286. https://doi.org/10.1172/JCI25385.
The vascular endothelium controls vasomotor tone and microvascular flow and regulates
trafficking of nutrients and biologically active molecules. When endothelial activation is
excessive, compromised microcirculation and subsequent cellular hypoxia contribute to the
risk of organ failure. We hypothesized that strict blood glucose control with insulin during
critical illness protects the endothelium, mediating prevention of organ failure and death. In
this preplanned subanalysis of a large, randomized controlled study, intensive insulin
therapy lowered circulating levels of ICAM-1 and tended to reduce E-selectin levels in
patients with prolonged critical illness, which reflects reduced endothelial activation. This
effect was not brought about by altered levels of endothelial stimuli, such as cytokines or
VEGF, or by upregulation of eNOS. In contrast, prevention of hyperglycemia by intensive
insulin therapy suppressed iNOS gene expression in postmortem liver and skeletal muscle,
possibly in part via reduced NF-
k
B activation, and lowered the elevated circulating NO
levels in both survivors and nonsurvivors. These effects on the endothelium statistically
explained a significant part of the improved patient outcome with intensive insulin therapy.
In conclusion, maintaining normoglycemia with intensive insulin therapy during critical
illness protects the endothelium, likely in part via inhibition of excessive iNOS-induced NO
release, and thereby contributes to prevention of organ failure and death.
Research Article
Endocrinology
Find the latest version:
Research article
Intensive insulin therapy protects the
endothelium of critically ill patients
Lies Langouche,1 Ilse Vanhorebeek,1 Dirk Vlasselaers,1 Sarah Vander Perre,1 Pieter J. Wouters,1
Kristin Skogstrand,2 Troels K. Hansen,3 and Greet Van den Berghe1
1Department of Intensive Care Medicine, Katholieke Universiteit Leuven, Leuven, Belgium. 2Department of Clinical Biochemistry, Statens Serum Institut,
Copenhagen, Denmark. 3Immunoendocrine Research Unit, Medical Department M, Aarhus University Hospital, Aarhus, Denmark.
The vascular endothelium controls vasomotor tone and microvascular flow and regulates trafficking of
nutri-ents and biologically active molecules. When endothelial activation is excessive, compromised
microcircula-tion and subsequent cellular hypoxia contribute to the risk of organ failure. We hypothesized that strict blood
glucose control with insulin during critical illness protects the endothelium, mediating prevention of organ
failure and death. In this preplanned subanalysis of a large, randomized controlled study, intensive insulin
therapy lowered circulating levels of ICAM-1 and tended to reduce E-selectin levels in patients with prolonged
critical illness, which reflects reduced endothelial activation. This effect was not brought about by altered
lev-els of endothelial stimuli, such as cytokines or VEGF, or by upregulation of eNOS. In contrast, prevention of
hyperglycemia by intensive insulin therapy suppressed iNOS gene expression in postmortem liver and skeletal
muscle, possibly in part via reduced NF-
κ
B activation, and lowered the elevated circulating NO levels in both
survivors and nonsurvivors. These effects on the endothelium statistically explained a significant part of the
improved patient outcome with intensive insulin therapy. In conclusion, maintaining normoglycemia with
intensive insulin therapy during critical illness protects the endothelium, likely in part via inhibition of
exces-sive iNOS-induced NO release, and thereby contributes to prevention of organ failure and death.
Introduction
Critically ill patients requiring intensive care for more than a few days have a high risk of death (1). Most intensive care deaths beyond the first few days of critical illness are attributable to nonresolving organ failure, either due to or coinciding with sepsis. An increased susceptibility to infections and the sequelae of an excessive systemic inflammatory response to infection and injury play a role.
The vascular endothelium controls vasomotor tone and micro-vascular flow and regulates trafficking of nutrients and several biologically active molecules (2, 3). Local activation of the endo-thelium is crucial for infection control, but widespread systemic endothelial activation may lead to deleterious consequences (3, 4). In the process of endothelial cell activation, expression of adhesion molecules such as E- and P-selectin, ICAMs, and VCAMs on the cell surface is induced. These adhesion molecules activate leuko-cytes and increase rolling and strong adherence of leukocytes to the endothelium with subsequent migration into the underlying tissue (3). Endothelial production and shedding of adhesion mol-ecules is stimulated by proinflammatory cytokines and growth factors, such as VEGF, expressed and released by injured tissues. Release of reactive oxygen species and several proteases by acti-vated leukocytes further contributes to endothelial cell and tissue damage. Other consequences of endothelial activation and dam-age include increased microvascular permeability with capillary leakage and coagulopathy (2, 4). Obstruction of the microcircula-tory blood vessels, resulting from excessive leukocyte adhesion and
aggregation together with intravascular coagulation and throm-bosis, hampers perfusion, thus bringing about cellular hypoxia, which may lead to organ failure and death (2, 3).
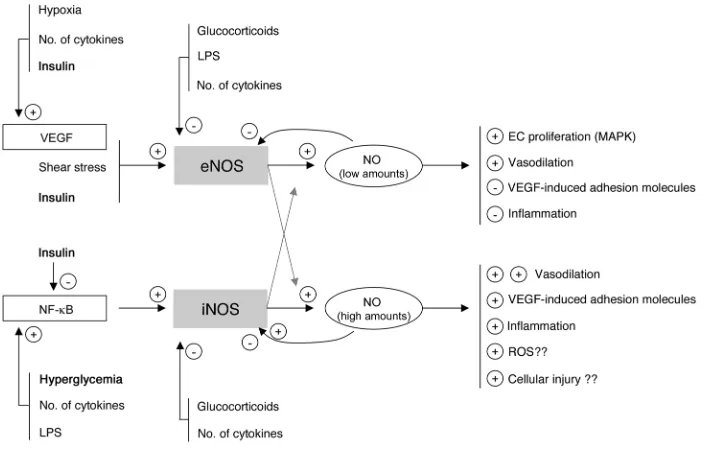
NO is pivotal in this process via its vasodilatory properties and through its control of the interaction between the endothelium and leukocytes. NO results from l-arginine oxidation by a family
of enzymes called NOS. There are 2 constitutive NOS isoforms, neuronal NOS (nNOS) and eNOS. nNOS was first described in brain, but other tissues, such as spinal cord and skeletal muscle, also express nNOS (5). Likewise, although eNOS is predominant-ly expressed in the endothelium, it is also detectable in other cell types, including hepatocytes and muscle cells (reviewed in refs. 6, 7). iNOS is an isoform that can be induced by several stimuli in virtually every cell type (reviewed in ref. 8). Low concentrations of NO, generated in basal circumstances by the constitutive enzyme eNOS, have been shown to exert antiadhesive and protective prop-erties, whereas high NO concentrations, generated predominantly by iNOS, are proinflammatory and may evoke organ damage in conditions of ischemia and reperfusion (9) (Figure 1).
In a recent large, randomized controlled study of surgical inten- sive care patients, we showed that the use of intensive insulin ther-apy to maintain strict normoglycemia reduced the risk of organ failure and death (10). The intervention beneficially affected innate immunity (11), exerted an antiinflammatory effect (12), improved the deranged lipid profile (13), and protected hepatocytic mito-chondrial ultrastructure and function (14). We here hypothesize that strict blood glucose control with insulin during critical illness also protects the endothelium, which in turn is likely to play a role in the observed prevention of organ failure and reduced mortal-ity. Since eNOS gene transcription and activity are known to be upregulated by insulin (6), and iNOS activation may be downregu-lated by insulin and through the prevention of hyperglycemia, we
hypothesized that such effects of insulin would mediate endothe-Nonstandard abbreviations used: CI, confidence interval; CRP, C-reactive protein; ICU, intensive care unit; IQR, interquartile range; nNOS, neuronal NOS; OR, odds ratio.
Conflict of interest: G. Van den Berghe holds an unrestrictive Katholieke Universiteit Leuven Novo Nordisk Chair of Research.
Citation for this article: J. Clin. Invest. 115:2277–2286 (2005). doi:10.1172/JCI25385.
lial protection (Figure 1). We tested this hypothesis by studying the effect of intensive insulin therapy on circulating levels of the adhesion molecules ICAM-1 and E-selectin and endothelial stimuli such as VEGF and cytokines; by quantifying tissue gene expression and protein levels of different members of the NOS family and involvement of NF-κ B activation as a possible regulatory mecha-nism; and by measuring circulating NO levels.
Results
Blood glucose control and clinical outcome . Table 1 shows the base-line characteristics of all patients with prolonged critical illness (intensive care unit [ICU] stay of at least 1 week) and Table 2 those of all nonsurvivors from whom biopsies were available, randomized for conventional
or intensive insulin therapy (see Methods for a description of patients and randomization).
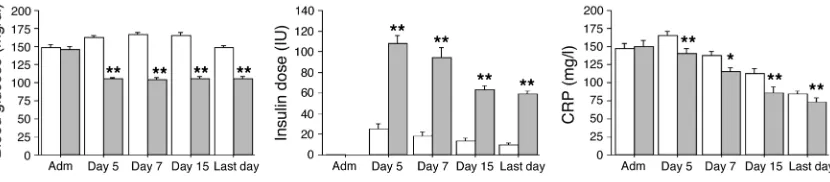
Blood glucose levels upon admission were comparable in both treatment groups. Accord-ing to the study protocol, mean morning blood glucose levels were significantly lower in the group receiving intensive insulin thera-py (normoglycemia) than in the group undergoing conventional treatment (Figure 2). In the former group, higher insulin doses were needed to achieve the targeted glu- cose levels (Figure 2). Glucose con-trol was maintained until the last study day. As in the whole study population (10), in this group of patients with prolonged critical illness, intensive insulin therapy significantly reduced mortality, the incidence of bacteremia, the risk of acute renal failure requiring
[image:3.585.42.399.83.308.2]dialysis or continuous veno-venous hemofiltration, the need for mechanical ventilation, and the length of stay in the ICU (Table 3). The need for glucocorticoid administration was similar in the 2 treatment groups. Of the patients with prolonged critical illness, 32% in the conventional and 36% in the intensive insulin therapy group received glucocorticoids at some time during intensive care (P = 0.3). Glucocorticoids were more often needed in nonsurvivors than survivors, a reflection of the severity of disease, but among the nonsurvivors, similar fractions of the conventional (53%) and intensive (56%) groups received glucocorticoid therapy (P = 0.8). All the effects of intensive insulin therapy described below were unaffected by glucocorticoid treatment or by the presence of bac-teremia (data not shown).
Figure 1
[image:3.585.193.533.524.706.2]Simplified concept and rationale of the study. Low concentrations of NO, nor-mally generated by eNOS, are likely to be beneficial for the endothelium and organ function, whereas high concentrations of NO, generated via iNOS induction, may contribute to endothelium dysfunction, excessive vasodilation, extravasation, and tissue injury. Insulin-titrated pre-vention of hyperglycemia during criti-cal illness may theoreticriti-cally protect the endothelium via its effects on eNOS and iNOS expression and activity.
Table 1
Baseline characteristics of patients with prolonged critical illness (ICU stay ≥1 week)
Conventional insulin Intensive insulin P therapy (n = 224) therapy (n = 181) Sex (no. [% male]) 150 (67) 125 (69) 0.7 Age (yr; mean ± SD) 61 ± 16 61 ± 15 0.9 BMI (mean ± SD) 25.7 ± 5.6 25.8 ± 4.7 0.8 Positive history of diabetes (no. [%]) 21 (9) 18 (10) 0.8 Positive history of malignancy (no. [%]) 50 (22) 42 (23) 0.8 Reason for admission or type of surgery (no.) 0.7
Complicated vascular 14 18
Complicated abdominal 31 26
Complicated cardiothoracic 103 75 Multiple trauma and cerebral injury 52 42 Solid organ transplant/hemato/other 24 20
APACHE II score (first 24 hours; median [IQR]) 12 (8–15) 11 (8–16) 0.9 TISS-28 score (first 24 hours; median [IQR]) 39 (33–45) 39 (35–45) 0.5 Blood glucose upon admission (mg/dl; mean ± SD) 148 ± 56 145 ± 52 0.6 Hyperglycemia (≥200 mg/dl) upon admission (no. [%]) 33 (15) 24 (13) 0.7
research article
The levels of the inflammatory marker C-reactive protein (CRP) were systematically evaluated during ICU stay (Figure 2). Com-pared with conventional therapy, intensive insulin therapy lowered serum CRP levels at all time points. The levels of CRP on day 7 were higher in nonsurvivors than in survivors.
Shedded adhesion molecules: serum ICAM-1 and E-selectin levels. Serum ICAM-1 and E-selectin levels upon ICU admission were comparable between patients in the conventional and intensive insulin treatment groups (Figure 3). Serum ICAM-1 levels were strongly increased on day 7 in both treatment groups, but this rise was a median 14% lower in the patients who received inten-sive insulin therapy compared with conventional insulin therapy (Figure 3; P = 0.009). In contrast to ICAM-1 levels, day 7 levels of E-selectin were not higher than the levels at admission (Figure 3). Nevertheless, E-selectin levels at day 7 tended to be lower (13% median reduction; P = 0.08) in intensive insulin–treated patients compared with those receiving conventional therapy.
Univariate analysis revealed that ICAM-1 and E-selectin levels were higher in nonsurvivors than in survivors (P < 0.0001 and
P = 0.01, respectively). Elevated levels of ICAM-I and E-selectin were also associated with the risk for developing acute renal failure (data not shown). A weak, albeit highly significant, correlation was observed between CRP and ICAM-1 levels (r = 0.326; P < 0.0001) and between CRP and E-selectin levels (r = 0.277; P < 0.0001).
Endothelial stimuli. Serum VEGF levels upon ICU admission were comparable between patients in the conventional and intensive insu-lin treatment groups [median, 427 pg/ml (interquartile range [IQR], 213–640 pg/ml) versus 320 pg/ml (IQR, 152–552 pg/ml), respectively;
P = 0.2]. Day 7 serum VEGF levels were a median 2-fold higher than the admission levels, irrespective of the insulin treatment (835 pg/ml [IQR, 471–1,336 pg/ml] in the con-ventional group and 786 pg/ml [468–1,216 pg/ml] in the intensive insulin group; P = 0.5]. VEGF levels were lower in nonsurvivors than in survivors (P = 0.04). Lower VEGF levels were also associated with the risk for developing acute renal fail-ure (data not shown).
Upon admission to ICU, patients in the conventional and intensive insulin therapy groups had equal serum levels of all studied cytokines (data not shown). As compared with conventional therapy, intensive insulin therapy only significantly lowered serum IL-10 concentrations on day 5 (45 pg/ml [IQR, 21–105 pg/ml] in the conventional group and 32 pg/ml [IQR, 13–73 pg/ml] in the intensive insulin group;
P = 0.01) and day 15 (60 pg/ml [IQR, 21–101 pg/ml] in the con-ventional group and 32 pg/ml [13–72 pg/ml] in the intensive insulin group; P = 0.007) and tended to lower serum IL-6 levels only on the last day of intensive care (62 pg/ml [IQR, 23–173 pg/ml] in the conventional group and 43 pg/ml [16–124 pg/ml] in the intensive insulin group; P = 0.07).
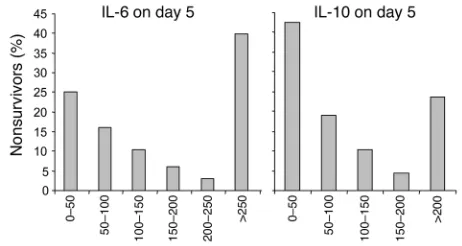
The cytokine profiles over time for all 405 patients together are shown in Table 4. Levels of several cytokines significantly increased with time in intensive care, whereas levels of others decreased. Univariate analysis revealed higher day 5 levels of IL-5 (P = 0.04) and IL-8 (P = 0.0003) in nonsurvivors than in survivors. Both very low and very high levels of IL-6 and IL-10 were associated with an increased risk of death (Figure 4).
[image:4.585.88.503.619.710.2]Serum IL-6 levels correlated positively with CRP levels on admis-sion day (r = 0.165; P =0.004), day 5 (r = 0.323; P < 0.0001), day 15 (r = 0.330; P < 0.0001), and on the last day of intensive care (r = 0.315; P < 0.0001). No clinically relevant correlation was found between levels of serum ICAM-1, E-selectin, and any of the studied cytokines (data not shown).
Table 2
Baseline characteristics of patients who died in the ICU
Conventional insulin Intensive insulin P
therapy (n = 49) therapy (n = 27)
Sex (no. [% male]) 32 (65) 20 (74) 0.4 Age (yr; mean ± SD) 69 ± 12 69 ± 13 >0.9 BMI (mean ± SD) 24.7 ± 3.2 26.3 ± 5.9 0.1 Positive history of diabetes (no. [%]) 4 (8) 1 (4) 0.5 Positive history of malignancy (no. [%]) 15 (31) 9 (33) 0.8 Reason for admission or type of surgery (no.) 0.4
Complicated vascular 1 2
Complicated abdominal 7 5
Complicated cardiothoracic 28 12 Multiple trauma and cerebral injury 8 7 Solid organ transplant-hemato-other 5 1
APACHE II score (first 24 hours; median [IQR]) 12 (10–19) 16 (10–18) 0.5 TISS-28 score (first 24 hours; median [IQR]) 41 (34–48) 39 (33–48) 0.5 Blood glucose upon admission (mg/dl; mean ± SD) 157 ± 75 159 ± 67 0.9 Hyperglycemia (≥200 mg/dl) upon admission (no. [%]) 7 (14) 6 (22) 0.4
Figure 2
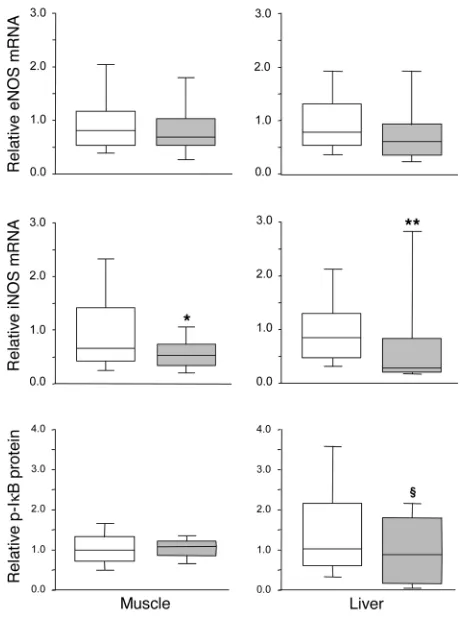
Tissue gene and protein expression of the NOS family. Hepatic (P = 0.4) and skeletal muscle (P = 0.1) eNOS mRNA levels were not signifi-cantly altered by insulin treatment (Figure 5). In liver, nNOS mRNA was undetectable; in skeletal muscle, nNOS gene expression was unaffected by intensive insulin therapy (median, 0.81 [IQR, 0.32– 1.42] in the intensive insulin group versus 0.40 [IQR, 0.15–1.10] in the conventional group; P = 0.2). In contrast, iNOS gene expression was a median 66% lower in liver (P = 0.01) and a median 21% lower in skeletal muscle (P = 0.04) of intensive insulin treated patients as compared with conventionally treated patients (Figure 5).
Intensive insulin therapy did not affect eNOS protein levels in liver (865 pg/mg [IQR, 778–1,096 pg/mg] protein in the intensive insulin group versus 935 pg/mg [IQR, 786–1,060 pg/mg] protein in the conventional group; P = 0.6) or skeletal muscle (144 pg/mg [IQR, 93–180 pg/mg] protein in the intensive insulin group ver-sus 127 pg/ml [IQR, 94–181 pg/mg] protein in the conventional group; P = 0.7). Unfortunately, attempts to quantify iNOS protein levels with either of 2 commercially available antibodies or by ELISA were not successful, due to lack of specificity.
There was no correlation between any of the measured cytokines and iNOS, eNOS, or nNOS gene expression. Also, CRP levels measured on the last day of intensive care did not correlate with NOS gene expression.
Intensive insulin therapy did not affect phosphorylated IκB levels in skeletal muscle but tended to lower phosphorylated IκB levels in liver (P = 0.1), which reflects a trend toward lower NF-κB activation (Figure 5).
Serum NO levels. Compared with those in control subjects, NO levels upon ICU admission were significantly increased in criti-cally ill patients (P = 0.002), to a similar extent for the conven-tional and intensive insulin treatment groups (Figure 6). In the conventional treatment group, NO levels remained equally high on day 7 (P = 0.5; Figure 6). In contrast, a significant decrease was seen for the patients in the intensive insulin therapy group between admission and day 7 (P = 0.02), which resulted in signifi-cantly lower levels in these patients versus conventionally treated patients (P = 0.04). This difference was due to a downward shift in the levels of the 2 upper quartiles (Figure 6).
Univariate analysis revealed that NO serum levels were higher in nonsurvivors than in survivors (P < 0.0001). Elevated NO serum levels were also associated with the risk for developing acute
renal failure (P < 0.0001; data not shown). A highly significant but weak correlation was found between day 7 NO quartiles and ICAM-1 (ρ = 0.248; P < 0.0001); NO and E-selectin (ρ = 0.192; P = 0.0001); and NO and CRP (ρ = 0.192; P = 0.0001).
Relative impact of the studied effects of intensive insulin therapy on improved survival from criti-cal illness. To weigh the impact of intensive insulin therapy on the levels of CRP, VEGF, adhesion molecules, cytokines, and NO on the outcome benefit of the intervention against blood glucose control, insulin dose, and preexisting risk factors, we performed multivariate logistic regression analysis with ICU mortality as endpoint. Before NO was entered into the model, the lowering of serum ICAM-1 (odds ratio [OR], 1.104 per 100 ng/l added; 95% confidence interval [CI], 1.017–1.199; P = 0.02) and E-selectin (OR, 1.050 per 5 ng/l added; 95% CI, 1.008–1.093; P = 0.02) levels explained at least part of the reduced mortality with intensive insulin therapy, independent of and corrected for severity of illness (APACHE II score; ref. 15, age, and the level of blood glucose control. Addition of NO to the model rendered the predictive effect of ICAM-1 (OR, 1.083 per 100 ng/l added; 95% CI, 0.996–1.178; P = 0.06) and E-selectin (OR, 1.041 per 5 ng/l added; 95% CI, 0.999–1.085; P = 0.05) levels only borderline significant. Levels of NO in the 2 upper quartiles accounted for this association with adverse outcome (50–75% quartile: OR, 6.335, 95% CI, 1.551–25.870, P = 0.01; 75–100% quartile: OR, 8.474, 95% CI, 2.001–35.891, P = 0.004). Similar results were obtained with multi-variate logistic regression analysis for developing acute renal failure as outcome parameter (data not shown).
Discussion
As compared with conventional therapy, intensive insulin therapy lowered circulating levels of ICAM-1 and E-selectin in patients with prolonged critical illness, which reflected reduced activation of the endothelium. Reduced endothelial activation with insulin
Table 3
Clinical outcome of patients with prolonged critical illness (ICU stay ≥1 week)
Conventional insulin Intensive insulin P therapy (n = 224) therapy (n = 181) Death in ICU (no. [%]) 47 (21) 21 (12) 0.01
Cause of death (no.) 0.7
Acute hemodynamic collapse 6 3 MOF with a proven septic focus 23 7
MOF with SIRS 16 10
Severe brain damage 2 1
Bacteremia (no. [%]) 59 (26) 31 (17) 0.03 Acute renal failure requiring CVVH (no. [%]) 58 (26) 30 (17) 0.02 Days on mechanical ventilation (median [IQR]) 13 (8–24) 11 (7–18) 0.03 Days in ICU (median [IQR]) 15 (11–28) 14 (9–24) 0.02
[image:5.585.304.531.533.669.2]MOF, multiple organ failure; SIRS, systemic inflammatory response syndrome; CVVH, continuous veno-venous hemofiltration for renal replacement therapy.
Figure 3
research article
therapy was not brought about by an effect on endothelial stimuli, such as VEGF or cytokines, nor by upregulation of eNOS, an unex-pected observation. In contrast, prevention of hyperglycemia by intensive insulin therapy suppressed iNOS gene expression and lowered circulating NO levels. These effects on the endothelium statistically explained a significant part of the improved patient outcome with intensive insulin therapy.
Intensive insulin therapy reduced the circulating levels of the adhesion molecules ICAM-1 and E-selectin in critically ill patients, independent of its effect on infection prevention. E-selectin is pro-duced selectively by endothelial cells and is rapidly inducible and, as such, reflects the state of the endothelium in disease. ICAM-1 is constitutively expressed at very low levels on the endothelium and is highly inducible upon cell activation. It is also expressed by fibroblasts and hematopoietic cells. Small changes in the expres-sion of the adhesion molecules at the endothelial cell level may go undetected in the circulation, but when differences in the amount of shedded adhesion molecules are found, this indicates a substan-tial change in activity status of the endothelium. The lowering of ICAM-1 and E-selectin levels with intensive insulin therapy par-tially explained the reduced risk of developing organ failure and of death with this intervention, as indicated by logistic regression analysis. The data thus suggest that endothelial protection with insulin therapy played a role in bringing about the prevention of organ damage and improved survival. Several studies have previ- ously underscored the importance of adhesion molecules and leu-kocyte-endothelium interactions in determining patient outcome. First, higher levels of circulating E-selectin and ICAM-1 are found in critically ill patients as compared with healthy individuals (4, 16–20). Furthermore, E-selectin and ICAM-1 levels further rise or remain persistently elevated in patients with multiple organ dysfunction and in nonsurvivors as compared with survivors (16, 17, 19, 21). Especially ICAM-1 appeared to independently predict subsequent development of multiple organ failure and/or death (17, 19, 20). Second, E-selectin levels have been found to correlate with hemodynamic instability (18, 22). Also, a correlation between release of adhesion molecules into the circulation and severity of
trauma has been reported (4). Third, animal studies on interven- tions with monoclonal antibodies to adhesion molecules demon-strated that inhibition of neutrophil adherence to endothelial cells significantly protects against reperfusion injury (23), acute lung injury, and death (24).
A potent trigger of endothelial cell activation and expression of adhesion molecules is VEGF. VEGF levels strongly increased with time in patients with prolonged critical illness. In contrast to the effect of glycemic control in patients with diabetes mellitus (25, 26) and of insulin infusion in fasting, obese, nondiabetic subjects (27), intensive insulin therapy did not attenuate the critical illness– induced rise in VEGF levels. This apparent discrepancy is likely explained by the fact that critical illness induces more pronounced insulin resistance than do type 2 diabetes and obesity. The rise of VEGF in the critically ill is not surprising, considering it is a key regulator of angiogenesis (28) involved in the repair of tissue injury (29, 30). Moreover, VEGF expression is potentiated by hypoxia (29). Strongly enhanced levels of VEGF have been previously reported in critically ill patients with diverging underlying diseases (31–33). Interestingly, administration of VEGF in experimental models of
Table 4
Serial measurements of cytokines in serum
Admission day Day 5 Day 15 Last day P
(n = 395; median [IQR]) (n = 404; median [IQR]) (n = 207; median [IQR]) (n = 404; median [IQR])
IL-1β (pg/ml) 9.0 (3.4–17.6) 10.1 (4.2–18.6) 13.2 (6.5–30.8) 13.1 (6.2–26.1) <0.0001 IL-2 (pg/ml) 4.0 (1.1–13.0) 4.3 (1.2–14.9) 5.5 (1.7–21.1) 6.6 (1.8–20.8) <0.0001 IL-4 (pg/ml) 6.6 (3.0–10.7) 6.5 (3.2–10.7) 6.9 (3.2–12.2) 7.1 (3.4–11.5) 0.2 IL-5 (pg/ml) 6.4 (3.1–14.1) 7.9 (3.6–15.3) 8.4 (4.0–17.8) 6.8 (2.8–14.8) 0.08 IL-6 (pg/ml) 193.5 (49.6–500.0) 77.3 (27.0–206.9) 73.1 (30.2–237.2) 51.6 (17.7–155.6) <0.0001 IL-8 (pg/ml) 70.6 (28.7–208.2) 61.6 (22.2–155.0) 85.4 (36.1–226.2) 74.0 (25.3–160.2) 0.1 IL-10 (pg/ml) 61.6 (29.8–137.1) 39.4 (16.4–89.6) 44.2 (15.7–82.8) 39.9 (13.8–87.7) <0.0001 IL-12 (pg/ml) 25.8 (6.2–92.8) 23.1 (7.2–101.7) 47.4 (15.3–303.8) 49.7 (11.1–217.0) <0.0001 TNF-α (pg/ml) 7.5 (2.4–21.3) 7.2 (2.5–22.3) 10.5 (4.3–36.2) 10.1 (3.8–29.2) 0.0005 TNF-β (ng/ml) 0.59 (0.21–2.09) 0.51 (0.17–1.88) 0.96 (0.41–3.30) 1.14 (0.41–4.49) <0.0001 RANTES (ng/ml) 20.9 (7.6–55.5) 22.2 (7.3–59.0) 48.4 (15.0–91.1) 36.9 (13.3–81.1) <0.0001 BDNF (ng/ml) 5.1 (3.1–8.0) 4.8 (3.0–7.7) 7.0 (4.1–10.6) 6.8 (4.0–10.8) < 0.0001 MCP1 (pg/ml) 12.1 (2.8–110.1) 5.2 (2.0–28.7) 9.5 (2.6–56.2) 6.7 (2.0–42.8) 0.0002 IFN-γ (pg/ml) 9.8 (2.7–24.5) 8.4 (2.8–22.3) 11.3 (5.1–44.0) 13.1 (4.4–34.7) 0.02
[image:6.585.304.535.553.676.2]P values for the effect of time in ICU on the measured cytokines were obtained by Friedman analysis. The discrepancy in sample size in between days is due to missing samples. BDNF, brain-derived neurotrophic factor; MCP1, monocyte chemotactic protein 1.
Figure 4
trauma-induced injury beneficially affected outcome (34, 35). The higher VEGF levels observed in the survivors versus nonsurvivors in our study also point to an association between low VEGF levels and adverse outcome. Since insulin therapy did not affect circulat- ing VEGF levels, the impact on adhesion molecules was not medi-ated via an effect on this potent endothelial stimulus.
Also, a number of proinflammatory cytokines trigger endothelial cell activation (Figure 1), which in turn plays a role in the host response to infection. It is thought that both inadequate control of infection and an excessive release of cytokines into the systemic circulation play a role in microvascular injury and multiple organ failure (36). The cytokine profiles we documented in the patients with prolonged critical illness revealed a concomitant pro- and antiinflammatory response with an immediately high and further increasing level of antiinflammatory cytokines (IL-4 and brain- derived neurotrophic factor [BDNF]) and a massive and progres-sive further rise in the concentration of proinflammatory cytokines (IL-1β, IL-2, IL-12, IFN-γ, TNF-α and TNF-β, and RANTES). In contrast, initially high circulating levels of the proinflammatory
cytokines IL-6 and monocyte chemotactic protein 1 (MCP1) and the main antiinflammatory cytokine IL-10 decreased over time. Serum levels of IL-5 and IL-8 were higher in nonsurvivors than in survivors, whereas both too-low and too-high levels of IL-6 as well as IL-10 were associated with a higher risk of organ failure and death (37–39). This U-shaped relationship is in agreement with the deleterious consequences of both the overwhelming proin- flammatory response and the prolonged periods of immune sup-pression present in critical illness (reviewed in ref. 40). We expected insulin therapy to lower proinflammatory cytokine levels in view of its known antiinflammatory effect (12, 41). However, intensive insulin therapy had only a mild effect on circulating cytokine lev-els, independent of its preventive effect on infection, and levels of both the proinflammatory IL-6 and the antiinflammatory IL-10 were lowered by intensive insulin therapy. Furthermore, the sup-pression of adhesion molecules preceded an eventual lowering of IL-6 and, according to the multivariate logistic regression analysis, it appeared that none of the cytokines independently determined the risk of death. Hence, it is unlikely that an effect of insulin on cytokine release plays a major role in insulin’s protective effect on the endothelium and organ function, although an influence on local cytokine production cannot be excluded.
[image:7.585.52.282.81.390.2]Although eNOS gene transcription and activity are known to be upregulated by insulin (6, 42), intensive insulin therapy did not alter eNOS gene expression or eNOS protein level in tissue of criti-cally ill patients. This observation, at first sight unexpected, can be explained by insulin resistance in the critically ill. Insulin stimu-lates eNOS expression through activation of PI3K (43), and in a rat model of critical illness (44) as well as type 2 diabetes mellitus
Figure 5
[image:7.585.309.527.552.742.2]NOS gene expression and NF-κB activation in postmortem biopsies. Transcript levels of eNOS and iNOS were measured in postmortem liver and skeletal muscle biopsies. NF-κB activation was evaluated in these tissues by analysis of the levels of phosphorylated IκB. Data are presented as box plots; the central line indicates the median, the box the IQR, and the whiskers the 10th and 90th percentiles. iNOS gene expression data were normally distributed. White boxes represent the patients in the conventional insulin therapy group (n = 49), gray boxes patients in the intensive insulin therapy group (n = 27). *P≤ 0.05; **P≤ 0.01; §P≤ 0.1.
Figure 6
Serum NO levels. Data are presented as box plots; the central line indicates the median, the box the IQR, and the whiskers the 10th and 90th percentiles. Patients were compared with healthy volunteers (dark gray box; n = 30). White boxes represent the patients in the conven-tional insulin therapy group (n = 50 on admission, n = 222 on day 7), light gray boxes patients in the intensive insulin therapy group (n = 50 on admission, n = 180 on day 7). *P≤ 0.05 versus conventional insu-lin therapy; †P≤ 0.05 day 7 versus admission day; #P≤ 0.05 versus
research article
(45), insulin resistance appears to be due to impaired signaling via the insulin receptor substrate/PI3K pathway. Furthermore, Aljada et al. demonstrated that TNF-α inhibits insulin-induced eNOS expression (46). In the present study, the fact that TNF-α levels were high and not affected by insulin therapy might explain the lack of an insulin effect on eNOS expression. However, eNOS gene expression was only measured in the sickest patients, as, for obvi- ous ethical reasons, tissue biopsies were only taken from nonsurvi-vors. Therefore, an effect on eNOS in survivors cannot be excluded. Finally, since isolation of endothelial cells from the snap-frozen liver and skeletal muscle biopsies was impossible, eNOS expres-sion in hepatocytes and muscle cells may respond differently to insulin therapy than that in endothelial cells, and both cell types were present in the tissue biopsies.
iNOS, as opposed to eNOS, gene expression was lowered by intensive insulin therapy in liver and skeletal muscle of nonsur- viving critically ill patients. This was associated with lowered cir-culating levels of NO in a patient population of both survivors and nonsurvivors, which suggests that the reduced expression of iNOS with insulin therapy coincided with a reduced activity of the enzyme. The exact source of iNOS expression and activity and of the ensuing NO production is not clear from this study, as several cell types present in the studied biopsies, including macrophages (47), may contribute in this process. Since this suppression of NO reflected a blunting of a dramatic increase of circulating levels of NO in critically ill patients — i.e., intensive insulin therapy reduced the levels in the 2 upper quartiles without affecting the 2 lower quartiles — it likely explains the observed beneficial effects on the endothelium. Indeed, NO explained a significant part of improved survival in multivariate logistic regression analysis independent of ICAM-1 and E-selectin. The observation that the contribution of ICAM-1 and E-selectin remained borderline significant in the model indicates that NO also mediates effects other than modula-tion of these adhesion molecules. Previous studies have reported elevated serum NO levels in critically ill patients (39, 48). High NO levels are proinflammatory and may evoke organ damage in condi-tions of ischemia and reperfusion, whereas low NO concentrations exert antiadhesive and protective properties (9). Our observation that preventing excessive NO release, via inhibition of excessive iNOS induction without suppression of eNOS, is associated with better outcome of critical illness is in line with previous reports on the effects of NOS inhibitors. Indeed, treatment of septic ani-mals with NOS inhibitors appeared promising and suggested that such inhibitors might be of therapeutic value to improve outcome (49–51). However, although in patients with septic shock, admin- istration of a nonselective NOS inhibitor caused an increase in vas-cular tone and raised blood pressure (52), it also produced a fall in cardiac output and increased mortality (52, 53). Hence, it may be crucial to only prevent the excessive NO release mediated by iNOS and not to negatively influence the protective effects of eNOS, as was shown to occur with intensive insulin therapy in our study.
Proinflammatory cytokines such as IFN-γ, IL-1β, IL-6, and TNF-α also induce iNOS expression and lead to cytotoxic overproduction of NO (reviewed in ref. 8). Since in our study these cytokines were either unaffected by the intervention or their circulating levels were only reduced following the lowering of ICAM-1 and E-selectin levels, it is unlikely that the endothelial protection with insulin therapy could be explained by an effect on cytokines. A direct effect on NF-κ B–driv-en iNOS induction of insulin or of hyperglycemia prevention is more probable (54). When IκB is phosphorylated it loses the capacity to
inhibit nuclear translocation of NF-κB (55), and we indeed observed a trend toward lower amounts of phosphorylated IκB in liver of the patients in the intensive insulin therapy group but not in skeletal muscle. The heterogeneity of the cell population in these tissues, in which various cell types besides endothelial cells are present, may explain why statistical significance was not reached. The resistance to metabolic insulin signal transduction in liver biopsies (56) and the stronger effect of intensive insulin therapy on iNOS gene expression in liver compared with muscle of critically ill patients suggest that prevention of hyperglycemia is the likely driving force reducing iNOS activation and NO production, whereby endothelial protection may ensue. It has indeed been demonstrated that glucose has proinflam-matory effects (57, 58). However, since glucose uptake in endothelial cells is largely insulin independent, prevention of hyperglycemia may also have protected the endothelium directly via prevention of glucose overload (14, 59), part of which may be explained by preven-tion of oxidative stress (60–64). Nevertheless, our current clinical data cannot entirely rule out more direct actions of insulin on the endothelium, and further studies in our animal model of prolonged critical illness (65) are required to differentiate between the impact of glycemic control and that of nonglycemic effects of insulin.
In summary, maintaining normoglycemia with intensive insulin therapy during critical illness protects the endothelium, directly and/or via inhibition of excessive iNOS induction, and thereby contributes to prevention of organ failure and death in ICU.
Methods
Patients. For analysis of serum markers, all 405 patients requiring at least 7 days of intensive care in the large (n = 1,548) randomized controlled trial on the effects of intensive versus conventional insulin therapy (10) were studied. For this study, blood was taken on the admission day, day 5, day 7, day 15, and the last day of intensive care. After centrifugation, serum was kept frozen at –80°C until assay. For the study of gene expression and pro-tein levels of iNOS, eNOS, and nNOS, postmortem biopsy samples of liver (lower right quadrant) and skeletal muscle (right musculus rectus abdomi-nis) were taken from patients in the study who died in the ICU, within minutes after death. Postmortem biopsy samples were available from 76 of 98 ICU nonsurvivors in the study. The tissue samples were snap-frozen in liquid nitrogen and stored at –80°C until analysis.
The detailed study protocol has been described elsewhere (10). In brief, all adult mechanically ventilated patients admitted to the ICU after major surgery were eligible for inclusion in the study. Patients who had been randomly assigned to conventional insulin therapy received insulin only if glucose concentrations exceeded 215 mg/dl, with the aim of keeping con-centrations between 180 and 200 mg/dl (hyperglycemia). Intensive insulin therapy maintained blood glucose levels between 80 and 110 mg/dl (nor- moglycemia). The Institutional Review Board of the Katholieke Universit-eit Leuven had approved the study protocol. Written informed consent was obtained from the closest family member.
For establishment of a reference range for NO levels, sera from 30 non–critically ill volunteers, matched for sex (P =0.9), age (P =0.7), height (P >0.9), and weight (P =0.7), were also analyzed.
Circulating levels of ICAM-1, E-selectin, and VEGF. Circulating levels of ICAM-1, E-selectin, and VEGF were determined upon admission in a ran-dom sub-selection of 100 patients, 50 in each treatment group, and on day 7 in all 405 patients by a commercially available ELISA according to the manufacturer’s instructions (R&D Systems).
Circulating levels of cytokines. On the day of admission and day 5, day 15, and the last day of intensive care, serum concentrations of cytokines (IL-1β, IL-2, IL-4, IL-5, IL-6, IL-8, IL-10, IL-12, TNF-α, TNF-β, RANTES, BDNF, MCP1, and INF-γ) were quantified by a multiplexed microbead suspension ELISA assay using the Luminex 100 system (Luminex Corp.) after optimization and validation of the assay procedure. All incubations were performed at room temperature on a microplate shaker (set at 500 rpm).For analysis of serum samples, serum and standard solutions were diluted 1:10 in assaybuffer (PBS containing 0.5% Tween-20 and 1% BSA). We prepared a filter plate (MultiScreen MABVN 1.2-µm 96-well; Millipore) by pre-wetting it with assay buffer. To each well was subsequently added 50 µl extracted sample and a 50-µl suspension of capture Ab–conjugated beads, 1,500 beads per analyte, in assay buffer containing 1% guinea pig/pig serum (1:1). The capture antibodies were allowed to react with their cor-responding antigens during 1 hour of incubation, and unbound material was removed from the beads by filtering the content of the wells through the filter bottom using a MultiScreen Vacuum Manifold (Millipore). The beads were washed twice using 200 µl washing buffer (PBS containing 0.5% Tween) per well. The captured antigens were subsequently reacted for 1 hour with a mixture (50 µl) of biotinylated detection antibodies each diluted 1:600 in assay buffer. Fifty microliters of streptavidin-phycoery-thrin 20 µg/ml assay buffer (Invitrogen Corp.) was added to the wells, and the incubation continued for an additional 30 minutes. The beads were finally washed twice with 200 µl washing buffer and resuspended in 100 µl washing buffer. After 15 minutes of shaking, the samples were analyzed on the Luminex 100 according to the manufacturer’s instructions.
Expression of iNOS, eNOS, and nNOS mRNA in liver and skeletal muscle accord-ing to quantitative real-time PCR. Messenger RNA from 76 postmortem liver and skeletal muscle biopsies was isolated and quantified as described previ- ously (56). After quality assessment of the RNA (reported in ref. 56), 66 mus-cle samples and 59 liver samples were used. Total RNA (liver, 3 µg; muscle, 1 µg) was reverse-transcribed in a final volume of 20 µl under the following conditions: a 12-µl mixture containing the RNA, 0.1 µl random primers (3
µg/µl; Invitrogen Corp.) and 1 µl dNTPs (10 mM each; Invitrogen Corp.) was heated to 65°C for 5 minutes. Following immediate cooling on ice, an 8-µl mixture containing 4 µl ×5 first-strand buffer (Invitrogen Corp.), 2 µl dithiothreitol (100 nM; Invitrogen Corp.), and 1 µl RNase inhibitor (RNaseOUT, 40 U/µl; Invitrogen Corp.) in H2O and 1 µl SuperScript II
Reverse Transcriptase (200 U/µl; Invitrogen Corp.) was added. The reverse transcription was carried out by incubating the solution for 15 minutes at 25°C, 50 minutes at 40°C, and 15 minutes at 70°C before cooling it down to 4°C. Samples were kept at –20°C until processing by quantitative Taq-Man real-time PCR. All liver samples and all muscle samples were reverse transcribed simultaneously. Reactions lacking reverse transcriptase were also run to generate controls for assessment of genomic DNA contamina-tion. All primer pairs were designed to span an intron to exclude genomic DNA amplification: eNOS (GenBank accession number NM_000603): forward primer, 5′-GGCATCACCAGGAAGAAGACC-3′ (nt 1,758–1,778), reverse primer, 5′-TCACTCGCTTCGCCATCA-3′ (nt 1,831-1,848), TaqMan probe, 5′-CGTGAAGATCTCCGCCTCGCTCAT-3′ (nt 1,799–1,822); iNOS (AF068236): forward primer, 5′-TGGATGCAACCCCATTGTC-3′ (nt 455– 473), reverse primer, 5′-TAATGGACCCCAGGCAAGATT-3′ (nt 572–592), TaqMan probe, 5′-ACACACTTCACCATAAGGCCAAAGGGATTT-3′ (nt 572–556); and nNOS (NM_000620): forward primer 5′ -CGAGCCATCG-GCTTCAA-3′ (nt 2,879–2,895), reverse primer, 5′ -GCTTGCGATTTGCCT-GTCT-3′ (nt 2,985–3,003), TaqMan probe, 5′-CGACCATCCTCTATGC-3′ (nt 2,964–2,979). External standards were generated as described previously (56). cDNA was quantified in real time with the ABI PRISM 7700 sequence detector (Applied Biosystems). The 25-µ l real-time reaction mixture con-tained 12.5 µl qPCR MasterMix (Eurogentec), 200 nM forward primer, 200
nM reverse primer, 200 nM TaqMan probe, 75 ng cDNA for quantification of liver eNOS and iNOS, and 12.5 ng cDNA for quantification of muscle eNOS, iNOS, and nNOS. Gene expression data were corrected for 18S ribosomal RNA, quantified using the TaqMan Ribosomal RNA Control Reagents Kit (Applied Biosystems). For 18S amplification, 75 pg liver and 125 pg muscle cDNA were used for each reaction. Unknown samples were run in duplicate together with a series of 10-fold dilutions (from 108 copies
to 101 copies) of an external standard for generation of a standard curve.
The number of cycles required for the standard ranged between 14 and 36. Samples required on average 28, 33, and 32 cycles for eNOS, iNOS, and nNOS, respectively. Individual samples with a copy number coefficient of variation greater than 20% were reanalyzed. Every patient sample was ana-lyzed in 2 separate runs. To normalize the data, each datapoint was divided by the mean value obtained for the conventionally treated patient group.
iNOS and eNOS protein levels in liver and skeletal muscle. NOS protein levels were evaluated in postmortem liver and muscle biopsies of 76 patients. Tissue samples were homogenized in a buffer containing 20 mM Tris-HCl, pH 7.6, 10% glycerol, 1% Nonidet P-40, 2 µg/ml aprotinin, 5 µg/ml leupeptin, 0.5 µg/ml pepstatin, 10 mM sodium orthovanadate, 34 µg/ml phenylmethylsulfonyl fluoride, 10 mM sodium pyrophosphate, 100 mM sodium fluoride, and 10 mM EDTA. The homogenates were centrifuged for 5 minutes at 9,500 g and 4°C. The protein content in the supernatant was determined with Coomassie Protein Assay Reagent (Pierce Biotechnology Inc.) using a standard curve of BSA. Western blot analysis performed with antibodies raised against eNOS (BD Biosciences — Pharmingen), iNOS (BD Biosciences — Pharmingen and Santa Cruz Biotechnology Inc.), and nNOS (Novus Biologicals Inc.) did not yield reliable results. Therefore, we turned to a commercially available ELISA kit (R&D Systems) to quantify eNOS pro-tein levels. Sixty micrograms liver or 500 µg skeletal muscle total protein per 100 µl were used in the eNOS assay, which was developed according to the manufacturer’s instructions. A similar assay for nNOS was not available. The commercial assay for iNOS, optimized for iNOS detection in cell lines, was not suitable for iNOS quantification in tissue homogenates.
Phosphorylated IκB protein levels in liver and skeletal muscle. Equal amounts of homogenate proteins (100 µg) were separated by denaturing SDS gel electrophoresis in 10% Bis-Tris polyacrylamide gels (Invitrogen Corp.). After separation, proteins were transferred to nitrocellulose membranes. Membranes were incubated overnight at 4°C with the primary Ab against phosphorylated IκB (Ser32/36; Cell Signaling Technology) and with a rabbit anti-mouse HRP-conjugated secondary Ab (DakoCytomation) for 1 hour before development using enhanced chemiluminescence technology (Perki-nElmer). Blots were then analyzed using ImageMaster Software 1D Elite (Amersham Biosciences). To normalize the data, each datapoint was divided by the mean value obtained for the conventionally treated patient group.
Circulating levels of NO. NO levels were quantified by measurement of serum nitrate plus nitrite levels using nitrate reductase and the colorimet-ric Griess reaction (66, 67). A 1:4 dilution in PBS of the serum samples (200 µl) was ultrafiltered (6,000 g, 45 minutes, 4°C) through 10,000-kDa molecular weight filters (Ultrafree-MC Biomax; Millipore). Fifty microli-ters each of the filtrates was analyzed in duplicate. A standard curve was prepared ranging from 0 µM to 50 µM and was included in duplicate in each assay. Nitrate in the standards and samples was converted to nitrite by addition of 50 µl PBS with 600 U/l nitrate reductase from Aspergillus (Roche Diagnostics Corp.) and 100 µM NADH (Sigma-Aldrich). Complete conversion was achieved with an incubation time of 4 hours at room tem-perature, as evaluated by comparison of a converted nitrate standard curve with a nitrite standard curve. Nitrite was then measured after addition of 50 µl PBS, 50 µl 1% sulfanilamide in 5% phosphoric acid and 50 µl 0.1%
research article
Statistical analysis. The results obtained for different groups of patients were compared by the χ2 test for comparison of proportions, Student’s t test
for comparison of normally distributed data (presented as mean ± SD), and the Mann-Whitney U test and Friedman test for data that were not normal-ly distributed (presented as median and IQR, unless otherwise indicated). Paired comparisons of non–normally distributed variables were performed by the Wilcoxon signed rank test. The significance of correlations between parameters was assessed by calculation of the corresponding Pearson (r) or Spearman (ρ) correlation coefficient.
The improvement of patient outcome due to the relative effects of intensive insulin therapy on serum CRP, VEGF, ICAM-1, E-selectin, NO, and cytokine levels was assessed by multivariate logistic regression analy-sis. The factors entered into the logistic regression model were (a) baseline risk factors such as age, type, and severity of illness (APACHE II score) (15), hyperglycemia upon admission, history of diabetes and malignancy; (b) the level of blood glucose control and the dose of insulin; and (c) those studied variables (CRP, VEGF, adhesion molecules, NO, and cytokine lev-els) that upon univariate analysis were significantly related to the studied outcome measures. Variables entered into the model were always checked for skewness. When they revealed a linear relation with the studied out-come measure, they were entered as continuous variables; otherwise a nominal term was entered.
Two-tailed P values less than or equal to 0.05 were considered statisti-cally significant. StatView 5.0.1 software (SAS Institute Inc.) for Macintosh was used for these statistical analyses. Acknowledgments We wish to thank I. Milants for excellent technical assistance. This work was supported by the Fund for Scientific Research, Flanders, Belgium (FWO), the European Commission 6th Framework program EU506965 (CLINICIP), the Research Council of the Catholic Univer-sity of Leuven, and the Belgian Foundation for Research in Congenital Heart Diseases. L. Langouche is a Postdoctoral Fellow for the FWO. Received for publication April 18, 2005, and accepted in revised form June 7, 2005. Address correspondence to: Greet Van den Berghe, Department of Intensive Care Medicine, Katholieke Universiteit Leuven, Her-estraat 49, B-3000 Leuven, Belgium. Phone: 32-16-34-40-21; Fax: 32-16-34-40-15; E-mail: greta.vandenberghe@med.kuleuven.be. Lies Langouche and Ilse Vanhorebeek contributed equally to this work. 1. Takala, J., et al. 1999. Increased mortality associ-ated with growth hormone treatment in critically ill adults. N. Engl. J. Med. 341:785–792.
2. Vallet, B. 2003. Bench-to-bedside review: endothelial cell dysfunction in severe sepsis: a role in organ dys-function? [review] Crit. Care. 7:130–138.
3. Aird, W.C. 2003. The role of the endothelium in severe sepsis and multiple organ dysfunction syn-drome. Blood. 101:3765–3777.
4. Reinhart, K., Bayer, O., Brunkhorst, F., and Mei-sner, M. 2002. Markers of endothelial damage in organ dysfunction and sepsis [review]. Crit. Care Med. 30(Suppl. 5):S302–S312.
5. Lin, C.S., et al. 1998. Analysis of neuronal nitric oxide synthase isoform expression and identifi-cation of human nNOS-mu. Biochem. Biophys. Res. Commun. 253:388–394.
6. Li, H., Wallerath, T., and Forstermann, U. 2002. Physiological mechanisms regulating the expres-sion of endothelial-type NO synthase. Nitric Oxide.
7:132–147.
7. McNaughton, L., et al. 2002. Distribution of nitric oxide synthase in normal and cirrhotic human liver. Proc. Natl. Acad. Sci. U. S. A. 99:17161–17166.
8. Aktan, F. 2004. iNOS-mediated nitric oxide pro-duction and its regulation. Life Sci. 75:639–653. 9. Rawlingson, A. 2003. Nitric oxide, inflammation
and acute burn injury. Burns. 29:631–640. 10. Van den Berghe, G., et al. 2001. Intensive insulin
therapy in critically ill patients. N. Engl. J. Med.
345:1359–1367.
11. Weekers, F., et al. 2003. Metabolic, endocrine, and immune effects of stress hyperglycemia in a rabbit model of prolonged critical illness. Endocrinology.
144:5329–5338.
12. Hansen, T.K., Thiel, S., Wouters, P.J., Christiansen, J.S., and Van den Berghe, G. 2003. Intensive insulin therapy exerts antiinflammatory effects in criti-cally ill patients and counteracts the adverse effect of low mannose-binding lectin levels. J. Clin. Endo-crinol. Metab. 88:1082–1088.
13. Mesotten, D., Swinnen, J.V., Vanderhoydonc, F., Wouters, P.J., and Van den Berghe, G. 2004. Con-tribution of circulating lipids to the improved outcome of critical illness by glycemic control with intensive insulin therapy. J. Clin. Endocrinol. Metab.
89:219–226.
14. Vanhorebeek, I., et al. 2005. Protection of hepato-cyte mitochondrial ultrastructure and function by strict blood glucose control with insulin in criti-cally ill patients. Lancet. 365:53–59.
15. Knaus, W.A., Draper, E.A., Wagner, D.P., and Zim-merman, J.E. 1985. APACHE II: a severity of disease classification system. Crit. Care Med. 13:818–829. 16. Cowley, H.C., Heney, D., Gearing, A.J., Hemingway, I.,
and Webster, N.R. 1994. Increased circulating adhe-sion molecule concentrations in patients with the systemic inflammatory response syndrome: a pro-spective cohort study. Crit. Care Med. 22:651–657. 17. Sessler, C.N., et al. 1995. Circulating ICAM-1 is
increased in septic shock. Am. J. Respir. Crit. Care Med. 151:1420–1427.
18. Cummings, C.J., et al. 1997. Soluble E-selectin lev-els in sepsis and critical illness. Correlation with infection and hemodynamic dysfunction. Am. J. Respir. Crit. Care Med. 156:431–437.
19. Kayal, S., Jais, J.P., Aguini, N., Chaudiere, J., and Labrousse, J. 1998. Elevated circulating E-selectin, intercellular adhesion molecule 1, and von Will-ebrand factor in patients with severe infection. Am. J. Respir. Crit. Care Med. 157:776–784.
20. Whalen, M.J., et al. 2000. Intercellular adhesion molecule-1 and vascular cell adhesion molecule-1 are increased in the plasma of children with sep-sis-induced multiple organ failure. Crit. Care Med.
28:2600–2607.
21. Boldt, J., Wollbruck, M., Kuhn, D., Linke, L.C., and Hempelmann, G. 1995. Do plasma levels of circu-lating soluble adhesion molecules differ between surviving and nonsurviving critically ill patients?
Chest. 107:787–792.
22. Newman, W., et al. 1993. Soluble E-selectin is found in supernatants of activated endothelial cells and is elevated in the serum of patients with septic shock.
J. Immunol. 150:644–654.
23. Ma, X.L., Tsao, P.S., and Lefer, A.M. 1991. Antibody to CD-18 exerts endothelial and cardiac protective effects in myocardial ischemia and reperfusion.
J. Clin. Invest. 88:1237–1243.
24. Gardinali, M., et al. 2000. Inhibition of CD11-CD18 complex prevents acute lung injury and reduces mortality after peritonitis in rabbits. Am. J. Respir. Crit. Care Med. 161:1022–1029.
25. Kakizawa, H., et al. 2004. The relationship between glycemic control and plasma vascular endothelial growth factor and endothelin-1 concentration in
diabetic patients. Metabolism. 53:550–555. 26. Chiarelli, F., et al. 2000. Vascular endothelial
growth factor (VEGF) in children, adolescents and young adults with type 1 diabetes mellitus: relation to glycaemic control and microvascular complica-tions. Diabet. Med. 17:650–656.
27. Dandona, P., et al. 2003. Insulin suppresses plasma concentration of vascular endothelial growth fac-tor and matrix metalloproteinase-9. Diabetes Care.
26:3310–3314.
28. Ferrara, N., Gerber, H.P., and LeCouter, J. 2003. The biology of VEGF and its receptors. Nat. Med.
9:669–676.
29. Neufeld, G., Cohen, T., Gengrinovitch, S., and Pol-torak, Z. 1999. Vascular endothelial growth factor (VEGF) and its receptors. FASEB J. 13:9–22. 30. Tonnesen, M.G., Feng, X., and Clark, R.A. 2000.
Angiogenesis in wound healing. J. Investig. Dermatol. Symp. Proc. 5:40–46.
31. Grad, S., et al. 1998. Strongly enhanced serum lev-els of vascular endothelial growth factor (VEGF) after polytrauma and burn. Clin. Chem. Lab. Med.
36:379–383.
32. Thickett, D.R., Armstrong, L., Christie, S.J., and Millar, A.B. 2001. Vascular endothelial growth fac- tor may contribute to increased vascular perme-ability in acute respiratory distress syndrome. Am. J. Respir. Crit. Care Med. 164:1601–1605.
33. Infanger, M., et al. 2004. Vascular endothelial growth factor serum level is strongly enhanced after burn injury and correlated with local and general tissue edema. Burns. 30:305–311. 34. Campbell, B., Chuhran, C., and Lefer, A.M. 2000.
Vascular endothelial growth factor attenuates trauma-induced injury in rats. Br. J. Pharmacol.
129:71–76.
35. Widenfalk, J., et al. 2003. Vascular endothelial growth factor improves functional outcome and decreases secondary degeneration in experimen-tal spinal cord contusion injury. Neuroscience.
120:951–960.
36. Parrillo, J.E. 1993. Pathogenetic mechanisms of septic shock. N. Engl. J. Med. 328:1471–1477.