http://dx.doi.org/10.4236/ojs.2015.55041
How to cite this paper: Ma, B. (2015) Moisture Control Methods in Silk Reeling Process of Tobacco Based on the Random Forest Regression. Open Journal of Statistics, 5, 393-402. http://dx.doi.org/10.4236/ojs.2015.55041
Moisture Control Methods in Silk Reeling
Process of Tobacco Based on the Random
Forest Regression
Bo Ma
School of Statistics and Mathematics, Yunnan University of Finance and Economics, Kunming, China Email: [email protected]
Received 10 July 2015; accepted 2 August 2015; published 5 August 2015
Copyright © 2015 by author and Scientific Research Publishing Inc.
This work is licensed under the Creative Commons Attribution International License (CC BY).
http://creativecommons.org/licenses/by/4.0/
Abstract
The moisture control of materials in silk reeling technology of tobacco is regarded as the key fac-tor influencing the inner quality of cigarette. In this paper, according to the statistical data of the silk reeling production line of Yunyan (Ruanzhen brand) of Qujing cigarette factory from June 2013 to May 2014, it is feasible to apply the random forest regression model to study the problem of moisture control theoretically. In the perfuming stage of silk reeling, a random forest regres-sion model is established to describe the change of moisture content of finished cut tobacco in the export link of perfuming stage, aroused by several factors including incoming water content and different environment. According to the model, good moisture control in the export link of per-fuming stage (accordance with the technological standards) can be realized by adjusting the regu-lating reference value of incoming moisture under specific workshop environments. In the drying stage of silk reeling, the most effective method of moisture control is to adjust the cylinder wall temperature by means of analyzing the correlation coefficients among variables which influence the moisture content of cut tobacco in the export link of drying stage and then establishing anoth-er random forest regression model. And this method is consistent with the traditional production experiences. In conclusion, these methods referred above provide strong theoretical basis for sta-ble moisture control in the export link of perfuming stage.
Keywords
Random Forests Regression, Moisture Control, Moisture Content in the Export Link of Drying Stage, Moisture Content in the Export Link of Perfuming Stage
1. Introduction
394
working efficiency of the subsequent wrapping process. With the entire silk reeling process, from raw material preparing to tobacco cabinet-type storage, being companied by water, the material moisture control in the process is proved to be a key factor affecting the intrinsic quality of cigarettes. In more detail, good control of the material moisture will have many benefits in promoting the flexibility and process resistance of tobacco leaves, improving the structure of tobacco manufactures, increasing the output rate of silk and reducing the con-sumption of tobacco production.
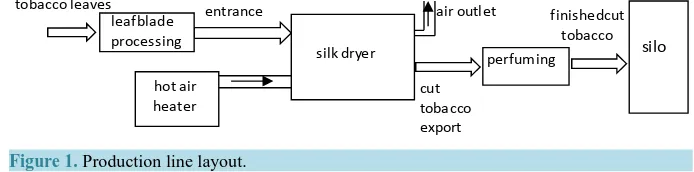
Silk reeling, the longest section of cigarette production, is proved to be complicated. The production line is made up of five processes: loosing and moisture regaining, conditioning and casing, cutting, drying and per-fuming. During the processes, tobacco leaves are changed into cut tobacco in leaf blade processing stage (the first three processes) and fed back into finished cut tobacco in the following drying and perfuming stage (the last two processes). Then, with finished cut tobacco being transferred into silos—storage cabinets, they are placed in different exit cabinets according to their brands and delivered to equipment in the cigarette packaging workshop, powered by wind through the specialized pipes. Furthermore, in order to realize the optimization management of the production process, the new silk reeling production line, whose layout is shown in Figure 1, is highlighted by their full use of automated control and monitoring and docking with enterprise management information sys-tem (MES).1
In silk reeling process, the existing moisture control targets focus on the moisture content of the finished cut tobacco in the export link of the perfuming stage which is supposed to accord with the technological standards. Due to the absence of moisture control function of perfuming machines, the goal of moisture control can be rea-lized by means of adjustment of the moisture content of the cut tobacco in the export link of the drying stage, which has decisive influence on the control objective conversely. In actual production, workshop environment does affect the water desorption of tobacco during the transport, leading to the fluctuated gap between the mois-ture content in the export link of the drying stage and the perfuming stage. Therefore, it is so feasible to hunt the effective change rules of the gap referred above that we can adjust the moisture content in the export link of the drying stage in advance to guarantee the stable moisture content in the export link of the perfuming stage.
In silk reeling process, the changes of seasons and weather will cause changes in temperature and humidity of the workshop environment which will influence the moisture content of cut tobacco further. Consequently, in order to avoid the impacts brought by the factors above, it is feasible to timely adjust equipment parameters to control the moisture content of cut tobacco in the export link of the drying stage. Unfortunately, the frequent ad-justments of equipment parameters completely depend on the production experience now, leading to the unstable gap of moisture content of cut tobacco in drying and perfuming stage. Aiming at making up for the deficiencies, with the appliance of the method of random forest regression (RFR) according to the data in one year, the model for hunting the variation law of water dissipation from the drying stage to the perfuming stage has been estab-lished. Considering the specific production environment when the moisture content of cut tobacco in the export link of the perfuming stage accords with the technological standards, we firstly use the model to predict the re-gulating reference value of moisture content in the export link of the dying stage. Then, we should find the va-rying adjustment ways of dva-rying stage to keep the moisture content consistent with the regulating value. In the final step, based on the regulating reference value and adjustment ways, we can adjust equipment parameters of drying stage to the level where the gap of moisture content of cut tobacco in drying and perfuming stage is proved to be stable.
2. The Random Forest Algorithm
[image:2.595.137.484.620.706.2]Random forest algorithm is one kind of statistical theories, first used by Breiman in 2001 [1]. Based on the
Figure 1. Production line layout. hot air
heater entrance
cut tobacco export
perfuming silo finishedcut
tobacco silk dryer
air outlet tobacco leaves
leafblade processing
395
bootstrap re-sampling technology, this model extracts multiple samples from the original samples first, builds the decision tree models for every sample collection and combines the forecast of these decision tree models then, and votes for the final forecasting results.
2.1. Principle
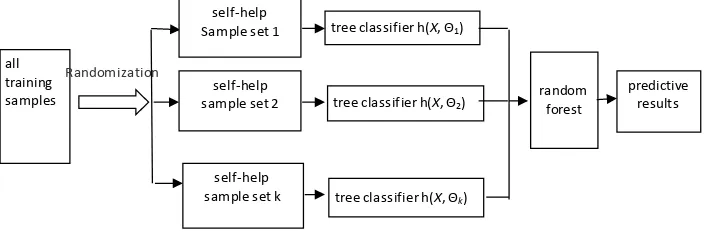
Random forest regression, an important application of the random forest algorithm, is combined models consist of many decision tree models
{
h X(
,Θ ,K)
k=1,}
, whose parameters set{ }
Θk is proved to be anindepen-dent and iindepen-dentically distributed random vector. Given an indepenindepen-dent variable x, average prediction value
(
, k)
h X Θ under the decision tree models determines the final prediction value for each k. And the principle of random forest regression is shown in Figure 2 [2].
2.2. Features
In recent years, the random forest algorithm is more and more mature in both theories and methods. It has been widely applied in medicine, management, economics, and many other fields. And the superiority of the random forest algorithm embodied in many research results.
In the paper, Fang Kuangnan points out the following characteristics of random forest algorithm.
1) Compared with the AdaBoost algorithm, the accuracy of the random forest algorithm is comparable or even better. But, when referred to the computing speed, random forests algorithm has more significant advantages than AdaBoost algorithm [3]. And another advantage of the random forest algorithm is that the over-fitting phe-nomenon is not easy to produce.
2) The random forest algorithm can deal with continuous and categorical variables at the same time.
3) The random forest algorithm can also provide the useful information, such as internal error estimation, in-tensity, correlation coefficients, variable importance and others.
Considering the above advantages and the contrast of many machine learning methods (decision tree regres-sion, Boosting regresregres-sion, Bagging regresregres-sion, artificial neural network regression etc.), it is obvious that the random forest algorithm has many advantages than other algorithms.
2.3. Testing
In traditional statistical methods, it is of great necessity to make some assumptions for the distribution of varia-ble and the form of models first. Then, we determine the loss function under these assumptions and get various kinds of discrimination guidelines, including varying kinds of test standards and the critical value of statistics. However, it cannot be ignored that if the assumptions fail, these discrimination guidelines will not make any sense. Without the assumptions like traditional statistical methods, the quality of algorithm models is easy to be judged by cross-validation method—taking a part of the data as the training set to get the model, and then taking another part of the data as a test set to calculate the error. Therefore, considering the view of model assumptions, the algorithm models have a huge advantage and convenience compared with traditional statistical models.
[image:3.595.139.492.581.699.2]In this paper, the model error can be calculated by the normalized mean square error (NMSE). And the nor-malized mean square error (NMSE) is defined as [4]:
Figure 2. Random forest regression Sketch Map.
all training samples
Randomization
self-help Sample set 1
self-help sample set 2
self-help sample set k
random forest
predictive results tree classifier h(X, Θ1)
tree classifier h(X, Θ2)
(
) (
)
(
)
(
)
2 2 2 2 ˆ ˆ NMSE y y y yy y y
y
= − − = −
−
∑
∑
In this formula, y represents the actual value of dependent variable of the test set and yˆ represents its pre-dictive value. It is obvious that if the model uses only mean value to predict, the normalized mean square error (NMSE) should be equal to 1. Consequently, if the NMSE of algorithm regression models is greater than 1, these models are proved to be very bad. And for the algorithm models, the smaller NMSE is the better (NMSE ≥ 0).
3. Application Examples
3.1. Data Sources and Analysis
In this paper, the statistical data of the silk reeling production line of Yunyan (Ruanzhen brand) of Qujing ciga-rette factory (from June 2013 to May 2014) are studied. And the statistical data come from enterprise manage-ment information system (MES) of Qujing cigarette factory.
We first observe and collect the data as Table 1 shown. In this table, every stage of silk reeling is divided into different processes which are defined and named. Then, after preliminary sorting, screening and matching with their codes, 1108 data samples of each processes of silk reeling of Yunyan (Ruanzhen brand) are obtained.
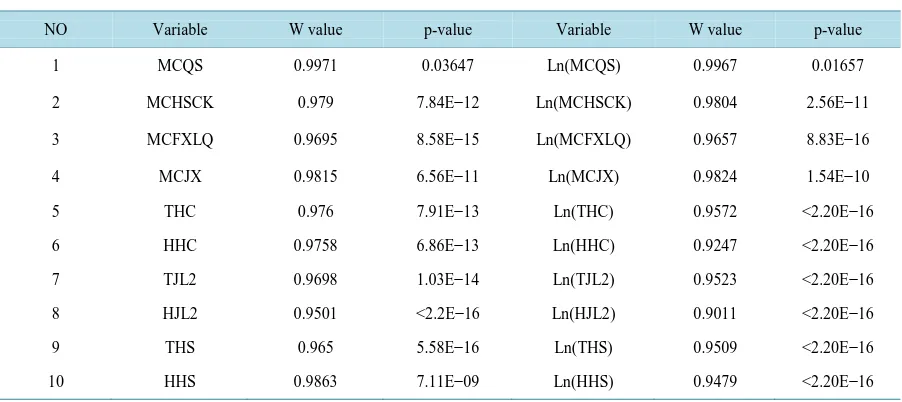
[image:4.595.91.531.337.494.2]Shapiro-Wilk method is used to normality test of the original data, the results about the data are shown in Table 2.
Table 1. Definition of variables.
Code Batch Number
Tobacco Cutting MCQS The moisture content of tobacco cutting
Hot air Heater Parameters THSRFF THSTB HSRFFL
Hot air temperature of drying stage Cylinder wall temperature of drying stage Hot air volume of drying stage
Air Outlet MCHSCK THSCK THS HHS
Moisture content in the export link of the drying stage Temperature in the export link of the drying stage Temperature in drying stage
Humidity in drying stage
Winnowing-Cooling MCFXLQ Moisture content by winnowing-cooling
[image:4.595.88.539.516.717.2]Perfuming Export MCJX, SMCJX Moisture content in the export of the perfuming stage
Table 2. Results of Shapiro-Wilk normality test of all mean figures.
NO Variable W value p-value Variable W value p-value
1 MCQS 0.9971 0.03647 Ln(MCQS) 0.9967 0.01657
2 MCHSCK 0.979 7.84E−12 Ln(MCHSCK) 0.9804 2.56E−11
3 MCFXLQ 0.9695 8.58E−15 Ln(MCFXLQ) 0.9657 8.83E−16
4 MCJX 0.9815 6.56E−11 Ln(MCJX) 0.9824 1.54E−10
5 THC 0.976 7.91E−13 Ln(THC) 0.9572 <2.20E−16
6 HHC 0.9758 6.86E−13 Ln(HHC) 0.9247 <2.20E−16 7 TJL2 0.9698 1.03E−14 Ln(TJL2) 0.9523 <2.20E−16
8 HJL2 0.9501 <2.2E−16 Ln(HJL2) 0.9011 <2.20E−16 9 THS 0.965 5.58E−16 Ln(THS) 0.9509 <2.20E−16
397
The results show that under 5% of significance level, both the moisture data and the temperature-humidity data of each process refuse to obey the normal distribution assumption, even if the data was treated logarithmi-cally. Therefore, the data are termed as non-normal distribution statistical data.
Owing to the obvious truth referred above, we should avoid the use of traditional statistical analysis methods based on normal distribution assumption and choose non-parameter statistics methods which do not depend on the data distribution. Accordingly, in this study, random forest regression analysis is feasible.
3.2. Application
In silk reeling process, the existing moisture control targets focus on the moisture content of the finished cut to-bacco in the export link of the perfuming stage which is supposed to accord with the technological standards. Therefore, we should first establish the model for hunting the variation law of water dissipation from the drying stage to the perfuming stage. Then, we should find the varying adjustment ways of drying stage to control the moisture content in actual production.
3.2.1. Perfuming Stage
In perfuming stage, under the specific environment, the moisture content of cut tobacco in the export link of the drying stage proves to be the focus of the study, for the reason that we can use the data to calculate the moisture content in the export link of the perfuming stage and make a judgment whether the indicator accords with the technological standards. Research clues are as follows: first, we establish a model from the data samples, which are able to predict the corresponding moisture content in the export link of the perfuming stage from the drying stage; second, we can screen the suitable moisture content in the export link of the drying stage under the spe-cific environment to satisfy the technological standards.
Theoretically,important variables which influence the moisture content in the export link of the perfuming stage include the moisture content and temperature in the export link of the drying stage and the temperature and humidity of the workshop environment. Hereby, we consider using one-year data to establish random forest re-gression model. In the model, the moisture content in the export link of the perfuming stage (MCJX) is to be as a dependent variable; the moisture content (MCHSCK) and the temperature (THSCK) in the export link of the drying stage and the temperature (THS) and humidity (HHS) in the drying stage are to be as independent va-riables.
Owing to the large amount of calculation of the prediction made by random forest regression model, we apply the packages Random Forest of R software to be as an critical implement to fulfill the study on the moisture content of silk reeling processes in this paper.
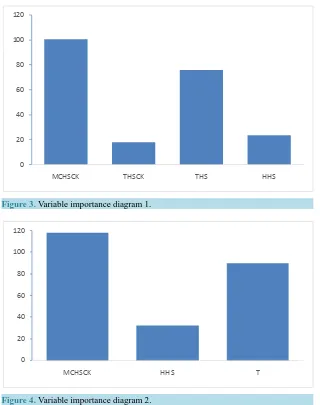
We use the standardized mean square error (NMSE) to evaluate the random forest regression model, with randomly selected 50 samples from the finished samples as test set and the rest of the samples as the training set. By means of training and testing the corresponding set of samples of the random forest regression model, the result shows the NMSE = 0.1807012 and the variable importance diagram [5] is shown in Figure 3.
Furthermore, we can also consider the proportion of the temperature of cut tobacco in the export link of drying
stage to the temperature during drying stage as a variable, which proves to be more reasonable. T THSCK HHS
= ,
an added variable to the model, is termed as the relative temperature in the export link of drying stage.
Then, we also consider establishing a new random forest regression model. In this new model, the moisture content in the export link of the perfuming stage (MCJX) is to be as a dependent variable; the moisture content (MCHSCK) in the export link of the drying stage, the humidity (HHS) in the drying stage and the relative tem-perature during the drying stage are to be as independent variables. The result shows the NMSE = 0.1828422 and the variable importance diagram is shown in Figure 4.
From the results of the analysis above, using the relative variable T, instead of THSCK and HHS, as an im-portant independent variable which influence the moisture content in the export link of the perfuming stage, not only reduces the number of variables of the model, but enhances the accuracy of prediction.
Figure 3. Variable importance diagram 1.
Figure 4. Variable importance diagram 2.
Figure 5 shows the distribution of the moisture content of finished cut tobacco in the export link of perfuming stage.
It can be seen from the chart that the annual moisture content of finished cut tobacco in the export link of perfuming stage concentrates on the interval [12.15, 12.65]. Based on the interval, the moisture content in the export link of drying stage can be calculated.
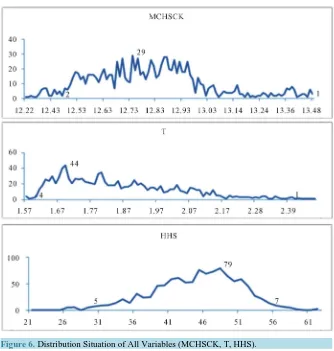
Then, we establish the prediction set to forecast the moisture content of finished cut tobacco in the export link of perfuming stage. And the distribution situation of all variables (MCHSCK, T, HHS) is shown in Figure 6 for intuitive understanding about the distribution range.
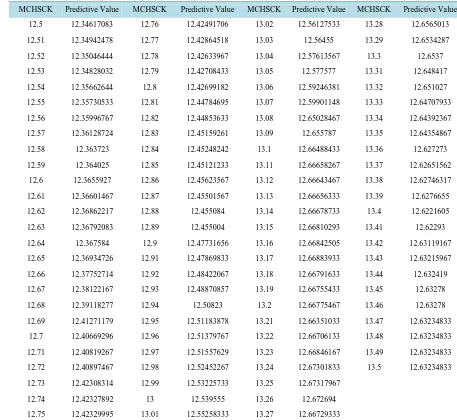
From the chart above, the moisture content of cut tobacco in the export link of drying stage (MCHSCK) con-centrates on the interval [12.50, 13.50]; the distribution range of humidity in the drying stage (HHS) is [30, 55]; the distribution range of relative temperature in drying stage (T) is [1.65, 2.50]. According to the distribution situation of all variables, we choose MCHSCK 101 samples, HHS 26 samples and T 81 samples to establish the testing set, which has total 212706 samples. At the same time, we also establish the training set, including all samples of variables (MCHSCK, HHS, T and MCJX) from the original data, to do random forest regression, where MCJX is to be as the dependent variable, and do prediction with the constructed prediction set. The pre-dictive values of moisture content in the export link of perfuming stage are listed in Table 3, when T value equals to 1.6; HHSJ value equals to 30; the moisture content in the export link of drying stage varies during the interval [12.5, 13.5].
0 20 40 60 80 100 120
MCHSCK THSCK THS HHS
0 20 40 60 80 100 120
399
Figure 5. Distribution of the Moisture Content of Finished Cut Tobacco in the Export Link
of Perfuming Stage.
Figure 6. Distribution Situation of All Variables (MCHSCK, T, HHS).
In Table 3, when the moisture content in the export link of drying stage equals to 12.94; T value equals to 1.6; HHSJ value equals to 30, the predictive value of moisture content in the export link of perfuming stage is 12.50823 which is the best figure according to the technical standards 12.5. Therefore, the regulating reference value of moisture content in the export link of drying stage is 12.94.
By means of the same method, the regulating reference of moisture content in the export link of drying stage can be calculated under different environments.
3.2.2. Drying Stage
[image:7.595.146.480.253.604.2]Table 3. Parts of predictive results.
MCHSCK Predictive Value MCHSCK Predictive Value MCHSCK Predictive Value MCHSCK Predictive Value 12.5 12.34617083 12.76 12.42491706 13.02 12.56127533 13.28 12.6565013 12.51 12.34942478 12.77 12.42864518 13.03 12.56455 13.29 12.6534287 12.52 12.35046444 12.78 12.42633967 13.04 12.57613567 13.3 12.6537 12.53 12.34828032 12.79 12.42708433 13.05 12.577577 13.31 12.648417 12.54 12.35662644 12.8 12.42699182 13.06 12.59246381 13.32 12.651027 12.55 12.35730533 12.81 12.44784695 13.07 12.59901148 13.33 12.64707933 12.56 12.35996767 12.82 12.44853633 13.08 12.65028467 13.34 12.64392367 12.57 12.36128724 12.83 12.45159261 13.09 12.655787 13.35 12.64354867 12.58 12.363723 12.84 12.45248242 13.1 12.66488433 13.36 12.627273 12.59 12.364025 12.85 12.45121233 13.11 12.66658267 13.37 12.62651562
12.6 12.3655927 12.86 12.45623567 13.12 12.66643467 13.38 12.62746317 12.61 12.36601467 12.87 12.45501567 13.13 12.66656333 13.39 12.6276655 12.62 12.36862217 12.88 12.455084 13.14 12.66678733 13.4 12.6221605 12.63 12.36792083 12.89 12.455004 13.15 12.66810293 13.41 12.62293 12.64 12.367584 12.9 12.47731656 13.16 12.66842505 13.42 12.63119167 12.65 12.36934726 12.91 12.47869833 13.17 12.66883933 13.43 12.63215967 12.66 12.37752714 12.92 12.48422067 13.18 12.66791633 13.44 12.632419 12.67 12.38122167 12.93 12.48870857 13.19 12.66755433 13.45 12.63278 12.68 12.39118277 12.94 12.50823 13.2 12.66775467 13.46 12.63278 12.69 12.41271179 12.95 12.51183878 13.21 12.66351033 13.47 12.63234833
12.7 12.40669296 12.96 12.51379767 13.22 12.66706133 13.48 12.63234833 12.71 12.40819267 12.97 12.51557629 13.23 12.66846167 13.49 12.63234833 12.72 12.40897467 12.98 12.52452267 13.24 12.67301833 13.5 12.63234833 12.73 12.42308314 12.99 12.53225733 13.25 12.67317967
12.74 12.42327892 13 12.539555 13.26 12.672694 12.75 12.42329995 13.01 12.55258333 13.27 12.66729333
ting parameters of drying machines. In this stage, moisture control is the core problem studied, namely how to adjust the setting parameters of drying machines to control the moisture content. Research clues are as follows: first research focus on the correlation between all parameters of drying machines and the moisture content in the export link of drying stage; then, analyzing the importance of all variables which influence the moisture content. According to this analysis, we can adjust the important variables of drying stage in this stage.
Production experiences show that the factors which influence the moisture content in the export link of drying stage include the incoming water content and setting parameters of drying machines. The incoming water refers to the moisture content of tobacco cutting (MCQS). Setting parameters of drying machines include the hot air temperature (THSRF), cylinder wall temperature (THSTB) and hot air volume (HSREFL) of drying stage. Con-sidering these variables above, when the data of them do not obey the normal distribution assumption, it is feas-ible to use Spearman correlation coefficient analysis method to describe the correlation among variables.
By means of software R, the Spearman correlation coefficient between the moisture content in the export link of drying stage and other four variables in Table 4.
401
Table 4. Spearman correlation coefficient.
MCQS THSRF THSTB HSRFFL
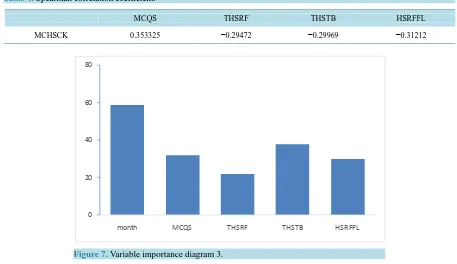
MCHSCK 0.353325 −0.29472 −0.29969 −0.31212
Figure 7. Variable importance diagram 3.
content in the export link of drying stage (MCHSCK) and the hot air temperature (THSRF), cylinder wall tem-perature (THSTB) and hot air volume (HSREFL) of drying stage respectively. According to the above correla-tions between MCHSCK and MCQS, THSRF, THSTB and HSREFL, the moisture content in the export link of drying stage can be controlled by means of adjusting the value of these four variables. A random forest regres-sion model is supposed to be established to study the moisture content in the export link of drying stage and the adjustment can be carried out according to the importance of four variables referred above.
Hereby, a random forest model has been established with the moisture content in the export link of drying stage (MCHSCK) as the dependent variable; months, the hot air temperature (THSRF), cylinder wall tempera-ture (THSTB) and hot air volume (HSREFL) of drying stage as the independent variables. And the model results show that the standardized mean square error (NMSE) equals to 0.271858; the variable THSTB is proved to be the most important variable from Figure 7. Therefore, the most effective measure to control the moisture con-tent in the export link of drying stage is to adjust the cylinder wall temperature. It is understood that the actual production emphasizes the adjustment of the cylinder wall temperature along with the adjustment of the hot air volume, which is consistent with the theoretical analysis results above.
4. Conclusions
In silk reeling process of tobacco, moisture control is of great significance to improving the quality of cigarettes. Due to the characteristics of nonlinearity and uncertainty of the data in the drying stage of silk reeling, in this paper, the random forest algorithm has been used to simulate the reconstructed prediction set in order to find the reference standards of the moisture content in the export of drying stage. Therefore, the moisture content in the export of perfuming stage can be controlled according the reference standards referred above.
It is well-known that traditional multiple linear regression cannot deal with non-normal distribution data, but the random forest regression model effectively compensates for this defect [6]. Furthermore, this model has the advantages of high accuracy, high extrapolation ability and less adjustment parameters.
References
[1] Breiman, L. (2001) Random Forests. Machine Learning, 45, 5-32. http://dx.doi.org/10.1023/A:1010933404324
[2] Svetnik, V., Liaw, A., Tong, C., Culberson, J.C., Sheridan, R.P. and Feuston, B.P. (2003) Random Forest: A Classifi-cation and Regression Tool for Compound ClassifiClassifi-cation and QSAR Modeling. Journal of Chemical Information and
0 20 40 60 80
Computer Sciences, 43, 1947-1958. http://dx.doi.org/10.1021/ci034160g
[3] Lin, Y. and Jeon, Y. (2006) Random Forests and Adaptive Nearest Neighbors. Journal of the American Statistical As-sociation, 101, 578-590. http://dx.doi.org/10.1198/016214505000001230
[4] Wu, X.Z. (2013) Statistical Methods for Complex Data—Based on R. China Renmin University Press Co., Ltd, Beijing, 33.
[5] van der Laan, M.J. (2006) Statistical Inference for Variable Importance. International Journal of Biostatistics, 2, Ar-ticle 2.
[6] Peters, J., De Baets, B.,Verhoest, N.E.C.,Samson, R., Degroeve, S.,De Becker, P. andHuybrechts, W. (2007) Ran-dom Forests as a Tool for Ecohydrological Distribution Modelling. Ecological Modelling, 207, 304-318.