Artificial Neural Network Modelling of Traffic Noise in
Agra-Firozabad Highway
Jyoti Kumar Arora
Department of Applied Sciences & Humanities Technical College, Dayalbagh Educational Institute
(Deemed University), Dayalbagh, Agra 282110
Ponnala Vimal Mosahari
Department of Mechanical Engineering Technical College, Dayalbagh Educational Institute
(Deemed University), Dayalbagh, Agra 282110
ABSTRACT
The noise is a major environmental hazard at present. It causes hearing problem, tinnitus, high blood pressure, mental depression, heart palpitation etc. Noise is a usual problem everywhere and involves high health risk, but in today’s fast life we ignore its harmful consequences and it results in high health risk having long term effect. From past few decades there has been a lot of research in this area but still it is a major challenge to minimize the effect due to noise and even more difficult is to predict. It becomes necessary that we design our habitats and surroundings in a way that it is noise absorbent and the noise effects on us stays minimum. Hence it becomes necessary that we assess the noise that would be generated from various sources, to aid an effective habitat design to combat this hazard. Modelling is an important tool to model and predict noise. Modelling and prediction using various mathematical methods have been done in the past, but ANN is a tool which is more effective in a complex linear and non-linear large scale problem. In this present work single layer Artificial Neural Network (ANN) modelling of noise due to road traffic in Agra-Firozabad highway has been done. 95 data set has been used by measuring the noise intensity across various points along the Agra-Firozabad Highway (most busy highway in Agra) at regular interval of distance. In the ANN model, series of experiments resulted into the performance evaluation, considering 20% data for testing and 20% data for cross validation at 1500 Epoch with 0.70momentum. The Levenberg-Marquardt algorithm (LMA) was found as the best of BP algorithms with a minimum mean squared error for training (MSE) and cross validation.
Key Words
- Variable Traffic Flow, Traffic Speed, Back Propagation Algorithm, Noise Pollution1. INTRODUCTION
The human brain is made up of billions of neurons that are responsible for reasoning and it transmits signals across the human body through synapses. This metamorphosis of biological neuron is used to integrate important principles of the working of real neurons into a simple artificial neuron model, which forms the basis of Artificial Neural Network (ANN). ANN is not an exact replica of human brain; it works on complete synchronous mode. ANN will give output only when input is provided. Human brain on the other hand is not completely synchronous. It will respond to input but there is no predefined time for that. Artificial Neural Network is a modelling approach that has changed the way the present machines and computer works.
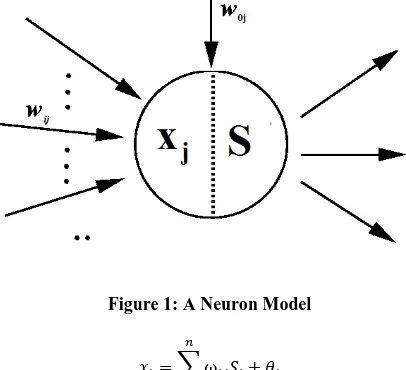
Metaphor of the biological neuron is done to express the different attributes and functions of the real neuron in a mathematical neuron model. ‘The jth artificial neuron that receives input signals si, from possibly n different sources.
These signals traverse weighted pathways ωij in order to
generate an internal activation xj, which is linear weighted
[image:1.595.323.526.233.418.2]aggregation of the impinging signals, modified by an internal threshold, θj.’ [1]
Figure 1: A Neuron Model
∑
Modelling is a powerful tool for the assessment and prediction of behaviour of any system in its environment. Bousscibini et. al. [2] said that modelling is a powerful tool for assessing the environmental impact of noise but the prediction models currently available are limited in their suitability to construct noise patterns. ANN Modelling however is different in approach as it is highly successful even in such non-linear systems and environment. Chen H. [3] classified the road traffic and road side pollution concentrations for assessment of personal exposure.
vehicles and high speed increases the noise generated along the highway.
The highway traffic is getting denser with respect to time, and with increasing traffic density noise pollution is also on the rise. Noise pollution has become a major problem in the present times; it has a long lingering negative effect on human health. Noise pollution is the root cause of many health complexities viz. hearing problem, tinnitus, high blood pressure, mental depression, heart palpitation etc. Noise including hearing impairment is the most prevalent irreversible occupational hazard and it is estimated that 135 million people worldwide have developed hearing difficulties due to heavy road traffic noise. According to Roadknight et. al. [4] in different countries in the past several decades many people has suffered from noise related pollution. A healthy and noise free environment is the need of the hour. Hence in order to create a healthy noise free environment we need to understand the non-linear behaviour of noise, the inherent complexities, and also be able to assess and predict it. To create a healthy and noise pollution free environment, a noise prediction model is needed so that the noise level along a busy highway can be forecast and investigated in advance during the planning and design process. Brown et. al. [5] .The noise generated by a single vehicle in a freely flowing traffic was investigated by Lewis. He classified the vehicle flowing in the traffic into two distinct groups, petrol or diesel, with respect to noise emission. Gilbert. [6] gave an analytical description of noise field emitted from steady stationary traffic flow by means of classic acoustic model. ANN modelling of road traffic noise for environmental impact assessment was suggested by Arora et. al. [7, 8, 9]. Gardner et. al.[10] in reference to the various stages of traffic, gave the examination method to predict such noise in order to assess the environmental impact of noise model. Propagation method by considering various road surfaces types was developed by Cho et. al. [11]. A statistical model of road traffic noise in an urban setting which is based on the fact that percentage of heavy vehicles plays an important role over road traffic noise emission was developed by Calixto et. al. [12] ANN was successfully employed in various environmental, analytical and engineering processes by Arora et. al. [13,14]. Review of the Vehicular pollution modelling using ANN technique was done by Sharma et.al. [15]. Environmental modelling for traffic noise in urban area was done by Cirianni et.al. [16].
In this present work an attempt has been made to model the road traffic emitting out of the NH-2 between Agra and Firozabad section. Considering all the constraints, conditions
and surroundings, an ANN modelling was done with data gathered from the 95 sets of experiments done across various points of equal interval along Agra – Firozabad section of NH-2. The method used is applicable to any set of data which involves complex nonlinear interactions between a number of causal agents and their influence upon process. ANN is used to model the traffic noise in single layer architecture.
Figure 2
3. PROCEDURE FOR DATA
COLLECTION
The noise measuring instrument i.e. microphone was placed at regular interval along the Agra Firozabad Highway. The instrument was placed in 88 locations over the distance of approximately 90 kms. Four time slots were taken, the noise intensity recorded between these time slots were taken into consideration while modelling this non-linear system. The time span were 6:00AM to 8:00AM, 10:00AM to 2:00PM, 3:00PM to 6:00PM and 7:00PM to 10:00 PM measured across 88 locations. The sound level meter was fixed at the edge of the road, and 1.5 metre above the ground. The parameters for surface traffic was measured in terms of vehicle/hours, average traffic speed in terms of km/hour and traffic composition in terms of percentage of heavy vehicle at different locations considering it as output.
2. ANN STRUCTURE
The predictive results are significantly dominated by the network structures. In this particular study of the traffic noise along the Agra Firozabad section of the NH2, three input nodes corresponding to the process variables namely volume of the traffic, speed of the traffic and number of heavy vehicles were used. The single layer ANN structure was used for this prediction system of road traffic noise. However the
optimal number of hidden layers and the optimal number of nodes in each layer are case dependent and there is no straight forward method for its determination. Neuro Solution 6.0, Artificial Neural Network modelling software was used to model this prediction system. 95 sets of experiments were carried out over 88 locations stretched along 90 Kms of the NH2 section under study.
0 10 20 30 40 50 60 70 80 90 100
10
0
70
0
13
00
19
00
25
00
31
00
37
00
43
00
49
00
55
00
61
00
67
00
73
00
79
00
85
00
Recorded Noise Level
A single layer sigmoid network represented the relationship between input and output. The back propagation algorithm based on Levenberg-Marquardt Algorithm (LMA) was found
[image:3.595.161.435.111.329.2]as the best of BP algorithm with a minimum mean square error for training (MSE) and cross validation. Back propagation uses supervised learning in which the network is trained.
Figure 3
4. OPTIMISATION OF ANN
STRUCTURE
The road traffic noise was calculated in the batch experiments as a function of volume of the traffic, speed of the traffic, number of heavy vehicles and the road traffic noise. As environmental pollution is influenced by number of process variables which holds complex non-linear relationship, any simple feed forward network may not be sufficient to handle the prediction efficiency. ANN model based on single layer recurrent back propagation algorithm for the data, generated from the above batch experiments was applied to train the Neural Network. During training, the output vector is computed by a forward pass in which the input is propagated forward through the network to compute the output value of each unit. The output vector is then compared with the desired
vector which resulted into error signal for each output unit. In order to minimize the error, appropriate adjustments were made for each of the weights of the network. After several such iterations, the network was trained to give the desired output for a given input vector. The single layer network structure included ten hidden neurons, describing the dynamics of road traffic noise in effluent (Fig. 3). The sigmoid axon was considered transfer function with 0.7 momentums. The performance of network simulation was evaluated in terms of mean square error (MSE) criterion. The MSE for the training and cross validation data sets were found to be at desired precision. The developed network model was examined for its ability to predict the response of data not forming the part of the training program. Fig. 5 shows the result obtained by the Neural Network simulation for training and Figure 6 for cross validation data sets.
Figure 4
-0.1 -0.05 0 0.05 0.1 0.15 0.2 0.25
1 150 299 448 597 746 895 1044 1193 1342 1491
A
ve
rag
e
M
SE
Epoch
Average MSE with Standard Deviation Boundaries for 3 Runs
Training
+ 1 Standard Deviation
- 1 Standard Deviation
Cross Validation
+ 1 Standard Deviation
[image:3.595.55.544.550.738.2]Figure 5
Figure 6
5. SENSITIVITY ANALYSIS
A sensitivity analysis was conducted to determine the degree of effectiveness of variables. Performance of the group of input vectors included volume of the traffic, speed of the traffic, number of heavy vehicles. Series of experiments
resulted in the evaluation of performance based on 60 % data for training, 20 % data for testing and 20 % data for cross validation at 1500 Epoch with 0.8 momentums. The minimum MSE in the group of four variables was determined for training and cross validation are 3.53238E-08 and
[image:4.595.79.521.568.735.2]0.001939512 respectively.
Figure 7
0 0.05 0.1 0.15 0.2
1 150 299 448 597 746 895 1044 1193 1342 1491
M
SE
Epoch
Training MSE
Run #1
Run #2
Run #3
0 0.05 0.1 0.15 0.2 0.25
1 150 299 448 597 746 895 1044 1193 1342 1491
M
SE
Epoch
Cross Validation MSE
Run #1
Run #2
Run #3
0 0.2 0.4 0.6 0.8
Distance (m)
Se
ns
it
iv
it
y
Input Name
Sensitivity About the Mean
6:00 to 8:00
10:00 to 02:00
03:00 to 06:00
Figure 8
6. CONCLUSION
The present piece of work highlights the possibility of the prediction of the optimum condition for the quantification of any particular gradient in the road traffic noise along Agra Firozabad Highway. The single layer ANN modelling technique is allowed to optimize this process. The Levenberg– Marquardt algorithm (LMA) was found best of BP algorithms with a minimum mean squared error (MSE) for training and cross validation. Thus a simple back propagation of the recurrent network using the momentum training algorithm is proved meaningful supplement for the conventional and complicated mathematical models in the prediction of the noise pollution prediction model for heavy vehicle transport along the Agra Firozabad Highway.
Percentage of heavy vehicles, speed of heavy vehicles and traffic flow are identified as prominent factor and play significant role in traffic noise emission and therefore environmental impact on public health. Moreover current study reveals that using road transportation noise prediction model can be used to reduce the traffic noise level by designing noise absorbent system according to the noise prediction. Noise pollution prediction is an integral part of environmental impact assessment.
7. REFERENCES
[1] Kumar, S. 2004. Neural Networks: A Classroom Approach. The Mc-Graw Hill Companies
[2] Bousscibine A.H. 1997. “Artificial neural networks for predicting Noise from construction sites”. Bldg. Acoustics. 4(3):211-221.
[3] Chan H., Namdev A., Bell M. “Classification of Roaf Traffic and Road Side Pollution Concentrating for Assessment of Personal Exposure”. Journal of Science Direct 23 (2008), PP.-282-287.
[4] Roadknight C.M., Balls G.R., Mills G.E. & Palmer-Brown D. “Modeling Complex Environmental Data” IEEE Transactions of Neural Networks Vol. 8. Month July 1997.
[5] Brown A.L. and Mcdonald G.T. (2003) “Environmental Impact to Environmental Management 2”, Australian Journal of Environmental Management 2. pp 65-77
[6] Gilbert D. “Noise from Road Traffic” (1976). Journal of Sound and Vibration 51 (2), pp. 171-181.
[7] Arora J.K., Singh S.P. (2011). “ANN Modelling of Road Traffic Noise for Environment Impact Assessment”. International Conference on Agile Manufacturing 2011. [8] K. R. Raj, A. Kardam, J. K. Arora, M.M. Srivastava and
S. Srivastava, (2010) “Neural Network modeling for Ni (II) removal from aqueous system using shelled Moringa oleifera seed powder as an agricultural waste”. J. Water Resource and Protection, vol. 2, pp. 332-339.
[9] Kardam, K. R. Raj, J. K. Arora, M.M. Srivastava and S. Srivastava, (2010) “Artificial Neural Network Modeling for Sorption of Cadmium from Aqueous System by Shelled Moringa Oleifera Seed Powder as an Agricultural Waste”. J. Water Resource and Protection, vol. 2, pp. 339-344.
[10] Gardner, M.W. and Dorling, S.R. (1998). “Artificial neural networks (the multi layer perception)-.A Review of Applications in the Atmospheric sciences”. Atmospheric environment. 32(14/15): 2627-2636. [11] Cho D.S. and Mun S. (2008). “Development of a
highway traffic noise prediction model that considers various road surface types”. AppliedAcoustics 69 (11) PP 1120-1128.
[12] Calixto A, Dinitz FB and Zannin PHT (2003). “The statistical modeling of road traffic noise in an urban setting cities “20 (1) PP 23-29.
[13] Kardam, K.R. Raj, J.K. Arora, S. Srivastava, (2010) “Neural Network prediction of the effect of Selenium on the reduction of plant uptake of Cadmium”. Nat.l Acad. Sci. Lett, vol. 33 (3- 4), pp.83-87.
[14] K. R. Raj, A. Kardam, J. K. Arora and S. Srivastava, (2010) “Artificial Neural Network (ANN) design for Hg– Se interactions and their effect on reduction of Hg uptake by radish plant”. J Radioanal Nucl Chem., vol. 283, pp. 797-801.
[15] Sharma N., Chaudary K.K., Chalapati Rao C.V. “Vehicular Pollution Modelling using Artificial Neural Network Technique: A Review”. Journal of Scientific & Industrial research Vol. 64 Sept. 2005 PP 637-647. [16] Cirianni F., Leonardi G. “Environmental Modelling for
Traffic Noise in Urban Area”. American journal of Environmental Science 2012. 8147. PP 345-351
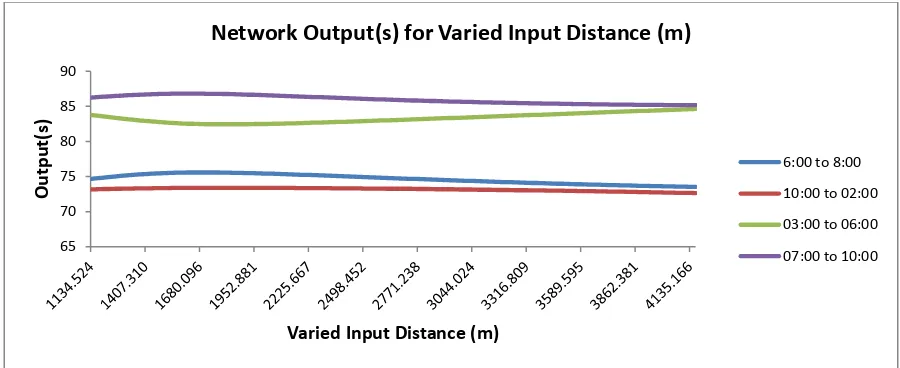
65 70 75 80 85 90
Ou
tp
u
t(
s)
Varied Input Distance (m)
Network Output(s) for Varied Input Distance (m)
6:00 to 8:00
10:00 to 02:00
03:00 to 06:00