Feature Optimization and Performance Improvement of a
Multiclass Intrusion Detection System using PCA and
ANN
Ravi Kiran Varma.P
MVGR College of Engineering, Vizianagaram, AP, INDIA
V. Valli Kumari
Andhra University College of Engineering, Visakhapatnam, AP, INDIA
ABSTRACT
There are several bottle necks in the process of high speed intrusion detection, of which large dimensionality is one of the major problem. We have employed the Principal Component Analysis (PCA) algorithm to handle this problem, through which we have improved the performance of the Artificial Neural Network (ANN) classifier for intrusion detection. With the help of PCA we were able to identify the top 15 out of 41 features among the feature set of KDD cup 1999 data set, and noticed an improvement of over 62% in the training time of ANN. The Multi Layer Perceptron Neural Network improved the accuracy even after the feature reduction.
Key words
MLP Neural Networks, Principal Component Analysis, Intrusion Detection System.
1.
INTRODUCTION
Attack detection in a computer network is always a challenge that the security administrators and the personnel face. Intrusion Detection System (IDS) is a primary choice and one among the tools for perimeter security. Among the two major types of IDS i.e. Misuse based and Anomaly based, the Anomaly based IDS has an edge over the other type in detecting novel and ever varying patterns of attacks[17]. Lots of literature and studies go into the use of Artificial Neural Networks (ANN) [12], [13], [16], [21] due to several advantages like good learning ability, adaptability, fault tolerant, hardware implement ability, inherent feature of contextual information processing, low energy consumption etc. In this paper we have proposed a 15 class classifier. Most of the literature is based on KDD 1999 IDS evaluation data standard which consists of 41 features. In this study we have trained and tested our ANN with all the 41 features and also tried to optimize the feature set by reducing the number of features to 15 using Principal Component Analysis (PCA) and further training and testing showed a considerable improvement in training time by 62%.
Related work: J.P Anderson defined the Intrusion attempt in [23] and created a room for several studies on IDS and techniques. Dorothy Denning [10] has inspired many researchers by proposing an anomaly based Intrusion Detection model. The interesting work of Varun Chandola et.al. [8] discusses about various anomaly intrusion detection mechanisms. A similar work done by Fariba Haddadi et.al. [4] demonstrates a five class classifier to detect the intrusions from the DARPA data set where an average of 82.44 % detection rate was reported. In another work [9] a two class classifier based on feed forward neural network was proposed. Neural Network proved to be good for anomaly detection to find user behaviour in [15]. In [3] a Hybrid intrusion detection system was demonstrated. The use of PCA in [24] by Solomon Raju e.al. reduced the complex data set to a lower
dimension to reveal hidden structures. In a paper by T.Petreus et.al. [5] PCA was used to extract essential features in the field of bio-informatics. In a study [6] the authors used PCA to detect hidden software features for malware analysis. In [7] the authors Leila Mechtri et.al used PCA and grey neural networks for classification of intrusion data with five classes.. In our present work we have proposed a novel multiclass classifier model which can detect 15 classes of attacks including normal traffic. The optimized features proved to improve the performance on the ANN by reducing the training time and also the detection accuracy.
The section I consists of the motivation and introduction to our work, section II consists of description about Intrusion detection system, types and about the date set selection for the study. Section III consists of description of the Artificial Neural Network model used for this study. Section IV consists of discussion on Principal Component Analysis algorithm and its role in feature optimization of the data set. Section V consists of the result analysis and conclusions.
2.
INTRUSION
DETECTION
SYSTEM
AND
THE
KDD
DATA
SET
2.1
Intrusion Detection System
Intrusions Detection Systems still are the hot picks of the security administrators due to several reasons including no system can be completely secure without any flaws or vulnerabilities [11]. The important classes of intrusions include attempted break-ins, penetration of security control systems, information leakage, Denial of Service, Masquerading, Malicious use etc. The IDS can detect most of these types of attacks and help for further study and analysis of these attacks and to patch the security systems. Among the two major types of IDS i.e Anomaly based and Misuse based the Anomaly based IDS has an advantage of detecting novel and even slight variations of the attacks [18]. Artificial Intelligence techniques such as the ANNs, SVM, HMM etc. are often employed for IDS to detect novel attacks. The Multi Layer Perceptron feed forward Neural Network is being used as the IDS algorithm for classification of various types of attacks. The neural network system requires data sets for training, which should include both normal traffic as well as attack traffic. The KDD Cup 1999 IDS evaluation data set is used since it the standard data set for researchers in this area [20].
2.2
KDD CUP’99 Dataset Description
KDDCUP’99 is the most widely used dataset for the evaluation of anomaly detection methods. It includes the following attack categories [14]:2.2.1
Denial of Service attack (DoS):
computing resource very busy to handle legitimate users access to a machine.
2.2.2
U2R (User to Root):
This is an attack where the hacker tries to gain access to the root account of the target system starting with access to a normal user account, with the help of exploit code or methods that takes advantage of vulnerabilities.
2.2.3
R2L (Remote to Local):
In this type of attack, an attacker who does not have any account on that target machine, exploits some vulnerability and tries to gain the access of that target machine.
2.2.4
Probing Attack:
[image:2.595.329.558.72.479.2]
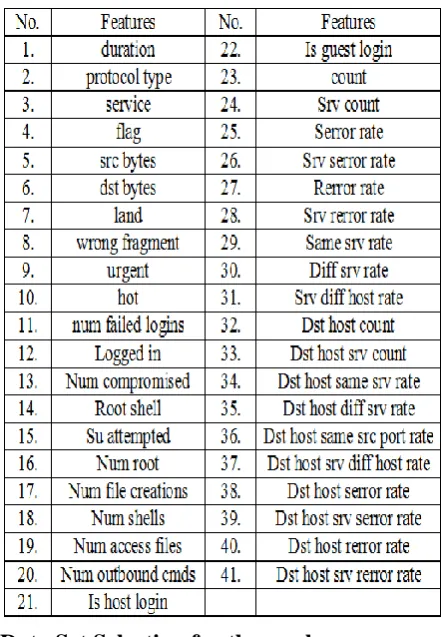
Is a class of exploit where the malicious hacker attempt to gather information about a network of computers. [22] The KDD CUP 99 dataset consists of 41 features for each packet. Table.1 shows the feature description of all the features in KDD CUP 99 dataset. The data set is pre-processed before applying on the ANN to contain only numerical values, but nor string values.
Table 1. KDD Cup 1999 data set features.
2.3
Data Set Selection for the work:
The KDD cup 1999 data set [22] consists of two files namely 10% KDD and corrected, for heterogeneity in data we took training samples from both of these files as shown in Table.2. For some attack types very limited data sets are available.
Table 2. Number of samples selected from KDD Cup 1999 data set for training and testing.
Attac k Main Class
Sub Class
S. No of Cl ass
No of Data set taken for Training From 10% KDD + From Corrected.
No. of data sets taken for Testing From 10% KDD + From Corrected. Norm
al
Norm al
1 15,000 15,000
DOS Attac ks
Smurf 2 25,000 25,000 Neptu
ne
3 15,000 15,000
Back 4 1000 1000
Mailb omb
5 4000 1000
Teardr op
6 512 412
R2L
Snmp getatta ck
7 5000 2000
Warez master
8 1020 420
Guess _pass wd
9 3050 1040
Warez client
10 1000 500
U2R Snmp guess
11 1500 500
Probe Ipswe ep
12 800 600
Ports weep
13 1000 700
Saint 14 600 300
Satan 15 2000 1100
76374 65,572
3.
ARTIFICIAL NEURAL NETWORKS
3.1
Artificial Neural Networks
The main advantages of using ANN is that they posses non-linearity[2], they provide a input-output mapping by learning with a teacher, they can adapt to the changes in the environment, they provide evidential response, they are fault tolerant, they are VLSI implementable and above all they are neuro-biologically inspired [19]. Among the various types of neural networks the multilayer perceptron (MLPNN) are the best suitable for implementing a multiclass classifier [16].
3.2
Feed-forward Neural Network:
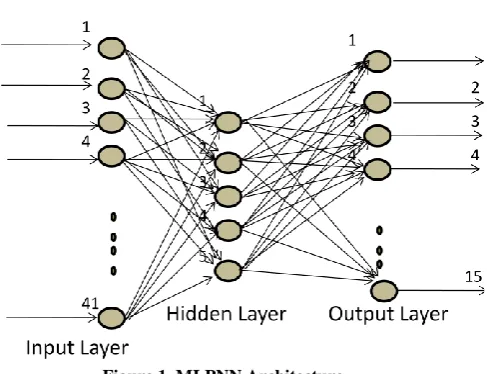
[image:2.595.72.294.300.619.2]3.3.1 The Multi Layer Perceptron Artificial
Neural Network before applying PCA is
[41-5-15]
It contains 41 input neurons for each input feature in the KDD dataset
Five hidden neurons were selected based on trial and error method
[image:3.595.55.299.181.368.2] Fifteen output neurons to determine normal or attack types.
Figure 1. MLPNN Architecture The Multi Layer Perceptron Artificial Neural Network algorithm is shown below:
3.3.2
Algorithm :
STEP 1: START
STEP 2: Initialize number of hidden neurons and epochs. STEP 3: Load the pre-processed input data for training. STEP 4: Generate initial weights of neurons randomly STEP 5: for i=1 to number of ephocs
for j=1 to No. of input patterns Select the random pattern
Calculate the output of hidden layer by using the following formula:
𝐻
𝑗=
11+ 𝑒− 𝑛𝑢𝑚𝐼𝑛𝑝𝑢𝑡𝑖=0 (𝑊 1𝑖,𝑗 .𝑋𝑖)
... (1) Adjust the weights of hidden layer Calculate the output of output layer by
using the following formula:
𝑂
𝑗=
1
1 + 𝑒
− 𝑛𝑢𝑚𝐻𝑖𝑑𝑑𝑒𝑛𝑖=0 (𝑊2𝑖,𝑗.𝐻𝑖) ...(2) Calculate the error at output neuron as:∆𝑊
𝑗= 𝑂
𝑗(1 − 𝑂
𝑗)(𝑇
𝑗− 𝑂
𝑗)
... (3)for all j=1 to num_Hidden, where Tj is corresponding target output.
Back propagate the error and calculate the errors at hidden units as:
∆𝑉𝑗 = 𝐻𝑗(1 − 𝐻𝑗)(∆𝑤. 𝑊2𝑗)….(4)
Adjust the output weights of hidden neurons according to error
Adjust input weights of hidden neurons end loop
if error < 0.001 end loop STEP 6: STOP
By the end of the training process the weights are frozen and the ANN model is ready.
4
FEATURE OPTIMIZATION USING
PRINCIPLE COMPONANT
ANALYSIS
Feature optimization is done to reduce the redundancy of features. Principal Component Analysis is used for this purpose. In PCA, feature selection is done for selecting a subset of relevant features, thereby improving the performance of the system. By removing most irrelevant and redundant features from the data, feature selection helps improve the performance of learning models.
Using PCA in optimization generates principal components, whose number is less than or equal to the number of actual components. PCA is an Eigen-vector based multi variant. Often, its operation can be thought of as revealing the internal structure of the data in a way which best explains the variance in the data. Given the visualization of the coordinates of a multivariate dataset in a high-dimensional data space (1 axis per variable), PCA can supply the user with a lower-dimensional picture, a "shadow" of this object. This is done by using only the first few principal components so that the dimensionality of the transformed data is reduced. Below is the general formula to compute scores on the first component extracted (created) in a principal component analysis:
C1 = b 11(X1) + b12(X 2) + ... b1p(Xp) ---(5) Where
C1 = the subject’s score on principal component 1 (the first component extracted)
b1p = the regression coefficient (or weight) for observed variable p, as used in creating principal component 1
Xp = the subject’s score on observed variable p.
4.1
The PCA Algorithm
STEP 1: Get some data
The 41 features of the collected data from KDD CUP 99 dataset is applied to PCA for feature optimization on its 41 features, which are redundant and correlated.
STEP 2: Subtract the mean
The mean is calculated as shown below:
--- (6)
Now the mean is subtracted from each dimension from the data set. The mean subtracted is the average across each dimension. The resultant data set with subtracted means will have a mean of zero.
STEP 3: Calculate the covariance matrix
The covariance matrix will be two dimensional since the data is 2 dimensional. Covariance matrix is calculated as:
𝑣𝑎𝑟 𝑋 = 𝑋𝑖 – 𝑋
𝑛
𝑖=1 (𝑋𝑖− 𝑋 )
(𝑛 − 1)
--- (7)
STEP 4: Calculate the Eigen vectors and Eigen values of the covariance matrix
Depending on the signals it generate, we need to choose the features whose signal value is more and these features are called principal components.
STEP6: Get the new data
By multiplying the obtained components with the old data, we will get the new data.
5
RESULTS
AND
CONCLUSION
5.1
Results
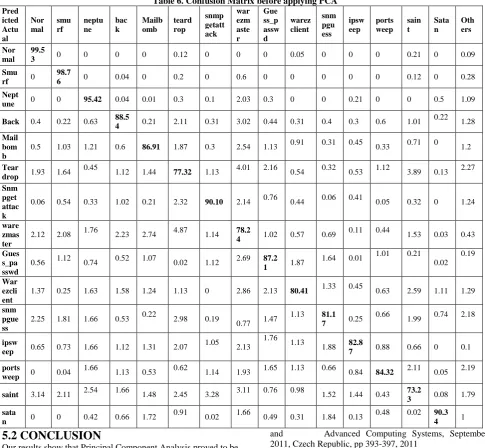
[image:4.595.316.549.72.279.2]Table 3 shows the detection rates and the false positive rate obtained from the 15 class ANN classifier of various classes of attacks before applying PCA and table 6 shows the corresponding confusion matrix. The results clearly show that the detection rate depends on the number of training set available since from Table.1 we can see that the records for some type of attacks like Tear drop, warezmaster, saint etc. are less in number, so as the detection rates. Table.4 shows the output of PCA from which we selected the top 15 features that are more effective.
Table 3. Detection Rate of MLPANN before applying PCA Attack Type Detection
Rate
False Positives
Normal 99.53 0.470
Smurf (DOS) 98.76 1.24
Neptune (DOS) 95.42 3.28
Back (DOS) 88.54 6.70
Mailbomb (DOS) 86.91 9.62
Teardrop (DOS) 77.32 15.61
Snmpgetattack(R2L) 90.10 7.9 warezmaster(R2L) 78.24 13.21 Guess_passwd(R2L) 87.21 8.43 Warezclient(R2L) 80.41 13.11
snmpguess(U2R) 81.17 12.10
ipsweep(Probe) 82.87 10.25
portsweep(Probe) 84.32 11.21
saint(Probe) 73.23 17.55
satan(Probe) 90.34 5.56
Average 86.28%
Table 4. Top 15 features selected from PCA Feature
Rank
Feature number out of 41 features
Feature name Output of PCA Signal value
1 5 Src bytes 9.913595
2 33 Dst host srv
count
8.638142
3 32 Dst host count 5.380869
4 3 Service 5.380742
5 2 Protocol type 5.379961
6 4 Flag 5.377820
7 29 Same srv rate 5.369393
8 34 Dst host same
srv rate
5.356421
9 36 Dst host same
src port name
5.354023
10 12 Logged in 5.306561
11 38 Dst host serror rate
5.288926
12 37 Dst host serv
diff host name
5.288926
13 35 Dst host diff
serv rate
5.258945
14 1 Duration 5.117015
15 31 Srv diff host
rate
3.201556
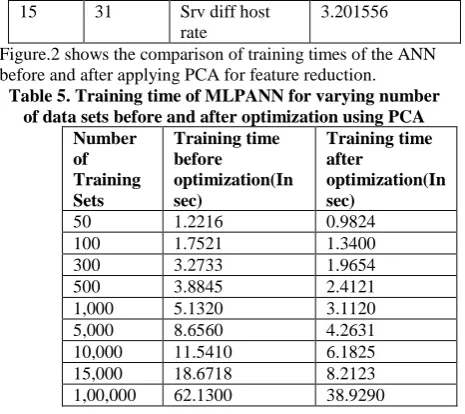
Figure.2 shows the comparison of training times of the ANN before and after applying PCA for feature reduction.
Table 5. Training time of MLPANN for varying number of data sets before and after optimization using PCA
Number of Training Sets
Training time before
optimization(In sec)
Training time after
optimization(In sec)
50 1.2216 0.9824
100 1.7521 1.3400
300 3.2733 1.9654
500 3.8845 2.4121
1,000 5.1320 3.1120
5,000 8.6560 4.2631
10,000 11.5410 6.1825
15,000 18.6718 8.2123
[image:4.595.58.289.269.751.2]1,00,000 62.1300 38.9290
Figure 2. Training Time graph for comparison before and after PCA
The lower detection rates of few of the classes are due to the fact that the data set for training is very limited.
Table 5. Detection Rate of MLPANN after applying PCA Attack Type Detection
Rate
False Positives
Normal 99.61 0.39
Smurf (DOS) 98.58 1.42
Neptune (DOS) 95.81 2.83
snmpguess(U2R) 81.22 12.3
ipsweep(Probe) 84.10 9.81
Warezclient(R2L) 80.29 12.76 Snmpgetattack(R2L) 90.72 6.77 warezmaster(R2L) 80.17 11.68 Guess_passwd(R2L) 87.60 8.11 portsweep(Probe) 85.21 10.84
saint(Probe) 74.54 16.65
satan(Probe) 91.14 5.20
Total 88.31%
Comparison of Training times
0 10 20 30 40 50 60 70
50 100 300 500 1,00
0
5,00 0
10,0 00
15,0 00
1,00 ,00
0
Number of training sets
Ti
m
e
t
a
k
e
n
in
s
e
c
on
ds
Training time before optimization(In sec)
Training time after optimization(In sec)
Back (DOS) 90.16 6.12
Mailbomb (DOS) 88.13 8.64
[image:4.595.317.558.319.508.2]Table 6. Confusion Matrix before applying PCA
Pred icted Actu al
Nor mal
smu rf
neptu ne
bac k
Mailb omb
teard rop
snmp getatt ack
war ezm aste r
Gue ss_p assw d
warez client
snm pgu ess
ipsw eep
ports weep
sain t
Sata n
Oth ers
Nor mal
99.5
3 0 0 0 0 0.12 0 0 0 0.05 0 0 0 0.21 0 0.09
Smu rf 0
98.7
6 0 0.04 0 0.2 0 0.6 0 0 0 0 0 0.12 0 0.28
Nept
une 0 0 95.42 0.04 0.01 0.3 0.1 2.03 0.3 0 0 0.21 0 0 0.5 1.09
Back 0.4 0.22 0.63 88.5
4 0.21 2.11 0.31 3.02 0.44 0.31 0.4 0.3 0.6 1.01
0.22 1.28
Mail bom b
0.5 1.03 1.21 0.6 86.91 1.87 0.3 2.54 1.13 0.91 0.31 0.45 0.33 0.71 0 1.2
Tear
drop 1.93 1.64
0.45
1.12 1.44 77.32 1.13 4.01 2.16 0.54 0.32 0.53 1.12 3.89 0.13 2.27
Snm pget attac k
0.06 0.54 0.33 1.02 0.21 2.32 90.10 2.14 0.76 0.44 0.06 0.41 0.05 0.32 0 1.24
ware zmas ter
2.12 2.08 1.76 2.23 2.74 4.87 1.14 78.2
4 1.02 0.57 0.69
0.11 0.44
1.53 0.03 0.43
Gues s_pa sswd
0.56 1.12 0.74 0.52 1.07 0.02 1.12 2.69 87.2
1 1.87
1.64 0.01 1.01 0.21 0.02
0.19
War ezcli ent
1.37 0.25 1.63 1.58 1.24 1.13 0 2.86 2.13 80.41 1.33 0.45 0.63 2.59 1.11 1.29
snm pgue ss
2.25 1.81 1.66 0.53 0.22 2.98 0.19
0.77 1.47
1.13 81.1 7 0.25
0.66
1.99 0.74 2.18
ipsw
eep 0.65 0.73 1.66 1.12 1.31 2.07
1.05 2.13
1.76 1.13
1.88 82.8
7 0.88 0.66 0 0.1
ports
weep 0 0.04
1.66
1.13 0.53 0.62 1.14 1.93 1.65 1.13 0.66 0.84 84.32 2.11 0.05 2.19
saint 3.14 2.11 2.54 1.66 1.48 2.45 3.28 3.11 0.76 0.98 1.52 1.44 0.43 73.2
3 0.08 1.79 sata
n 0 0 0.42 0.66 1.72
0.91
0.02 1.66 0.49 0.31 1.84 0.13 0.48 0.02 90.3
4 1
5.2
CONCLUSION
Our results show that Principal Component Analysis proved to be a very efficient technique that can be used for data dimensionality reduction without the loss of the originality of the data set. The MLP neural network has proved to implement a multiclass classification problem very efficiently even with 15 classes. In this work we have demonstrated the capability of ANN in a detailed outlier classifications related to Intrusion Detection Systems data set. Table 5 shows the improvement of 62% in the training efficiency regarding the time consumed, which is a very significant improvement.
6
REFERENCES
[1] Ravi Kiran Varma.P, V.Valli Kumari, VVS. Prasanna, “Heuristic approach to improve the performance of ANN based Intrusion Detection System ”, Proceedings of the 3rd
IEEE International Conference on Signal Processing Systems, August 2011, Yantai, China, pp 071-076, 2011
[2] Kachurka P, Golovko V, “Neural Network Approach to real time network intrusion detection and recognition”, IEEE 6th International Conference on Intelligent Data Acquisition
and Advanced Computing Systems, September 2011, Czech Republic, pp 393-397, 2011
[3] Amza C, Leordeanu C, Cristea V, “Hybrid Network Intrusion Detection”, Proceedings of the 2011 IEEE International Conference on Intelligent Computer Communication and Processing, pp 503-510, Romania, Aug 2011.
[4] Fariba Haddadi, Sara khanchi, Mehran Shetabi, Vali Derhami “Intrusion detection and attack classification using Feed-Forward Neural Network”, Proceedings of the Second IEEE International Conference on Computer and Network Technology, Thailand, pp 262-266, April 2010
[5] T.Petreus, CE Cotrutz, M. Neamtu, E.C. Buruiana, P.D. Sirbu, A. Neamtu, “Understanding the dynamics-activity relationship in metalloproteases : Idea for new inhibition strategies”, 2010 IEEE International Conference on Advanced Technologies for Enhancing Quality of Life, pp 83-86, Romania, Dec 2010.
on Human System Interaction,pp 157-162, Poland, May 2010.
[7] Leila Mechtri, Fatiha Djemili Tolba, Nacira Ghoualmi, “Intrusion Detection Using Principal Component Analysis”, IEEE 2nd International Conference on Engineering Systems Management and its Applications, pp 1-6, France, Aug 2010.
[8] Varun Chandola, Arindam Banerjee, Vipin Kumar, “Anomaly Detection: A Survey”, ACM Computing Surveys, Vol. 41, No. 3, Article 15, July 2009.
[9] Yana Demidova, Maksym Ternovoy, “Neural Network Approach of Attack’s Detection In the Network Traffic”, The IXth International Conference “The Experience of Designing and Application of CAD Systems in Microelectronics” Feb 2007 IEEE, Ukraine, pp128-129, 2007
[10] D. E. Denning, “An intrusion detection model,” IEEE Transactions on Software Engineering, vol. 13, no. 2, pp. 222–232, 1987.
[11]. J. Ryan, M. Lin and R. Miikkulainen, Intrusion Detection with Neural Networks, AI Approaches to Fraud Detection and Risk Management: Papers from the 1997 AAAI Workshop, Providence, RI, pp. 72-79, 1997.
[12] K. Fox, R. Henning, J. Reed and R. Simonian, A Neural network approach towards intrusion detection, Proceedings of ACM 13th National Computer Security Conference, Baltimore, MD, pp. 125-134, 1990.
[13] James Cannady, Artificial neural networks for misuse detection, Proceedings of the 1998 National Information Systems Security Conference (NISSC'98), Arlington, VA, 1998
[14]D.Nagaraju, P.Srinivasulu, V.Valli Kumari, A.Govardhan, “Outlier detection as network intrusion detection system using multilayered framework” proceedings of the Springer CCSIT 2011, pp 101-111, 2010.
[15] H. Debar, M. Becker, and D. Siboni, A neural network component for an intrusion detection system, Proceedings of 1992 IEEE Computer Society Symposium on Research in
Security and Privacy, Oakland, California, pp. 240 – 250, 1992.
[16] M. Moradi, Mohammad Zulkernine. A Neural Network Based System for Intrusion Detection and Classification of Attacks. Proceedings of 2004 IEEE International Conference on Advances in Intelligent Systems - Theory and Applications, Luxembourg-Kirchberg, Luxembourg, 2004.
[17] John McHugh, Alan Christie, Julia Allen, “Defending Yourself: The role of Intrusion Detection Systems”, IEEE Software, vol 17 no. 5 pp 42-51, Sep 2000.
[18] Iftikhar Ahmad, Azween B Abdullah, Abdullah S Alghamdi “Application of artifitial neural networks in detection of DOS attacks”, Proceedings of ACM SIN’09, North Cyprus, Turkey, 2009.
[19] S.Mukkamala, G. Janoski, A.H.Sung, “Intrusion Detection Using Neural Networks and Support Vector Machines”, Proceedings of IEEE International Joint Conference on Neural Networks (Hawaii, May 2002) pp 1702-1707, 2002
[20]Amit kumar Choudary, Akhilesh Swarup, “Neural Network Approach for Intrusion Detection”, proceedings of the 2009 International Conference of Interaction Sciences, Seoul, Korea, 2009
[21] Srinivas Mukkamala, Intrusion detection using neural networks and support vector machine, Proceedings of the 2002 IEEE International Honolulu, HI, 2002.
[22]KDD 1991 datasets. The UCI LDD Archive, http://kdd.ics.uci.edu/databases/kddcup99/kddcup99.html, Irvine, CA, USA, 1999.
[23] J.P Anderson. Computer Security Threat Monitoring and Surveillance. Technical report, James P Anderson Co., Fort Washington, Pennsylvania, April 1980.