Munich Personal RePEc Archive
The Machinery Industry In Kazakhstan:
Economic Conditions and Policies
Lord, Montague J.
JICA, Japan International Cooperation Agency
March 1998
Online at
https://mpra.ub.uni-muenchen.de/41165/
Economic Conditions and Policies
Preliminary Draft Report
Prepared by
Montague J. Lord
The Materials Process Technology Center
Yachiyo Engineering Co., Ltd
Presented to
Japan International Cooperation Agency
and
The Machinery Industry in Kazakhstan: Economic Conditions and Policies
Preface
This report represents the collaborative efforts of the national and international specialists in policy issues affecting the machinery industry in Kazakhstan. It provides background material on the economic conditions and policies affecting the machinery industry for the Master Plan Study for the Development of the Machinery Industry in the Republic of Kazakhstan.
The Study Team benefited from contributions from many government officials and numerous individuals in the private sector, as well as the direction provided by the members of the Steering Committee, staff members of the Ministry of Energy, Industry and Trade and numerous other ministries and committees of the Government of the Republic of Kazakhstan, members of the Japan International Cooperation Agency and the Embassy of Japan.
The present report was prepared under the direction of Mr. Teruhiko Wakabayashi, Team Leader. Ms. Nailya Kaliakbarovna Abdymoldaeva, Director of Policy and Legislation of the Ministry of Energy, Industry and Trade was the Government counterpart for the study. Ms.
Abdymoldaeva’s contributions to the preparation of the
trade-related material of this report and her coordination of work with other branches of the Government are gratefully acknowledged. The report also benefited from the excellent translation services provided by Ms. Galina Aleksandrovna Rezakova and other members of the local staff under the direction of Mr. Vasily Ilyich Beshun.
CONTENTS
PREFACE ii
CONTENTS iii
TABLES vi
FIGURES x
BOXES xi
ACRONYMS xii
EXECUTIVE SUMMARY xiv
PART I. BACKGROUND AND COVERAGE 1
1. INTRODUCTION 2
1.1 Terms of Reference 2
1.2 Objectives and Organization of the Report 3
PART II. OVERVIEW OF THE ECONOMY 11
2. THE PROCESS OF ECONOMIC TRANSITION 12
2.1 Structural Reforms and Liberalization Initiatives 12
2.2 Macroeconomic Policy Environment 17
2.2.1 Monetary Stabilization Policies 17
2.2.2 Fiscal Measures and Public Investment Policies 18
2.3 Development of Key Productive Sectors 18
3 REVIEW OF THE MACHINERY INDUSTRY 22
3.1 Agroindustrial and Mining Activities 22
3.1.1 The importance of Agriculture and Mining 22 3.1.2 Agricultural and Agroindustrial Performances 23 3.1.3 Mining and Mineral Processing Activities 28
3.2 The Machinery Industry 29
The Machinery Industry in Kazakhstan: Economic Conditions and Policies
PART III. TRADE, INVESTMENT AND FINANCING 36
4 TRADE POLICIES AND PERFORMANCES 37
4.1 Current Trade Patterns in Machinery and Related Industries 37 4.2 Comparative Advantage of Machinery-Related Industries 44
4.3 Nominal Rates of Protection 46
4.4 CIS Trade and Customs Union Issues 49
4.5 Export Processing Zones and Special Economic Zones 50
5 THE INVESTMENT ENVIRONMENT 52
5.1 Investment Patterns and Policies 52
5.1.1 Investment Patterns 52
5.1.2 FDI Policies 59
5.1.3 Registration Procedures and Regulatory Issues 62
5.2 Tax Structure and Incentives 63
5.2.1 Tax Structure 63
5.2.2 Incentives for Foreign Direct Investment 65 5.3 Infrastructure and Costs Related to the Machinery Industry 65
5.3.1 Utility Costs 65
5.3.2 Wages 65
5.3.3 Transportation Costs 68
5.3.4 Other Investment Issues for the Machinery Industry 68
6 FINANCING CONDITIONS 70
6.1 Trade and Investment Financing 70
6.2 Banking Facilities and Regulations 70
6.3 Constraints on Private Enterprise Finance 70
6.4 Financing Constraints on the Machinery Industry 70
IV. PRIVATIZATION, REGULATIONS AND INSTITUTIONS 71
7 PRIVATIZATION POLICIES 72
7.1 Privatization Policies and Progress 72
7.2 Privatization-Related Institutions 76
7.3 Privatization Patterns in the Machinery Industry 77
8 THE INSTITUTIONAL FRAMEWORK 79
8.1 The Changing Government Structure 79
8.1.1 Overview of the Reform 79
8.1.2 The Ministry of Energy, Industry and Trade 79
8.2 Technical Schools and Vocational Institutes 79
8.2.1 Structure and Distribution of Activities 79
8.2.2 Funding Sources and Programs 79
9 DONOR ASSISTANCE PROGRAMS 80
9.1 Donor Assistance Strategies 80
9.2 Donor Activities in Machinery-Related Industries 83
9.3 Areas of Complementarity and Coordination 91
V. CONCLUSIONS 93
10 SUMMARY AND RECOMMENDATIONS 94
10.1 Overview 94
10.2 Trade Policies 97
10.3 Investment Policies 97
10.4 Financing Requirements 97
10.5 Privatization Policies 97
10.6 Institutional Support Mechanisms 97
10.7 Coordination of Donor Activities 97
Annex: Meetings during the First Field Trip 98
Statistical Appendix 101
The Machinery Industry in Kazakhstan: Economic Conditions and Policies
TABLES
Table 2.1 Comparative National and Regional Statistics for
Key Socio-Economic Indicators, 1995 14
Table 2.2 Key Macroeconomic Indicators, 1994-97 16
Table 2.3 Major Products of Machinery Industry-Related
Activities 18
Table 2.4 Contribution of Selected Industries to Total
Industrial Production, 1990-96 19
Table 2.5 Kazakhstan’s Industrial Output Changes, 1995-97 20
Table 3.1 Value Added of Selected Activities, 1993-96 23
Table 3.2 Agricultural Production, 1993-96 24
Table 3.3 Yields of Selected Agricultural Crops, 1990-96 25
Table 3.4 Composition of Agricultural Processing Industries,
1994-96 26
Table 3.5 Production of Metallurgical Products, 1994-95 27
Table 3.6 Output Index of Selected Industries, 1990-96 28
Table 3.7 Output of Basic Machinery Products, 1990-96 30
Table 3.8 Production of Major Types of Machinery, 1994-95 31
Table 3.9 Freight Traffic by Transportation Mode, 1985-97 33
Table 3.10 Change in Transportation Costs for
Freight, 1993-96 34
Table 3.11 General Purpose Rolling-Stock at End-1995 35
Table 4.1 Machinery Trade, 1997 (Quarters I-III) 38
Table 4.2 Export-Based Ranking of Major Machinery
Products, 1997 (Quarters I-III) 41
Table 4.4 Kazakhstan's Main Traded Commodity Groups,
1996 43
Table 4.5 Revealed Comparative Advantage of Kazakstan's
Exports 45
Table 4.6 Kazakhstan Non-Zero Import Duties on Machinery,
1997 47
Table 5.1 Fixed Capital Investment, 1995-97 53
Table 5.2 Inflow of Foreign Direct Investment, by Sector,
1993-97 55
Table 5.3 Foreign Direct Investment by Country of Origin,
1993-97 57
Table 5.4 Comparative Utilities and Transportation Services
Costs of Kazakhstan 66
Table 5.5 Wages in Industry, Agriculture and All Sectors,
1995.1 - 1997.3 67
Table 5.6 Cost Structure Of Selected Industries, 1995-96 67
Table 7.1 Privatization of State Owned Enterprises, 1994-97 74
Table 7.2 Enterprise Debts and Arrears, 1996 to
mid-1997 75
Table 7.3 Case-by-Case Privatization of State-Owned
Enterprises, 1995-97 76
Table 7.4 Mass Privatization by Industry Category, 1995-97 77
Table 9.1 ODA Projects Related to the Development of
the Machinery Industry in Kazakhstan 85
Table 10.1 Macroeconomic and Structural Adjustment Policies
for a Successful Machine Development Strategy 95
The Machinery Industry in Kazakhstan: Economic Conditions and Policies
Appendix Table 1.3 Prices, Interest Rates and Exchange Rates, 1994-97 105
Appendix Table 1.4 Employment by Sector, 1990-96 106
Appendix Table 1.5 Privatized Enterprises by Sector, 1996-97 106
Appendix Table 1.6 Distribution of Enterprises by Sector, July 1997 107
Appendix Table 2.1 Total Land Area and Distribution of Agricultural
Land by User, January, 1997 109
Appendix Table 2.2 Cultivation of Selected Products, 1996-97 110
Appendix Table 2.3 Capital Investment in Agriculture, 1990-96 110
Appendix Table 2.4 Output of Processed Agricultural Products, 1994-95 111
Appendix Table 3.1 Production of Non-Ferrous Metals, 1994-95 112
Appendix Table 3.2 Output of Selected Ferrous Metal Products, 1990-96 113
Appendix Table 3.3 Extraction of Selected Commercial Ores, 1990-96 113
Appendix Table 3.4 Production of Metallurgical Products, 1994-95 114
Appendix Table 4.1 Output of Major Industrial Products, 1996-97 115
Appendix Table 4.2 Output of Major Products of Forestry,
Wood-working and Pulp and Paper Industries, 1990-96 116
Appendix Table 4.3 Production by Technology-Intensive
Industries, 1990-96 116
Appendix Table 4.4 Production by Light Industries, 1990-96 117
Appendix Table 5.1 Production of Individual Machinery
Products, 1996-97 118
Appendix Table 5.2 Stocks of Tractors and Other Agricultural
Machines, January 1997 119
Appendix Table 5.3 Volume of Machinery Production by Region,
1994-95 120
Appendix Table 6.1 Transportation of Freight, 1996-97 124
Appendix Table 6.2 Volume of Cargo Shipment by Transportation
Mode, 1985-95 124
Appendix Table 6.3 Railway Transport of Selected Cargo, 1990-96 125
Appendix Table 7.1 Kazakhstan Trade in Major Product Categories,
1995 126
Appendix Table 7.2 Export-Based Ranking of Kazakhstan's
Machinery Products, 1997 (Quarters I - III) 128
Appendix Table 7.3 World Exports of Agricultural Machinery,
Excluding. Tractors (SITC, Rev.3 = 721), 1992-96 135
Appendix Table 7.4 World Imports of Agricultural Machinery,
Excluding Tractors (SITC, Rev.3 = 721), 1992-96 136
Appendix Table 7.5 World Exports of Tractors (SITC, Rev.3 = 722),
1992-96 138
Appendix Table 7.6 World Imports of Tractors (SITC, Rev.3 = 722),
1992-96 139
The Machinery Industry in Kazakhstan: Economic Conditions and Policies
FIGURES
Figure 2.1 Index of Real GDP (1992=100), 1992-97 15
Figure 2.2 Inflation, 1994-97 17
Figure 2.3 Refinance Rate of NBK, 1995-97 17
Figure 2.4 Importance of Industry, 1996 19
Figure 3.1 Value Added of Agriculture, 1992-97 25
Figure 3.2 Value Added of Industry, 1992-97 28
Figure 3.3 Machinery Output versus Total Industrial
Production, 1995.1–1997.1 29
Figure 3.4 Number of Tractors, 1980-96 30
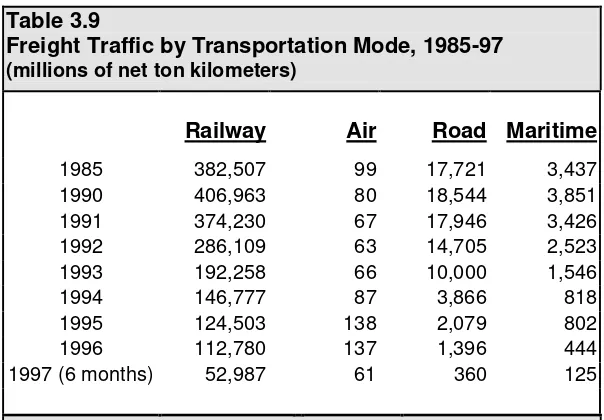
Figure 3.5 Composition of Railway Freight Transportation
Modes, 1990-95 33
Figure 4.1 Trade in Machinery of Master Plan, 1997 37
Figure 4.2 Major Exports of Selected Machinery, 1997 38
Figure 4.3 Major Imports of Selected Machinery, 1997 38
Figure 4.4 Kazakhstan’s Major Trading Partners, 1996 49
Figure 5.1 Share of Agriculture Investment by
State-Owned Enterprises (SOEs) and Non-SOEs 53
Figure 5.2 FDI by Industry, 1994-97 54
BOXES
Box 1.1 Basic Information on Kazakhstan 7
Box 4.1 Kazakhstan's Customs Levies and Fees
for Customs Services 48
Box 5.1 Kazakhstan’s Credit Rating 60
The Machinery Industry in Kazakhstan: Economic Conditions and Policies
ACRONYMS
ADB Asian Development Bank ASF Agricultural Support Fund
CAAEF Central Asian-American Enterprise Fund CASE Central Asian Stock Exchange
CCAB Coca-Cola Almaty Bottlers cif Cost-insurance-freight
CIS Commonwealth of Independent States
CLFEC Commodity List of Foreign Economic Activity DEF Defense Enterprise Fund
EBRD European Bank for Reconstruction and Development EPZ Export processing zone
ERP Effective rate of protection EXIM Export-Import Bank FDI Foreign Direct Investment fob Free on board
FSU Former Soviet Union
GATS General Agreement on Trade in Services GDP Gross domestic product
GOK Government of Kazakhstan
GSP Generalized System of Preferences
HS Harmonized System
IBRD International Bank for Reconstruction and Development IFC International Finance Corporation
IMF International Monetary Fund ITC International Trade Center
JICA Japan International Cooperation Agency LIT life inheritable tenure
MFN Most-favored nation (principle)
MEIT Ministry of Energy, Industry and Trade NBK National Bank of Kazakhstan
NIS Newly independent states NRP Nominal rate of protection NTM Non-tariff measures ODA Official donor assistance
OECF Overseas Economic Cooperation Fund OPIC Overseas Private Investment Corporation PRC Chinese National Oil Company
PSA Production sharing agreement RCA Revealed comparative advantage SEZ Special economic zone
SITC Standard International Trade Classification SME Small and medium enterprises
UN United Nations
USAID United States Agency for International Development USIS United States Information Service
USTDA United States Trade and Development Agency VAT Value added tax
The Machinery Industry in Kazakhstan: Economic Conditions and Policies
The Machinery Industry in Kazakhstan: Economic Conditions and Policies
1.
INTRODUCTION
Contents
1.1 Terms of Reference 1.2 Organization of the Report
1.1
Terms of Reference
The present report addresses the economic conditions, policies and regulatory issues affecting the machinery industry in Kazakhstan. Its coverage is based on the Inception Report of the Master Plan Study for the Development of the Machinery Industry in the Republic of Kazakhstan (JICA, 1997), as well as discussions held by the Study Team in Almaty during 6-10 November 1997, and the recommendations made by the Steering Committee on 11 November 1997.
The resulting terms of reference are as follows:
Review the range of institutions and policies affecting the Kazakhstan economy in general, and those influencing the machinery industry in particular.
Consider the socioeconomic conditions underlying the development of the machinery industry in the following areas:
transition to a market-oriented economy
macroeconomic conditions and policies
banking and finance
trade and the balance of payments investment
privatization
legislative and institutional framework national development plan
Support the formulation of the comprehensive master plan for the development of the machinery industry by identifying measures that need to be taken by the Government of Kazakhstan (GOK) to provide a conducive enabling environment for the machinery industry.
1. First Field Study (6 November – 16 December 1997): Review and analysis of economic factors influencing conditions in the Kazakhstan economy, with particular emphasis on those factors influencing the machinery industry.
2. First Home-Country Study (second half of January 1998): Preparation of the Progress Report based on the findings of the study team during the first field study.
3. Second Field Study (two-week period between mid-February and end-of-March 1998): Gather supplemental information on the economic conditions, policies and regulatory issues.
4. Second Home-Country Study (March 1998): Preparation of the preliminary report on the machine industry development plan.
5. Third Field Study (one-month period between mid-June and end-of-July 1998): Review of changes that have taken place since the first field study.
6. Third Home-Country Study (August 1998): Preparation of the draft final report on the master plan for the machinery industry
7. Fourth Field Study (mid-September 1998): Presentation and discussion of the draft final report of the master plan.
8. Fourth Home-Country Study (August 1998): Revision and translation of the draft final report.
1.2
Organization of the Report
The report consists of four major parts, plus an executive summary and two annexes:
Part I: Background and Coverage
This part presents the terms of reference and plan of the report.
Chapter 1: Introduction
The Machinery Industry in Kazakhstan: Economic Conditions and Policies
Part II: Overview of the Economy
This part contains an overview of the economy and the sectors related to the machinery industry.
Chapter 2: The Process of Economic Transition
Kazakhstan’s transition from a centrally planned system to a market economy is shown to have made more progress under the Government’s macroeconomic policies aimed at economic stability than in the liberalization policies aimed at structural reforms, for example, through the removal of relative-price distortions and the reduction of state intervention.
Chapter 3: Review of the Machinery Industry
This chapter analyzes production, trade and investment characteristics of the machinery industry, as well as agricultural and mining activities supported by the industry, and the country’s transportation and distribution characteristics.
Part III: Trade, Investment and Financing
This part examines trade and investment patterns of the machinery industry within the context of agricultural and mineral processing activities, and it analyzes the availability of financing for those sectors.
Chapter 4: Trade Policies and Performances
Trade policies are changing Kazakhstan’s trade patterns and are thereby producing dynamic changes in the country’s comparative advantage in the production of agroindustrial and mineral products. The results of recent trade arrangements, including those being negotiated with the World Trade Organization (WTO) are likely to profoundly affect the country’s regional and international trade patterns.
Chapter 5: The Investment Environment
Chapter 6: Financing Conditions
The chapter examines constraints on the availability of financial capital inhibiting investments and the ability of private enterprises to operate. It also examines the changing structure of financing and possible channels for accessing capital.
Part IV: Privatization, Regulations, and Institutions
This part examines the progress made in privatization, regulatory issues affecting the machinery industry, and the changing public and private institutional framework of the economy.
Chapter 7: Privatization Policies
Privatization in large-scale enterprises has lagged behind small-scale and mass privatization initiatives, which has slowed the restructuring process in the machinery industry. This chapter examines these patterns and shows how they have affected investment activities in the industry.
Chapter 8: The Regulatory Environment
This chapter examines key legislation affecting the machinery industry and its related agroindustrial and mineral sectors, and it reviews the legislative reforms that have been completed and the remaining regulatory reforms that could advance the development of this industry.
Chapter 9: The Institutional Framework
The changing Government structure could have a profound effect on the direction of key productive sectors of the economy, including the machinery industry, and the present chapter examines those changes and their implications. It also reviews machinery-related institutions and their possible role in the master plan for the industry.
Chapter 10: Donor Assistance Programs
The Machinery Industry in Kazakhstan: Economic Conditions and Policies
Part V: Conclusions and Recommendations
This part reviews the progress of macroeconomic and structural adjustment measures aimed at liberalizing the economy within a stabile environment. It also provides recommendations on policy, regulatory and institutional changes that would support the restructuring of the machinery industry and promote investment in the industry.
Chapter 11: Policy and Institutional Recommendations
After reviewing the present state of the macroeconomic and structural policy reforms in the economy, the present chapter examines the broad range of policy initiatives that would support the modernization of the machinery industry in the areas of trade, investment, finance, regulations, privatization.
The Annex describes the meetings held during the first field trip.
The Statistical Appendix contains basic statistics.
Box 1.1
Basic Information on Kazakhstan
Geography and Natural Resources:
Area:total area:2,717,300 sq km, or 7 times larger than Japan;land area: 2,669,800 sq km.
Land boundaries:total:12,012 km;border countries:China 1,533 km,
Kyrgyzstan 1,051 km, Russia 6,846 km, Turkmenistan 379 km, Uzbekistan 2,203 km.
Coastline:0 km (landlocked) Kazakhstan borders the Aral Sea (1,015 km) and the Caspian Sea (1,894 km).
Climate:continental, cold winters and hot summers, arid and semi-arid.
Terrain:extends from the Volga to the Altai Mountains and from the plains in western Siberia to oasis and desert in Central Asia.
Natural resources:major deposits of petroleum, coal, iron ore, manganese, chrome ore, nickel, cobalt, copper, molybdenum, lead, zinc, bauxite, gold, uranium.
Land use:arable land:15%;meadows and pastures:57%;forest and woodland: 4%;other:24%.
The Machinery Industry in Kazakhstan: Economic Conditions and Policies
Box 1.1 (continued)
Economy
GDP:purchasing power parity - $46.9 billion (1995 est.); real GDP growth rate: 2.0% (1997 est.); per capital GDP: $1,385 (1997 est.).
GDP composition by sector(1996):agriculture:12.8%;industry:21.3%.
Inflation rate(consumer prices): 17.5% (1997 est.)
Labor force:7.356 million;by occupation:industry and construction 31%, agriculture and forestry 26%, other 43% (1992).
Industries:oil, coal, iron ore, manganese, chromite, lead, zinc, copper, titanium, bauxite, gold, silver, phosphates, sulfur, iron and steel, nonferrous metal, tractors and other agricultural machinery, electric motors, construction materials; much of industrial capacity is shut down and/or is in need of repair.
Industrial production growth rate:(second quarterly 1997 change) -2.4%.
Agriculture:grain (mostly spring wheat), cotton, wool, meat.
Exports:$6.2 billion (1996);commodities:oil, ferrous and nonferrous metals, chemicals, grain, wool, meat, coal;major partners:Russia, Ukraine, Uzbekistan.
Imports:$4.3 billion (1996);commodities:machinery and parts, industrial materials, oil and gas;major partners:Russia and other former Soviet republics, China.
Foreign Investment$1.172 billion (1996).
Major Investor Countries:Canada, France, Germany, Great Britain, Italy, Japan, NIS Republics, Norway, South Korea, Turkey, USA.
Foreign Investment Breakdown: metallurgy (50%); oil and gas (35%); high technology (3%); agriculture/food processing (2%); telecommunications (3%); banking services (3%); consumer goods (2%).
Electricity:capacity:17,380,000 kW;production:65.7 billion kWh (1995 est.).
Currency:national currency, the tenge, introduced on 15 November 1993.
Exchange rates:75 tenge per US$ (average 1997 est.).
Box 1.1 (continued)
Transportation Railways:
total:13,841 km in common carrier service; does not include industrial lines. broad gauge:13,841 km 1.520-m gauge (3,299 km electrified).
Highways:
total:87,873 km public roads;paved:82,568 km;unpaved:5,305 km (1994).
Waterways:4,002 km on the Syrdariya River and Irtis River.
Pipelines:crude oil 2,850 km; refined products 1,500 km; natural gas 3,480 km (1992).
Ports:Aktau (Shevchenko), Atyrau (Guriev), Oskemen (Ust-Kamenogorsk), Pavlodar, Semey (Semipalatinsk); Airports: 352 (total).
People
Population:16,916,463 (July 1996 est.)
Age structure:0-14 years:30%;15-64 years:63%;65 years and over:7% (1996).
Population growth rate:-0.15% (1996 est.).
Birth rate:19.02 births/1,000 population (1996 est.).
Death rate:9.65 deaths/1,000 population (1996 est.).
Infant mortality rate:63.2 deaths/1,000 live births (1996 est.).
Life expectancy at birth:total population: 64.09 years;male:58.56 years; female:69.9 years (1996 est.).
Ethnic divisions:Kazak (Qazaq) 41.9%, Russian 37%, Ukrainian 5.2%, German 4.7%, Uzbek 2.1%, Tatar 2%, other 7.1%.
Religions:Muslim 47%, Russian Orthodox 44%, Protestant 2%, other 7%.
Languages:Kazakh is the official language spoken by over 40% of population, Russian spoken by two-thirds of population.
The Machinery Industry in Kazakhstan: Economic Conditions and Policies
Box 1.1 (continued)
Government:
Name of country:conventional long form:Republic of Kazakhstan;conventional short form:Kazakhstan;former:Kazakh Soviet Socialist Republic.
Type of government:republic.
Capital: Akmola (new); Almaty (‘second capital’).
Administrative divisions:14 oblasts and 1 city (Almaty) - Akmola Oblast, Aktobe Oblast, Almaty Oblast, Atyrau Oblast, East Kazakhstan Oblast,
Karaganda Oblast, Kyzylorda Oblast, Kostanai Oblast, Mangystau Oblast, North Kazakstan Oblast, Pavlodar Oblast, South Kazakhstan Oblast, West Kazakhstan Oblast, Zhambyl Oblast.
Independence:16 December 1991 (from the Soviet Union).
Constitution:adopted 28 January 1993; amended in April 1995 and August 1995.
Legal system:based on civil law system.
Executive branch:Chief of state:President Nursultan A. Nazarbayev (since 22 February 1990).
Legislative branch:bicameral Parliament
Judicial branch:Supreme Court
Environment:Radioactive or toxic chemical sites associated with its former defense industries and test ranges throughout the country pose health risks for humans and animals; industrial pollution is severe in some cities; because the two main rivers which flowed into the Aral Sea have been diverted for irrigation, it is drying up and leaving behind a harmful layer of chemical pesticides and
natural salts; pollution in the Caspian Sea; soil pollution from overuse of agricultural chemicals and salinization from faulty irrigation practices.
_____________________
The Machinery Industry in Kazakhstan: Economic Conditions and Policies
2.
THE PROCESS OF ECONOMIC TRANSITION
Contents:
2.1 Structural Reforms and Liberalization Initiatives 2.2 The Macroeconomic Policy Environment
2.2.1 Monetary Stabilization Policies
2.2.2 Fiscal Measures and Public Investment Policies 2.3 Development of Key Productive Sectors
2.1
Structural Reforms and Liberalization Initiatives
Under the Soviet Union the economy of Kazakhstan was transformed from a land of pastoral nomads into one with large-scale and diverse industries, and advanced crop-growing and animal husbandry. The transformation was accomplished by the Soviet system's ability to direct massive amounts of resources toward large projects for economic and social development. The transportation infrastructure was of special importance to Kazakhstan because of its vast territory. Over 100,000 kilometers of roads and a rail network of 14,500 kilometers were built during the Soviet era. The country became a large producer of non-ferrous and ferrous metals, coal, petroleum, grain and animal husbandry products. After the Virgin Lands campaign in the second half of the 1950s, Kazakhstan also became a major producer of cereals for the Soviet Union. The country's share in the production of wheat in the Soviet Union exceeded 30 percent.
During the 1970s and early 1980s Kazakhstan's growth began to stagnate because of rigidities in the planning system, and industrial production decreased to one-third the rate of growth of earlier years. Before a reorganization could take place, perestroika
(restructuring) was launched in the late 1980s without a clear strategy. The results were disappointing and efforts to improve the situation were undertaken in 1990. The Supreme Council of the Soviet Union examined the issue of transition to a regulated market economy, concluding that each republic should begin developing its own concepts and models of economic transformation consistent with its individual circumstances. However, implementation of these decisions was superseded by the dramatic political events in the Soviet Union of August and December 1991 when the leaders of Russia, Belarus and the Ukraine agreed to dissolve the Soviet Union and Kazakhstan gained its independence.
1993 to move the economy from a centrally planned system to a market economy. During the early years, the reforms were directed at price liberalization, privatization, and the introduction of a national currency. In general, however, the two major channels of reform have been (i) macroeconomic policies aimed at economic stability through fiscal, monetary and exchange rate policies, and (ii) liberalization policies aimed at structural reform and growth.
Notwithstanding the comprehensive reform measures and the large official donor assistance (ODA) support, the economy experienced a difficult economic transition. The movement from administered prices to more flexible market-determined prices brought about fundamental changes in the way that businesses and households responded to economic conditions. Under the central planning system that prevailed before 1992, prices had no allocative function. The introduction of price liberalization measures improved the allocation of resources throughout the economy, but it created assimilation difficulties for many enterprises in the machinery industry and related activities, particularly in terms of product development and marketing strategies.
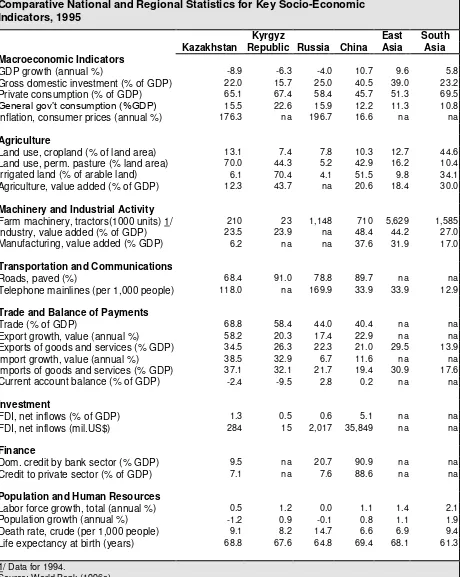
Between 1991 and 1995 real GDP declined by a cumulative 50 percent (see Figure 2.1), a phenomenon that was common to most former Soviet Union (FSU) countries. At the same time, unemployment and underemployment grew through early retirement, unpaid leave, late or partial payment of wages, and three-day workweeks. By 1995 Kazakhstan was in a position similar to other economies in transition (see Table 2.1).
Several factors associated with both external and internal adjustments contributed to the output decline:
The loss of access to resource transfers, first from the Soviet Union and then from
Russia, representing between 20 and 25 percent of Kazakhstan’s gross domestic
product (GDP) (World Bank, 1997a).
The severe decline in FSU trade and Kazakhstan’s heavy reliance on external
trade, whose value represented 40 to 50 percent of the country’s GDP, was dominated by inter-FSU trade, and Russia absorbed 60 percent of the country’s total exports.
The breakdown of the distribution system of the FSU, whereby three-fourths of
Kazakhstan’s exports were in the form of raw materials to FSU countries, and imports were mainly in the form of consumer goods.
Large output declines in Kazakhstan’s industrial products in the form of heavy
The Machinery Industry in Kazakhstan: Economic Conditions and Policies
Table 2.1
Comparative National and Regional Statistics for Key Socio-Economic Indicators, 1995
Kyrgyz East South
Kazakhstan Republic Russia China Asia Asia Macroeconomic Indicators
GDP growth (annual %) -8.9 -6.3 -4.0 10.7 9.6 5.8
Gross domestic investment (% of GDP) 22.0 15.7 25.0 40.5 39.0 23.2
Private consumption (% of GDP) 65.1 67.4 58.4 45.7 51.3 69.5 General gov’t consumption (%GDP) 15.5 22.6 15.9 12.2 11.3 10.8
Inflation, consumer prices (annual %) 176.3 na 196.7 16.6 na na Agriculture
Land use, cropland (% of land area) 13.1 7.4 7.8 10.3 12.7 44.6
Land use, perm. pasture (% land area) 70.0 44.3 5.2 42.9 16.2 10.4
Irrigated land (% of arable land) 6.1 70.4 4.1 51.5 9.8 34.1
Agriculture, value added (% of GDP) 12.3 43.7 na 20.6 18.4 30.0 Machinery and Industrial Activity
Farm machinery, tractors(1000 units) 1/ 210 23 1,148 710 5,629 1,585
Industry, value added (% of GDP) 23.5 23.9 na 48.4 44.2 27.0
Manufacturing, value added (% GDP) 6.2 na na 37.6 31.9 17.0 Transportation and Communications
Roads, paved (%) 68.4 91.0 78.8 89.7 na na
Telephone mainlines (per 1,000 people) 118.0 na 169.9 33.9 33.9 12.9 Trade and Balance of Payments
Trade (% of GDP) 68.8 58.4 44.0 40.4 na na
Export growth, value (annual %) 58.2 20.3 17.4 22.9 na na
Exports of goods and services (% GDP) 34.5 26.3 22.3 21.0 29.5 13.9
Import growth, value (annual %) 38.5 32.9 6.7 11.6 na na
Imports of goods and services (% GDP) 37.1 32.1 21.7 19.4 30.9 17.6
Current account balance (% of GDP) -2.4 -9.5 2.8 0.2 na na Investment
FDI, net inflows (% of GDP) 1.3 0.5 0.6 5.1 na na
FDI, net inflows (mil.US$) 284 15 2,017 35,849 na na Finance
Dom. credit by bank sector (% GDP) 9.5 na 20.7 90.9 na na
Credit to private sector (% of GDP) 7.1 na 7.6 88.6 na na Population and Human Resources
Labor force growth, total (annual %) 0.5 1.2 0.0 1.1 1.4 2.1
Population growth (annual %) -1.2 0.9 -0.1 0.8 1.1 1.9
Death rate, crude (per 1,000 people) 9.1 8.2 14.7 6.6 6.9 9.4
Life expectancy at birth (years) 68.8 67.6 64.8 69.4 68.1 61.3
1/ Data for 1994.
base, which translated into a virtual halt of enterprise support, and a drastic reduction in pension payments and other operation and maintenance expenditures of public services.
Price liberalization was completed by the end of 1995, except for state services and natural monopolies such as the power sector, oil and gas pipelines, and communications. Significant trade liberalization measures were also undertaken during the year, including the elimination of import and export licensing for most goods and the removal of export quotas. However, inflation remained high, output continued to decline, and a number of key indicators were substantially below those of other regions (see Table 2.1). For example, overall investment was low, particularly that originating from foreign sources, as was the amount of bank credit being channeled to the private sector. Government consumption, in contrast, remained high.
To alleviate the economy’s worsening
situation, the Government introduced a revised package of structural reforms in mid-1995. The Medium-Term Program for Deepening Reforms aimed to promote sustainable growth through privatization. The resulting economic stabilization measures, coupled with fundamental structural reforms, brought about an improvement in the market performance of the country. The majority shares of holding company subsidies were offered in mass privatization of state-owned enterprises, and many smaller subsidies were auctioned on the local level. Most state farms have since been privatized, and oil, gas and mineral reserves have been awarded to foreign investors.
The ultimate economic objective of the plan was the establishment of a self-sustained economic growth based on an open market economy, driven by high levels of foreign investment and domestic savings. As an extension of the stabilization policies adopted during the last three years, the new macroeconomic objectives aimed to further lower inflation, reduce the fiscal deficit, and strengthen the domestic currency. The focus of the plan, however, was the development of the real sectors of the economy, and the strengthening of institutions to support that expansion. Institutional strengthening mechanisms included improved ownership rights and the development of the legal system to protect those rights and those established under contract law. As part of that process, privatization was to be completed in the ago-industrial sector. The plan recognized the slow adjustment of agriculture and some other sectors to market-oriented activities. To counter this trend, efforts were to be made to revitalize those sectors by improving managerial skills and reducing corruption.
0.0 30.0 60.0 90.0 120.0
1992 1993 1994 1995 1996 1997
Figure 2.1
The Machinery Industry in Kazakhstan: Economic Conditions and Policies
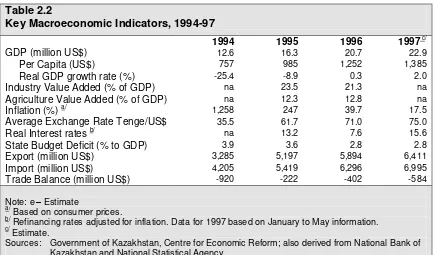
Table 2.2
Key Macroeconomic Indicators, 1994-97
1994 1995 1996 1997c/
GDP (million US$) 12.6 16.3 20.7 22.9
Per Capita (US$) 757 985 1,252 1,385
Real GDP growth rate (%) -25.4 -8.9 0.3 2.0
Industry Value Added (% of GDP) na 23.5 21.3 na
Agriculture Value Added (% of GDP) na 12.3 12.8 na
Inflation (%)a/ 1,258 247 39.7 17.5
Average Exchange Rate Tenge/US$ 35.5 61.7 71.0 75.0
Real Interest ratesb/ na 13.2 7.6 15.6
State Budget Deficit (% to GDP) 3.9 3.6 2.8 2.8
Export (million US$) 3,285 5,197 5,894 6,411
Import (million US$) 4,205 5,419 6,296 6,995
Trade Balance (million US$) -920 -222 -402 -584 Note: e–Estimate
a/Based on consumer prices.
b/Refinancing rates adjusted for inflation. Data for 1997 based on January to May information. c/Estimate.
Sources: Government of Kazakhstan, Centre for Economic Reform; also derived from National Bank of Kazakhstan and National Statistical Agency.
By 1996 the downward trend in the real value of GDP reversed itself and rose for the first
time since the country’s independence, albeit by a modest amount (see Table 2.2).
However, the fall in industrial output during the first half of 1997 has raised doubts about the sustainability of economic growth. To strengthen the country's growth and development, the Government recently introduced the Kazakhstan – 2030 plan, under which foreign investment is to be encouraged, particularly in the exploitation and processing of natural resources, infrastructure, communications and information technology. The new State Committee on Investment is charged with ensuring that appropriate policies are developed for foreign direct investment. The aim of the investment strategy it to move the country from a labor and resource-intensive economy to one based on capital and technology-intensive activities. In that way, it is expected that the share of agriculture and mining in the overall production of the economy will be reduced in favor of processing and high value-added activities.
To broaden the economic base and reduce the country’s vulnerability to external shocks,
2.2
The Macroeconomic Policy Environment
2.2.1 Monetary Stabilization Policies
Kazakhstan has established an increasingly sound macroeconomic policy framework that has contributed to a stable economic environment for investment in the machinery industry and other sectors of the economy. The National Bank of Kazakhstan (NBK) has maintained a tight monetary policy since the introduction of the national currency, the tenge, in November 1993. Early in 1994, government credits to clear sizable inter-enterprise arrears led to near hyperinflation and a sharp depreciation of the tenge (see Figure 2.2). After that, the Government and the NBK tightened monetary and fiscal polices to suppress inflation. The annual inflation rate fell to around 60 percent in 1995 and the real exchange rate returned to its level prior to clearing inter-enterprise arrears. Inflation was lowered from 1,160 percent in 1994 to less than 40 percent in 1996, and inflation in 1997 has been officially estimated at 17.5 percent.
The legacy of inefficient credit allocations left by the Soviet system has also given rise to a complex financial reform challenge. The National Bank of Kazakhstan has asserted much-needed control over the banking sector by establishing a bank supervision regime and by enforcing capital requirements. As a result, more than 130 insolvent banks have been closed during the past several years and those that remain are under-capitalized. To compensate for past bad loans and the time lag between inflation and interest rate adjustments, interest rate charges by the remaining banks tend to be substantially higher that the refinancing rate.
The high interest rates accompanying the NBK's tight monetary policy have attracted short-term capital inflows and stabilized the nominal exchange rate of the tenge relative to the US dollar. However, high interest rates have increased the cost of investment growth and created a more protracted recession. The need for both economic stability and greater access to low-cost financial capital that supports profitable activities through the extension of credit facilities from the banking system has raised fundamental questions about the design and implementation of the reform program. As Rodrick (1996) has pointed out, what constitutes appropriate structural reform programs rests on more tenuous theoretical and empirical grounds than the general consensus that exists on the rules for macroeconomic
Figure 2.2 Inflation, 1994-97 0 10 20 30 40 50
Jan-94 Jan-95 Jan-96 Jan-97
F ig u re 2 .3
R e fin a n c e R a te o f N B K , 1 9 9 5 -9 7
-1 0 0 0 1 0 0 2 0 0
J a n -9 5 J u l-9 5 J a n -9 6 J u l-9 6 J a n -9 7
The Machinery Industry in Kazakhstan: Economic Conditions and Policies
2.2.2 Fiscal Measures and Public Investment Policies
[image:33.612.107.550.268.522.2]Fiscal policy has operated under strong budget constraints since 1994. The consolidated fiscal revenue dropped from 37 percent of GDP in 1993 to 23 percent of GDP in 1995. In 1996 the Government adopted austere policies and succeeded in cutting the fiscal deficit from just under 7 percent of GDP in 1994 to 2.4 percent of GDP in 1996. Because of a serious drop in revenues from direct taxes, greater emphasis has been placed on the value added tax (VAT) and other indirect taxes. Since the National Bank of Kazakhstan has restricted its lending to cover the fiscal deficit, the Government is increasingly financing its deficit through the issuance of treasury bills. Longer maturities and a larger volume of bills are to be issued to augment access to financial capital, and in 1998 the Government intends to fully finance its budget deficit through treasury bills.
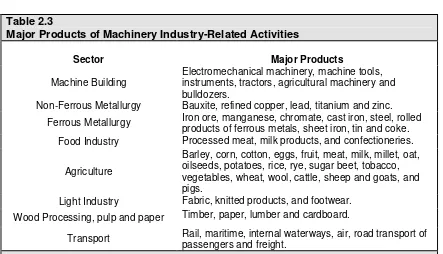
Table 2.3
Major Products of Machinery Industry-Related Activities
Sector Major Products
Machine Building
Electromechanical machinery, machine tools, instruments, tractors, agricultural machinery and bulldozers.
Non-Ferrous Metallurgy Bauxite, refined copper, lead, titanium and zinc. Ferrous Metallurgy Iron ore, manganese, chromate, cast iron, steel, rolled
products of ferrous metals, sheet iron, tin and coke. Food Industry Processed meat, milk products, and confectioneries.
Agriculture
Barley, corn, cotton, eggs, fruit, meat, milk, millet, oat, oilseeds, potatoes, rice, rye, sugar beet, tobacco, vegetables, wheat, wool, cattle, sheep and goats, and pigs.
Light Industry Fabric, knitted products, and footwear. Wood Processing, pulp and paper Timber, paper, lumber and cardboard.
Transport Rail, maritime, internal waterways, air, road transport ofpassengers and freight.
Source: Ministry of Energy, Industry and Trade.
2.3 Development of Key Productive Sectors
Kazakhstan’s vast hydrocarbon and mineral resources are regarded as the prime engine of
distribution of Kazakhstan's oil and gas to world markets, and it will considerably enhance the investment interests of foreign oil companies. There are also plans to build a 3,000-kilometer pipeline to the Xinjiang province of western China.
Despite the importance given to the energy sector, the Government recognizes that the development of high value-added products from the country’s vast agricultural and non -fuel mineral resources must become an essential part of its growth strategy. The industrial sector accounts for one-fourth of GDP and is mainly directed toward the country’s rich resource base, which includes petroleum, coal, iron ore, manganese, chrome ore, nickel, cobalt, copper, molybdenum, lead, zinc, bauxite, gold and uranium.
Table 2.4
Contribution of Selected Industries to Total Industrial Production, 1990-96 (percent)
1990 1993 1994 1995 1996
Electricity 5.2 14.4 18.9 16.4 15.2
Fuel 7.8 15.7 21.9 21.7 26.5
Ferrous Metallurgy 6.3 10.5 11.9 13.9 10.7
Non-ferrous Metallurgy 10.2 13.4 12 11.8 11.8
Machine Building and Metal Working 15.9 9.9 7.3 7.3 7.1
Chemical and Petrochemical 6.5 4 3.7 3.8 3.6
Forestry, Pulp and Paper 2.8 2.4 1 1 0.9
Construction Materials 5.7 5.2 4.1 3.8 2.9
Light Industry 15.5 5.8 3.8 2.6 2.4
Food Industry 16.2 11.4 9.9 13.3 14.6
Flour, Cereals and Animal Feed Industries 6.1 3.5 3.3 2.9 2.4
Total 100 100 100 100 100
Source: National Statistical Agency.
During the Soviet era Kazakhstan was transformed from an agriculture-based economy to a large scale-industrial complex and a developed agriculture and breeding system that supplied the Soviet Union with grain, livestock products, non-ferrous and ferrous metals, coal and oil. At the beginning of the 1990s Kazakhstan supplied 70 percent of the Soviet
Union’s production of lead, zinc, titanium and magnesium tin, 90 percent of its
phosphorus and chrome, and over 60 percent of its silver and molybdenum (Ayna, 1997).
Importance of Industry, 1996
Services 56% Other
6% Industry
25%
The Machinery Industry in Kazakhstan: Economic Conditions and Policies
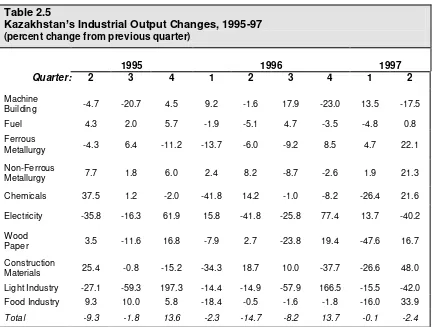
Table 2.5
Kazakhstan’sIndustrial Output Changes, 1995-97 (percent change from previous quarter)
1995 1996 1997
Quarter: 2 3 4 1 2 3 4 1 2
Machine
Building -4.7 -20.7 4.5 9.2 -1.6 17.9 -23.0 13.5 -17.5
Fuel 4.3 2.0 5.7 -1.9 -5.1 4.7 -3.5 -4.8 0.8
Ferrous
Metallurgy -4.3 6.4 -11.2 -13.7 -6.0 -9.2 8.5 4.7 22.1
Non-Ferrous
Metallurgy 7.7 1.8 6.0 2.4 8.2 -8.7 -2.6 1.9 21.3
Chemicals 37.5 1.2 -2.0 -41.8 14.2 -1.0 -8.2 -26.4 21.6
Electricity -35.8 -16.3 61.9 15.8 -41.8 -25.8 77.4 13.7 -40.2
Wood
Paper 3.5 -11.6 16.8 -7.9 2.7 -23.8 19.4 -47.6 16.7
Construction
Materials 25.4 -0.8 -15.2 -34.3 18.7 10.0 -37.7 -26.6 48.0
Light Industry -27.1 -59.3 197.3 -14.4 -14.9 -57.9 166.5 -15.5 -42.0 Food Industry 9.3 10.0 5.8 -18.4 -0.5 -1.6 -1.8 -16.0 33.9
Total -9.3 -1.8 13.6 -2.3 -14.7 -8.2 13.7 -0.1 -2.4
Source: Center for Economic Reforms,Kazakhstan Economic Trends–Second Quarter 1997.
The Government has been actively promoting the development of several key industries it has targeted. Under the earlier Medium-Term Program for Deepening Reforms, it has sought to modernize and expand existing infrastructure, especially transportation, electric power and telecommunications, to improve the legal and regulatory regime, and advance its privatization programs in order to establish a conducive environment for investment.
In rail transport, the Government’s aim under the plan has been twofold: (a) to expand
and modernize the rail network, and (b) to privatize railway-related services.
following the liberalization of prices of energy products, (ii) obsolete technologies and equipment, (iii) the absence of a rational organization of production, management and marketing, (iv) a disruption in demand after the breakup of the Soviet system, and (v) a shortage of operating funds and difficulties in obtaining bank credit. The higher cost of inputs and loss of markets have forced many enterprises to significantly reduce their output and in some cases to shut down completely.
The Machinery Industry in Kazakhstan: Economic Conditions and Policies
3.
REVIEW OF THE MACHINERY INDUSTRY
Contents:
3.1 Agroindustrial and Mining Activities
3.1.1 The Importance of Agriculture and Mining 3.1.2 Agricultural and Agroindustrial Performances 3.1.3 Mining and Mineral Processing Activities 3.2 The Machinery Industry
3.3 Transportation Characteristics
3.1 Agroindustrial and Mining Activities
3.1.1 The Importance of Agriculture and Mining
Kazakhstan’s agricultural and mining sectors are closely linked to the country’s rich
natural resources and arable land base. The country is endowed with oil, gas, and mineral resources, including gold, iron ore, coal, chrome, wolfram, and zinc, while its vast area of arable land is mainly oriented towards the production of basic products. Kazakhstan has a total land area of about 2.7 million square kilometers of which 221 million hectares or 75 percent are designated as agricultural land. Some 190 million hectares of agricultural land are semi-arid pastures, meadowlands or fallow, leaving 33 million hectares for cultivation. The geographic regions can be divided into the following five areas (UN, 1995):
The northern region is characterized by heavy industries and large-scale grain production. It covers an area of 600,900 square kilometers and is the leading economic region of the country in both agriculture and industry. Major railway and river arteries pass through the area, which is rich in coal, iron and copper ore, bauxite and gold deposits. Its industries include machine building, fuel and energy and mining activities. There are also enterprises involved in petroleum processing and in the production of ferroalloys and aluminum. The agro-industrial complex plays an important role in the region's economy. Grain crops account for three-quarters of the cultivated areas and annual production of wheat is about one-third of that produced in the United States. The region is also a major producer of sunflowers and flax and has a developed food-processing industry.
Table 3.1
Value Added of Selected Activities, 1993-96 (percent of GDP)
Sector 1993 1994 1995 1996
Machine Building 3.07 1.89 1.27
Agriculture 13.00 14.00 11.39
Other Industry: 31.00 25.92 21.82 Ferrous Metallurgy 3.26 3.08 3.01 Non- Ferrous Metallurgy 4.15 3.11 2.64 Food Industry 3.53 2.57 2.36 Light Industry 1.80 0.98 0.57 Wood Processing, Pulp and paper 0.74 0.26 0.15
Transport and Communications 6.00 7.89 9.46 Source: Ministry of Energy, Industry and Trade.
Thesouthern region is mainly oriented towards agricultural activities such as cotton, and it has some light industries and mining activities. It is the least economically developed region of the country. However, the agricultural base has spawned the development of food processing and light industries, and metallurgical, mining, chemical and machine-building industries have been established.
Thewestern regionhas much of the oil and gas industry. There are also large deposits of chromite, manganese, nickel and copper, and some of the leading industries include fish processing, mineral processing and fertilizers. The Tenghiz oil field holds reserves comparable to the largest petroleum fields in Saudi Arabia.
The eastern region covers 277,000 square kilometers with almost half of all the forested land of the country. It is rich in tin, tungsten and vanadium ores, and its industries produce non-ferrous metallurgy, machines, engineering equipment, power, and chemicals. It is also a food processing center and has light industries.
3.1.2 Agricultural and Agroindustrial Performances
The Machinery Industry in Kazakhstan: Economic Conditions and Policies
Table 3.2
Agricultural Production, 1993-96 (million tenge in 1994 prices)
Year
Total
Agricultural Total Crops
Crop on
Irrigated Lands Livestock
1993 139,222 94,664 na 44,558
1994 111,627 73,320 11,930 38,307
1995 84,064 55,073 18,109 28,990
1996 77,443 52,837 na 24,606
Source: National Statistical Agency.
Kazakhstan has been able to meet its domestic requirements, but grain exports have been severely reduced. Only in the areas where the private sector has played an important role, such as the production, distribution and marketing of fruits and vegetables, has the performance been favorable.
Kazakhstan’s agricultural sector is composed of three types of agricultural enterprises (USDA, 1996):
State agricultural enterprises accounted for more than 65 million hectares, or 30 percent of the total agricultural land in 1995. The number of collective farms (sovkhozes)not privatized had fallen to about 260 in 1996, so the land share of state enterprises has fallen to about 28 million hectares.
Non-state agricultural enterprises are collective enterprises that include joint-stock companies and small agricultural enterprises. Collective enterprises are associations of shareholders, similar to the former Soviet collective farm (kolkhoz) concept. These enterprises have had little, if any, reorganization in the management and operational activities. These enterprises and the joint-stock companies retain about three-quarters of the land and assets of the privatized collective farms. As such, about three-quarters of agricultural production assets have not changed their economic and social status. Small agricultural enterprises average about 4,000 hectares in size and are significantly larger than peasant farms. Many of these enterprises have been formed around structural units of the former collective farms and are, in fact, another form of collective enterprise.
Table 3.3
Yields of Selected Agricultural Crops, 1990-96 (100 kilos per hectare)
Year Grain
Crude Cotton
Cotton Fiber
Sugar
Beet Sunflower Potatoe s
Vegetables
1990 12 27 9 238 8 113 154
1993 10 18 … 123 3 94 106
1994 8 19 … 77 3 94 104
1995 5 20 … 91 3 84 101
1996 7 17 … 105 2 88 96
Source: National Statistical Agency.
Restructuring efforts have produced large reductions in employment in all sectors, but particularly in agriculture. Based on officially registered employment in large and medium-size enterprises, exclusive of collective farm workers, employment in agriculture fell by 55 percent between 1995 and 1996 (Center for Economic Reforms, 1997). In industry, the decline was more modest (11.5 percent) during the same period.
Overall, registered unemployment has increased moderately to about 2 percent of the labor force in 1996. Using a broader definition of unemployment including involuntary leaves and part-time furloughs, that rate would stand at about 12 percent.
Several factors have contributed to the overall sharp decline in agricultural production:
droughts and other natural disturbances,
the absence of any substantive restructuring of farms following their privatization, the lack of financial liquidity and access to credit by farm units,
inadequate water supplies and the salinization of soil, inefficiencies in the market distribution systems, shortage of spare parts and fuel,
the lack of liquidity and credit facilities, and Figure 3.1
Value Added of Agriculture. 1992-97
0 5 10 15 20 25 30
1992 1993 1994 1995 1996 1997
(%
o
f
G
D
P
The Machinery Industry in Kazakhstan: Economic Conditions and Policies
Table 3.4
Composition of Agricultural Processing Industries, 1994-96 (percent)
1994 1995 1996
Total 100 100 100
Food Industry 32.4 38.0 48.1 Meat and Milk Industry 36.9 33.3 25.7 Cereals and Animal Feed Industries 23.4 20.9 16.9 Light Industry 5.1 5.7 7.3 Fish Industry 2.2 2.0 1.5
Source: National Statistical Agency.
a deterioration in the terms of trade resulting from rapid rise in prices of agricultural machinery and equipment, fertilizers and fuels relative to those of agricultural commodities.1
The absence of liquidity has resulted from the financial losses suffered by farm enterprises, while the lack of credit flows has been due to the high interest rates discussed in the previous chapter. According to the State Committee on Statistics and Analysis, over 75 percent of agricultural enterprises were unprofitable in 1995. Moreover, according to the USDA (1996), the total past due loans in 1996 amounted to 71 billion tenge, of which 4.5 billion tenge represented taxes payable, 39 billion tenge were accounts payable for goods and services (mainly in the form of fuel and electric energy), and 10 billion tenge represented debt on bank loans.
The lack of access to inputs has also had a dramatic effect on productivity levels. The contraction of production by the fertilizer industry, combined with a sharp reduction of fertilizer supplies from Russia has limited the application of fertilizers to irrigated crops such as vegetables and cotton. Only 4 percent of cereals, 14 percent of potatoes, and 25 percent of vegetables are now being grown with fertilizers (USDA, 1996). Trade in fertilizer has also declined. Exports of fertilizers are now only about 10 percent of the levels prevailing at the end of the Soviet era. A similar situation exists with
agro-chemicals because of Kazakhstan’s reliance on supplies from other FSU members under
the previous centralized planning system. That reliance has left the country without its own production of herbicides and pesticides.
1
According to data from the National Statistical Agency (1997), the following were the year-to-year percentage changes in the producer and wholesale prices of the agricultural and industrial sectors:
1992 1993 1994 1995 1996 1997 (6mths) Agriculture 1,032% 776% 1,888% 257% 161% 114%
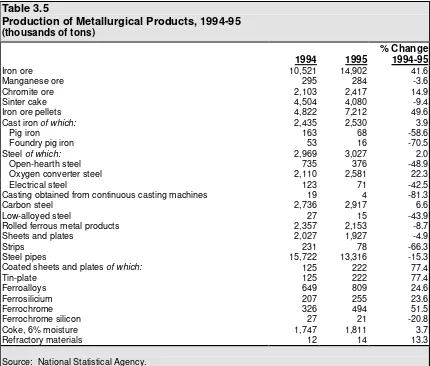
Production of Metallurgical Products, 1994-95 (thousands of tons)
1994 1995
% Change 1994-95
Iron ore 10,521 14,902 41.6
Manganese ore 295 284 -3.6
Chromite ore 2,103 2,417 14.9
Sinter cake 4,504 4,080 -9.4
Iron ore pellets 4,822 7,212 49.6
Cast ironof which: 2,435 2,530 3.9
Pig iron 163 68 -58.6
Foundry pig iron 53 16 -70.5
Steelof which: 2,969 3,027 2.0
Open-hearth steel 735 376 -48.9
Oxygen converter steel 2,110 2,581 22.3
Electrical steel 123 71 -42.5
Casting obtained from continuous casting machines 19 4 -81.3
Carbon steel 2,736 2,917 6.6
Low-alloyed steel 27 15 -43.9
Rolled ferrous metal products 2,357 2,153 -8.7
Sheets and plates 2,027 1,927 -4.9
Strips 231 78 -66.3
Steel pipes 15,722 13,316 -15.3
Coated sheets and platesof which: 125 222 77.4
Tin-plate 125 222 77.4
Ferroalloys 649 809 24.6
Ferrosilicium 207 255 23.6
Ferrochrome 326 494 51.5
Ferrochrome silicon 27 21 -20.8
Coke, 6% moisture 1,747 1,811 3.7
Refractory materials 12 14 13.3
Source: National Statistical Agency.
In the livestock industry, animal numbers and productivity levels have fallen sharply. The lack of liquidity of most farms, the fall in livestock numbers, inadequate machinery and equipment, and the general decline in demand for livestock products have all contributed
to this situation. As a result, much of the country’s farming structure is reaching the point
where it will not be able to maintain operations.
[image:42.612.108.538.71.437.2]The Machinery Industry in Kazakhstan: Economic Conditions and Policies
3.1.3 Mining and Mineral Processing Activities
Mining activities are largely directed towards extraction and few processing activities take place within Kazakhstan since traditionally, these activities were closely linked to processing activities in other FSU countries, and especially Russia. Since independence in 1991, however, trade has increasingly been redirected toward markets outside the Newly Independent States (NIS), notably China and Germany. Kazakhstan has one-third of the world's chromium and manganese deposits and it has substantial reserves of other minerals: 50 percent of the former Soviet Union's tungsten and lead, 40 percent of its zinc and copper, and 25 percent of its bauxite, silver and phosphorus. Kazakhstan is also the largest NIS producer of beryllium, tantalum, barite, uranium, cadmium, and arsenic.
However, more than half of the
country’s mining, processing, and
smelting enterprises use outdated equipment and are in need of replacement. Although the situation in the mining and mineral processing industry is not as severe as in the
country’s agriculture and ago-industrial
activities, enterprises operating in this area lack expertise in operating within a free market system. The Kazakhstan mining industry operated under a central planning system and lost some of its traditional markets with the breakup of the Soviet Union. There are a number of business opportunities in mining and mineral processing activities, notably in infrastructure development, mine and plant reconstruction, service procurement, and machinery equipment supplies.
Table 3.6
Output Index of Selected Industries, 1990-96 (1985=100)
1990 1991 1992 1993 1994 1995 1996
Total of Industrial Sector 116.9 115.5 97.9 83.9 60.1 52.1 48.7
All Machinery 110.7 113.4 94.9 81.0 50.9 36.8 34.4
- Tractors and agr.mach. 88.2 85.6 56.8 42.4 25.0 15.9 16.5
- Construction machinery 102.0 91.9 63.3 46.8 24.1 12.8 20.9
Light and food industries 171.1 186.8 178.2 109.2 148.4 92.9 69.0
Energy 131.5 200.4 139.5 135.6 123.4 72.4 76.2
Metallurgy 125.5 142.4 159.1 135.9 146.0 211.4 198.7
Mining 129.7 135.3 137.1 83.6 85.5 55.0 39.1
Chemicals 150.8 156.8 137.4 101.0 79.1 72.9 59.1
Appliances 131.3 143.4 123.6 119.2 74.9 56.6 58.2
[image:43.612.109.575.481.682.2]Transport vehicles 108.6 126.8 104.7 58.0 36.5 34.7 37.7 Source: Ministry of Energy, Industry and Trade.
Figure 3.2
Value Added of Industry. 1992-97
0 20 40 60 80
1992 1993 1994 1995 1996 1997
(%
o
f
G
D
P
3.2
Machinery Industry
One of the largest contractions of production during the transition period has occurred in the machine-building industry. In an effort to adjust to changes that followed the disintegration of the centrally planned economy, a number of enterprises attempted to introduce new products in the early years following independence. In 1993, for example, 73 enterprises started producing more than 200 new goods: buses, transport trucks, dump trucks, trolley buses and mini-tractors (UN, 1995). However, investment has continued to decline and new forms of production have usually failed.
The contraction of the industry has been associated with both the reduction in the derived demand for machinery equipment from the mineral processing and agro-industrial activities, and with supply shortages in the industry itself. The trend growth rate of machinery output was the same as that of total industrial production (both -1.6 percent a year), suggesting that the demand for
machinery products followed industry’s overall contraction of demand for intermediate
products such as machinery and equipment. However, short-term movements of machinery production have differed from those of industrial output. These differences reflect supply adjustments of the machinery industry to support programs, planned output changes that have been unrelated to changing market conditions, production disturbances associated with interruptions in electricity and other utility services, and shipment delays of raw material and intermediate inputs.
Kazakhstan’s capacity to fulfill its agricultural machinery needs is limited. In the past, most of the machinery was imported from other countries and about 15 percent of domestic requirements was met by local manufacturers. As a result of the decline in agricultural activities and the lack of farm liquidity, sales of agricultural machinery have nearly stopped. Equipment inventory has also suffered. The number of operational tractors has declined dramatically since 1990, as has the number of harvesting combines and seeders. Given that excessive investments in equipment and machinery were typical for a command economy, the decline in numbers has been tolerable until recently. Machines have been broken up to provide spare parts, but this process is approaching a saturation level and there is an immediate need for new tractors and harvesting combines, as well as replacement parts. However, until farmers are able to obtain the necessary financial resources to purchase the needed equipment either domestically or from abroad, the situation is likely to remain critical.
Figure 3.3
Machinery Output versus Total Industrial Production (1995.1 = 100)
60.0 90.0 120.0
The Machinery Industry in Kazakhstan: Economic Conditions and Policies
Table 3.7
Output of Basic Machinery Products, 1990-96 (volume and value)
Units 1990 1993 1994 1995 1996
Instruments and Spare Parts '000 tons 1,092,461 239,902 147,106 199,956 179,062 Metallurgical Equip,of which
Metal cutting machines units 2,578 1,193 42,957 114 na
Press-forging machines units 1,173 730 434 269 127
Rolling Stock Machines '000 tenge 4,353,819 242,125 259,530 605,136 688,604 Chemical Equip and Spare Parts '000 tenge 389,056 15,430 13,654 36,414 239,681 Agricultural Machines,of which
Agricultural machinery '000 tenge 5,567,081 854,420 435,832 299,021 257,666 Livestock and feed production
machinery '000 tenge 3,637,553 402,371 156,648 154,332 80,323
Source: National Statistical Agency.
This situation continues to characterize the present state of the industry. During the first nine months of 1997, the National Statistical Agency (1997a) reported shortfalls in the production of most major products of the machinery industry. Overall output for the period was more one-third lower than the level of a year earlier. As in the past, the large shortfall was due to material shortages and the lack of solvency of customers. Lower production in downstream industries caused large cutbacks in the production of alkaline and lead storage batteries for automobiles, power capacitors, and low-capacity electric motors for home appliances. There were also large reductions in the output of machine tools, press-forging machines and spare parts. No production occurred in metal-cutting machine tools in Almaty and the West Kazakhstan oblast, nor was there any production of equipment for processing of polymer materials and equipment for light industry.
There have been very few sales of new tractors or harvesting combines, compared with annual sales of around 30,000 tractors and 7,000 harvesting combines at the end of the Soviet era. The number of tractors available has declined from 248,712 to 142,383 units between 1985 and 1996 (National Statistical Agency, 1997b). Moreover, the inability to replace machinery has inevitably resulted in a marked deterioration of the existing equipment inventory. More recently, the performance of the industry has been mixed. During the first nine months of 1997 output of tractor drills and mowers increased, while that of cultivators, tractor plows, tractors, disc harrows and bulldozers decreased. Tractor-trailers were not produced because of the shortage of financial capital to purchase material input. Disc harrows, tractor drills and electrical shearing machines were also not produced in some oblasts because of fund shortages.
0 100 200 300 1 9 8 0 1 9 8 5 1 9 9 0 1 9 9 1 1 9 9 2 1 9 9 3 1 9 9 4 1 9 9 5 1 9 9 6 Figure 3.4
Table 3.8
Production of Major Types of Machinery, 1994-95 (volume and value)
Unit 1994 1995
% Change 1994-95
Volume:
Power transformers: units 2,608 1,376 -47.2 '000 kWa 371 157 -57.8 Power capacitors '000 kVa 333 139 -58.3 Storage batteries (lead) tons of lead 20,586 16,749 -18.6 '000 amp-hrs 585,984 478,942 -18.3
of which:
Automobile batteries units 665,989 470,210 -29.4 Alkaline batteries '000 amp-hrs 1,281 564 -56.0 Metal-cutting machine tools units 429 57 -86.7 Press and forge machines units 434 269 -38.0 Centrifugal pumps units 7,658 5,713 -25.4 Rolling bearings units 599,000 546,000 -8.8
Excavators units 32 -
-Bulldozers units 695 521 -25.0
Tractors units 1,988 1,803 -9.3
Agricultural machines
of which:
Tractor plows units 3,012 283 -90.6 Tractor drills units 943 349 -63.0 Tractor cultivators units 1,125 82 -92.7 Tractor mower units 4,995 2,030 -59.4
Value ('000 tenge):
Metal cutting machine tools 54,217 16,938 -68.8 Press-forging machines 59,411 99,406 67.3 Instruments, automation devices, spare parts 147,196 199,956 35.8 Rolling machines 259,530 605,136 133.2 Chemical equipment and spare parts 13,654 36,414 166.7 Spare parts for:
Automobiles 190,760 200,320 5.0
Agricultural machines 250,498 546,606 118.2
Tractors 287,092 406,460 41.6
Livestock and animal feed production machines 57,759 165,837 187.1 Machines and equipment for livestock and animal
Feed production
156,648 42,019 -73.2 Agricultural machines 435,832 299,021 -31.4