Journal of Geographic Information System, 2014, 6, 453-466
Published Online October 2014 in SciRes. http://www.scirp.org/journal/jgis http://dx.doi.org/10.4236/jgis.2014.65039
How to cite this paper: Balogun, T.F., Okeke, H. and Chukwukere, C.I. (2014) Crime Mapping in Nigeria Using GIS. Journal of Geographic Information System, 6, 453-466. http://dx.doi.org/10.4236/jgis.2014.65039
Crime Mapping in Nigeria Using GIS
Toju Francis Balogun*, Henry Okeke, Christain Ifanyin ChukwukereDepartment of Geography and Regional Planning, University of Benin, Benin City,Nigeria Email: *tobalogun@yahoo.com
Received 10July 2014; revised 8August 2014; accepted 5September 2014
Copyright © 2014 by authors and Scientific Research Publishing Inc.
This work is licensed under the Creative Commons Attribution International License (CC BY). http://creativecommons.org/licenses/by/4.0/
Abstract
This paper first examines crime situation in Benin metropolis using questionnaire to elicit infor-mation from the public and the police. Result shows that crime is on the rise and that the police are handicapped in managing it because of the obsolete methods and resources at their disposal. It also reveals that members of the public have no confidence in the police force as 80% do not re-port cases for fear of exposure to the informant to the criminal. In the light of these situations, the second part of the paper looks at the possibility of utilizing GIS for effective management of crime in Nigeria. This option was explored by showing the procedural method of creating 1) digital lan-duse map showing the crime locations, 2) crime geo-spatial database, and 3) spatial analysis such as query and buffering using ILWIS and ArcGIS software and GPS. The result of buffering analysis shows crime hotspots, areas deficient in security outfit, areas of overlap and areas requiring con-stant police patrol. The study proves that GIS can give a better synoptic perspective to crime study, analysis, mapping, proactive decision making and prevention of crime. It however suggests that migrating from traditional method of crime management to GIS demands capacity building in the area of personnel, laboratory and facilities backed up with policy statement.
Keywords
Crime, Hotspot, Geospatial Data, Database Design, Conceptual Modeling, Logical Design, Physical Design, Entity Relationship, Relationship Enforcement
1. Introduction
occasioned by those inimical visits, have been pervasive and had left an indelible mark on our national psyche and societal tranquility. Worse still is the fact that the law enforcement agencies are yet to be computerized for effective record keeping, analysis of cases, easy reference cum retrieval and storage of information to help strategize and adequately plan the combating and eradication of crimes in general. As an entity, crime has spatial attributes, i.e. location, time and process. In essence, availability and quick access to timely and up-to-date spa-tial information about crime-prone areas, to the law enforcement agencies, will in no small way contribute to ef-fective policing of the entire state. Policing methods in Nigeria are still manual and un-automated. The old filing system of record-keeping is still in use. This limits the force from having the technological edge over the ever increasing technology sophistication of the criminals.
Crime mapping has long been an integral part of the process known today as crime analysis. The use of maps in crime study has been traced back to at least the year 1900 (New York City Police Department). Most devel-oped nations have migrated from the “pin on maps” to the use of computer GIS. Unfortunately, most of the de-veloping nations, including Nigeria, still utilize analog and outdated file systems. In most cases, police opera-tions are carried out based on intuition, tip-off information and the simple “trial-and-error” method. Furthermore, the old pin maps were useful for showing where crimes occurred, but they had serious limitations because as they were updated, the prior crime patterns were lost. The maps being analogs are usually not easy to manipulate. In addition, pin-maps could be quite difficult to read when several types of crimes, usually represented by pins of different colours, are mixed together. Pin maps occupied a lot of space, wasted a lot of time, and were inca-pable of developing a logical, national database. Based on these disadvantages, the need to carry out research on a better way to map crime and manage it becomes paramount. This study therefore seeks to explore the capabil-ity of GIS in crime mapping, using Benin metropolis as a case study.
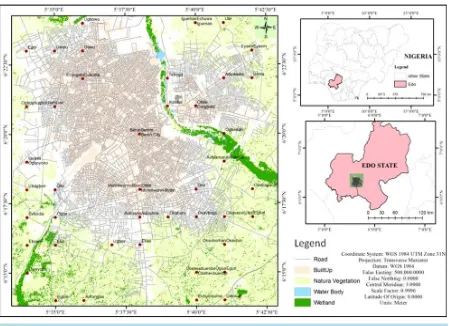
2. Study Area
[image:2.595.90.539.387.713.2]Based on the city historical, political, administrative and nodal attributes, Benin City (Figure 1) has witnessed an
T. F. Balogun et al.
arithmetic progression in growth, size, population and civilization. Simultaneously it has also witnessed a cor-responding and progressive crime growth. In Benin metropolis, crime is high, occurring in different forms, thus stimulating the need to tackle it before it expands beyond control. It is no longer hidden that the cities are con-ducive settings for criminal activities, since it provides the anonymity required for individual crime, and the space for a specialized and organized underworld. The increasing social sophistication and modernization of the country, the growing inequality, and the continuous rise in unemployment (especially among young school leavers and university graduates) have greatly accentuated urban crimes in recent times. Kidnapping, for in-stance, is on the increase in Benin City. Despite trying their best, the law enforcement agencies are becoming frustratingly helpless as the criminals become more sophisticated on a daily basis. As a result, the citizens daily grapple with the fear of the unknown and insecurity of lives and property with little or no hope of remedy. Un-fortunately, at present, there is little or no application of even the inadequate pin-on-maps in some stations in Benin City, let alone the use of GIS. The non-application of GIS and geo-database in the fight against crime in this technological age is costly and counter-productive [2].
3. Conceptual Framework
Crime theories are critical for useful crime mapping because they aid in the interpretation of data [3] and pro-vide guidance as to what actions are most appropriate. Therefore, understanding how crime theories account for hotspots is critical. Several theories of crime and disorder concentrations (hotspots) exist. Crime theory explains different types of crime phenomena that occur at different geographic levels. Each level requires different units of analysis for the things being examined. One can think of units as corresponding to the geographic area being depicted on map points, lines or polygons [4]. Some theories explain point concentration of crime while others help explain linear concentrations of crime or hotspot crime polygons.
Urban crime has measurable spatial and temporal distribution that requires urgent attention of the specific arm of government responsible for maintaining law and order [5] which is usually the police and the judiciary. Knowing “what” is “where”, “where” is “what” and “when”, is the task of GIS, the need for which therefore cannot be overemphasized. Crime (what) is a spatial entity which has a geographical location (where) and a time (when) it was committed. With the spatial and non-spatial integration capability of GIS, various crime prone ar-eas can be mapped to provide timely and up-to-date information that is infinitely superior to the normal paper records of events by the law enforcement agencies.
Crime is a human phenomenon; therefore its distribution in space is not random. Crime analysis is important because it helps to identify the different geographic patterns in criminal behavior [6]. GIS software can create a single visual output that combines multiple data layers into a meaningful output. The analysis between crime and other factors, for example roads, housing, police station, and other structures, can lead to the knowledge of place and crime relationship based on the conditions considered. GIS allows integration and analysis of data to identify, apprehend and prosecute suspects; it aids more proactive behaviour through effective allocation of re-sources and better policy setting [7]. For example, thematic maps could be used to predict likely sensitive points/areas in hotspot area. Data on surface communication, telephone communication and demographic pat-tern can all be used to predict sensitivity of a locality in relation to a given time [8].
GIS is pervasive in its use, ranging from identification of illicit cultivation of poppy seeds in Afghanistan with satellite imageries [9] to measuring the geographic displacement of drug offenders [10] and monitoring the ef-fects of law enforcement strategies on nuisance bar activity [11]. The history of crime mapping dates back to 1830 [12] when sociologists and criminologists had written hundreds of spatially oriented studies of crimes and intelligences. These studies could be divided into three schools of thought: the cartographic/geographic school, the typological school, and the social ecology school [4] [13]-[15].
4. Methodology
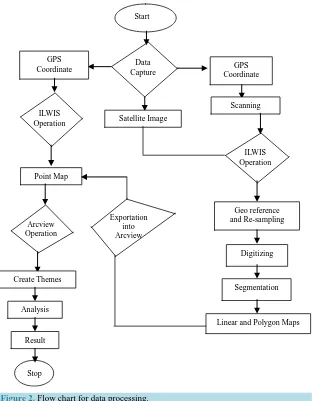
Two methods were adopted in this study. The first was the administration of questionnaires. A total of 66 ques-tionnaires were administered to the Police Public Relation Officers (PPRO) while a set of 250 quesques-tionnaires were administered to gather information from the member of the public. This was done to assess the crime situa-tion in the metropolis. The second was a stepwise method (Figure 2) of how GIS could be used to manage crime using the spatial and attribute data collected from the field.
Start
Data Capture GPS
Coordinate GPS
Coordinate
Scanning ILWIS
Operation Satellite Image
ILWIS Operation
Point Map
Arcview Operation
Create Themes
Analysis
Result
Stop
Exportation into Arcview
Geo reference and Re-sampling
Digitizing
Segmentation
[image:4.595.157.469.82.483.2]Linear and Polygon Maps
Figure 2. Flow chart for data processing.
• Dataon drug related crimes and their locations from the National Drug Law Enforcement Agency. • 2006census figures, housing data and satellite images from the National Population Commission. • Landuse and road guide maps from the Ministry of Lands and Survey.
A hand held high precision (±5 m) GPS (Gamin GPS 12 × L, 12 channel) and a digital camera (Nikon 4200 mega pixels) for real time pictorial coverage of the hotspots and police station (where possible).
5. Result and Discussion
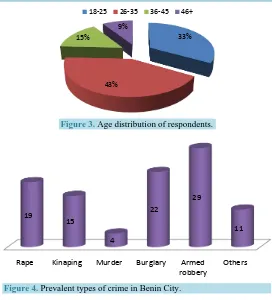
Figure 3 shows that 67% of the respondents are above 25 years. 23% are married, 61% single and 16% others (separated/widow-widower). All the respondents have lived within the study area for more than 3 years, mean-ing that by virtue of their long stay they are acquainted with their immediate environment as far as crime is con-cerned. In terms of occupation, 49% of the respondents are students mostly from tertiary institutions and this group is a very volatile set, on the grounds that they constitute the bulk of the non-working population and are subject to all sorts of possible incriminating activities as a result of needs, peer activities and age. The other groups are employed in one form of occupation or the other.
5.1. Crime Rate and Pattern
T. F. Balogun et al.
[image:5.595.236.391.84.189.2]Figure 3. Age distribution of respondents.
Figure 4. Prevalent types of crime in Benin City.
different types of crimes experienced in Benin metropolis. The analysis shows that robbery singly accounts for about one third (29%) of the total number of identified crimes. This was closely followed by burglary (22%), rape (19%) kidnapping (15%) murder (4%) and others, which include pickpocketing (11%). The implication of this result is that crime is endemic in the metropolis and as such, efforts should be directed at checkmating it.
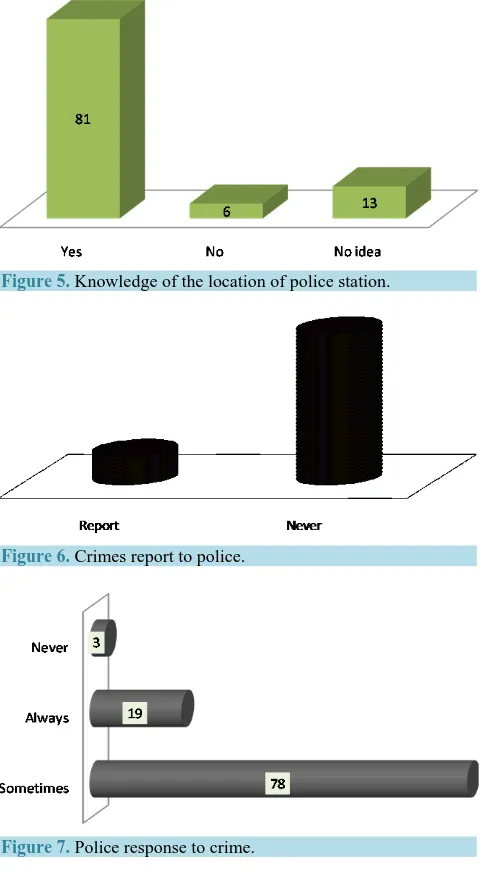
81 percent of people who have been crime victims have knowledge of the location of police station (see Fig-ure 5); 84% of the victims did not report crime incident to the police for a number of reasons (see Figure 6). Reasons provided for not reporting crime to the police include: the fear of being exposed by the police through connivance with criminals which is common; perceived police often apparent insensitivity to duty, and the po-lice lack of arms, intelligence, integrity and logistics to effectively combat crime in the metropolis.
It is not surprising therefore, that the effort to curb the menace of crime is still not receiving the needed sup-port it deserves as most crimes are left unresup-ported. The survey equally revealed that among those who have re-ported crime, only 19% agreed that the police always respond. 78% agreed that the police sometimes come to their rescue, while 3% agreed that police never respond to distress calls (see Figure 7). The study also revealed that 42% of the respondents agreed that the police have carried out raids (particularly the Special Anti Robbery Squad (SARS)) as a way of combating crime while the rest 58% have different opinions. Sequel to the above, about 96% of the people have resorted to organized local security outfit know as “vigilante” while the rest have contracted local security outfits to prevent such crimes as robbery and burglary in their area. Regardless of the above measures, the research also revealed that crime rate is still on the increase especially with news of fresh attacks on banks, people, and even the police.
Interview with different police officers revealed that positive efforts are being made by the police to eradicate crime regardless of the many impediments it is faced with. These efforts translate into the following specific measures: Encouraging research into crime thorough investigation of crime; protecting the anonymity of infor-mants; periodic publication of crime data; road block checking, periodic patrol, raid and arrest of suspects. In all these current efforts, there is no application of geo-information technology.
5.1.1. Map Scanning and Conversion
The first step is the conversion of the existing thematic road map covering the study area from analogue to digi-tal. The road map was scanned in JPEG format in the Corel photo paint, and was exported into adobe photoshop
18-25 26-35 36-45 46+
33%
43% 15%
9%
Rape Kinaping Murder Burglary Armed
Figure 5. Knowledge of the location of police station.
Figure 6. Crimes report to police.
Figure 7. Police response to crime.
7 where it was converted to the TIF format that is compatible with ILWIS. After the conversion, the map in TIF format was imported into ILWIS environment for geo-referencing.
5.1.2. Geo-Referencing
The GPS gave UTM coordinates directly which was used for geo-referencing on the scanned image to bring a relationship between the scanned image to actual representation on the ground, using the point method of identi-fiable points on ground with GPS coordinates and its corresponding location on the map in ILWIS environment. The result of the geo-referencing gave a sigma of 0.0025.
5.1.3. Digitizing
T. F. Balogun et al.
5.1.4. Creation of Point Map
The GPS coordinates obtained were entered into Arcmap-Arcinfo environment through point map operation. Here domain class and name were created for each point. Two-point maps were created for the hotspots (red) and the other for the police station (black). The point map was now superimposed on the digitized road map. Some of the points fell outside the digitized area without the network. This calls for the satellite image so as to correct this error. The image was imported into ILWIS via geo-gateway using bands 7, 5, 4 for the false color composite enhancement, where linear features are better shown. The image was geo-referenced and re-sampled. A sub-map was then cut out to avoid loading the entire image all the time and to minimize space in the system. On screen digitizing of linear features in a separate layer was carried out on the image to update the digitized map. Note that only prominent features could be picked, such as the major roads and river. The minor roads could not be picked due to the low resolution of the satellite image. Editing was carried out for self-overlap and intersection. The two layers were merged through a glue operation and break dependence tool. A uniform coor-dinate system and domain name was required for this operation. The digitized map was now ready for importa-tion into Arcmap environment where analysis was carried out.
5.1.5. Database Design
Database consists of some collection of persistent data that is used by the application systems of some given en-terprise [16]. A database is a repository, capable of storing large amounts of data [17]. Geospatial data handling process entails a demand supply processing of a phenomenon (crime) in the world, applying (GPS) technology to acquire survey data, creating a (relational) database via choice of a model at the conceptual level, and apply-ing technology, (software & hardware) cum methodology on processapply-ing (analysis). The results are in form of report, tables, graphics, intelligent maps and database, which should be sharable concurrently by many users, possess optimized storage, has integrity and should be queried optimally. However, in the creation of database in the context of geo-informatics, the concept of space is not taken for granted. Space concept addresses the world around us and our immediate environment. A GIS database is made up of two parts: a) The components of a da-tabase, and b) the design phases of the database [18]. The two (a and b), are composed of five basic components, made up of geographic or location entities, non-geographic or attribute entities, topological relationship, enter-prise rules and procedure to be followed. There are different phases in the creation of database which is followed in this work. These include the design phase, conceptual design, logical design and physical design phase.
5.1.6. The Design Phase
The design phase of the database has four parts, which are: 1) view of reality, 2) conceptual or data modeling, 3) data structure or logical design, and 4) physical design or file structure.
5.1.7. View of Reality
This is the mental abstraction of reality. It is the perception of the phenomena, as it actually exists, including all aspects, which may or may not be perceived by individuals. In this study, the reality as far as effective commu-nity policing is concerned, was abstracted. A vector representation scheme of the crime hotspots points and po-lice station location (points) were therefore adopted as the primitive.
5.1.8. Conceptual Design Phase
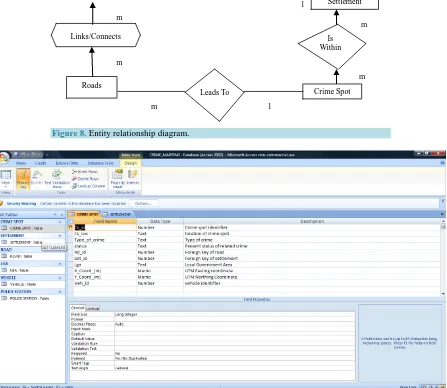
The conceptual modeling is a human conceptualization of reality of the entire information content of the data-base. Here, the decision on how the views of reality will be presented in a simplified manner and satisfaction of the information requirements of the project must be made. The basic question here is, what method do you in-tend to implement in your ideal or view, without losing the originality of the reality? Thus, the question of what, when and where of phenomenon (crime) could easily be answered by GIS operation. In this study the basic enti-ties identified are, police stations, settlements, crime spots, roads, local government area (or city area). These entities are conceptually related as schematized using Microsoft vision 2007 in the entity-relationship diagram (see Figure 8).
5.1.9. Logical Data Model
The relational data model which has an advantage of being amendable to structural query language (SQL) was adopted.
5.1.10. Creating Relational Tables in Microsoft Access
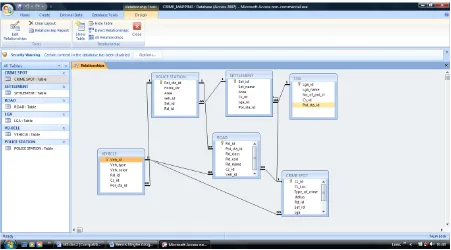
The relational tables were created, populated and relationship was enforced by the introduction of common keys which was either a primary or foreign to link the tables together. All these were done within Microsoft Access environment. See Figure 9 for the entered relationship among the tables.
1
m Police Area
Command Hqts
Police Divisional Stations
m
Area Within
Links/Connects
m
Roads
Leads To
m
1
1
LGAS
1
Is Location
Within
m
Settlement
m
Is Within
m
1
[image:8.595.141.483.198.430.2]Crime Spot
Figure 8. Entity relationship diagram.
[image:8.595.92.539.304.692.2]T. F. Balogun et al.
5.1.11. Physical Model
This defines the actual physical database scheme. The final stage is definition of the actual physical database scheme that will hold the database values. This is usually created using the DBMS software data definition lan-guages. This model also specifies and addresses the issue of implementation hardware and software for the pro-ject study.
Analysis functions of GIS software use spatial and non-spatial attribute data to answer question about the real world. This aspect examines the spatial pattern of crime in Benin metropolis. To achieve the above, results of analysis were presented using a created database to visualize the various applicable route networks, proximity and other relationships between socio-economic activities. Executed analysis to accomplish the stated objectives include: buffer zone generation; crime distribution pattern; network analyses and spatial proximity of road.
5.1.12. Crime Analysis
Crime is a human phenomenon, generating data for it requires the integration of the people and the existing se-curity outfits (police) within the geographical location where the study is carried out.
5.1.13. Buffer Zone Generation, Queries and Crime Pattern Analyses
Various queries were carried out to examine the spatial pattern of criminal activities in the metropolis so as to visualize and provide a useful suggestion on how to eradicate the menace of crime in the society. The following queries were carried out:
1) Single buffer (500 m) around hotspots for robbery and rape. 2) Single buffer (500 m) around hotspots for burglary.
3) Single buffer (500 m) around hotspots for cultism and rape.
4) Single buffering (500 m) around hotspots for socio-economic activities.
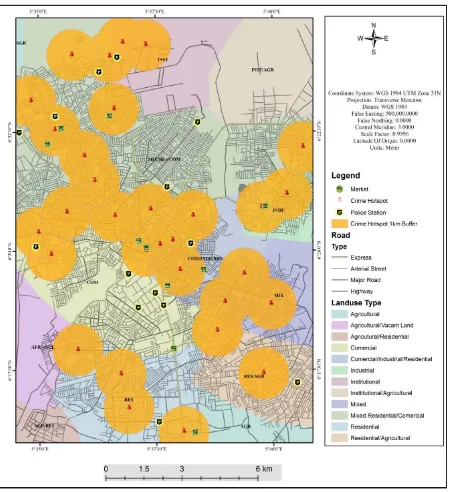
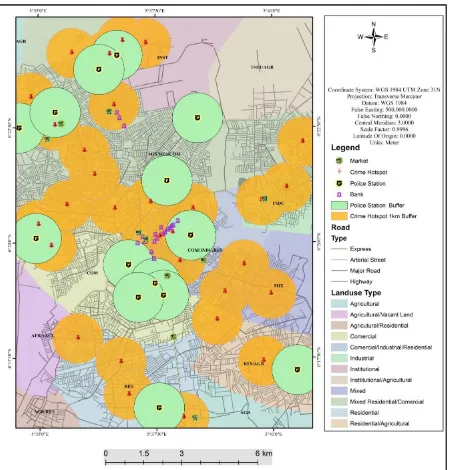
[image:9.595.88.539.454.704.2]An applicable geospatial analysis that can assist in crime management is buffer zone generation. This in-volves establishing a distance of equal radius around a phenomenon of interest to show its areas of influence based on specified parameters (the phenomenon of interest in this research refers to hotspots). Buffer or prox-imity analysis was used to map the identified impact zones (hotspots) in the metropolis where control of activi-ties needs to be strengthened. A distance of 1km was observed for the single distance buffers (Figure 10) to ac-centuate the immediate areas vulnerable to attack. Likewise, in the multiple distance buffers (Figure 11) the distance of 1 km (ring) was used. Results for buffer analysis:
Figure 11. Single buffer of crime hotspot.
The single buffer (Figure 11) shows that most areas are highly vulnerable to different types of crimes. These areas include Oba Market and environs including Ogbe quarters, Eric, Asoro, Oka, Christ Apostolic road, Uwa primary school area, and Igbesammwan, St. Saviour, Faith way and Gapiona in GRA. Akpakpava, Oregbeni, Wire road, Uselu market area, Uwasota, Ugbowo BDPA housing estate, Osasogie near UBTH and Ekosodin Village near University of Benin.
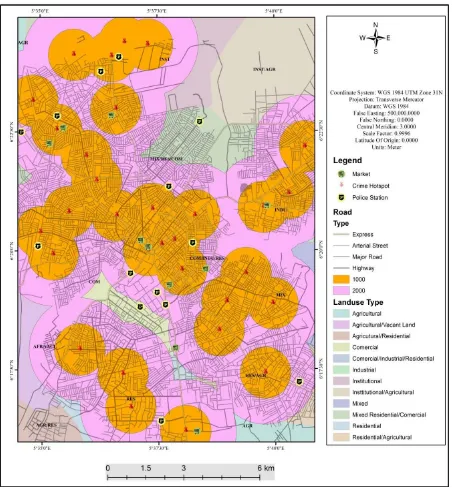
The multiple buffering (Figure 12) shows that as one move further way from hotspots vulnerability to crime reduces especially at the north eastern. The area of overlap of hotspots buffer reveal high risk of crime in those areas. The fact that most police stations are located within the area of multiple overlap buffers shows that the police are not fully in control of the area under their jurisdiction. This calls for a change of mode of operation.
T. F. Balogun et al.
Figure 12. Multiple buffers of crime hotspot.
as shown in Figure 13. These activities location are of best interest to the public but they have also continued to attract criminals because of their site and functional peculiarities, financial status and economic relevance. Sin-gle buffer (500 m) around hotspot for burglary reveals that burglary combined with robbery are dominant around Sapele road new Santana market, Adolo college road in Ugbowo, Iwoghan at Ikpoba Hill, Etete in GRA, Ugbokum quarters, Sokponba road and St. Saviour. Field work shows that the nature of housing and the distance from police station contribute to the prevalence of burglary in those areas.
Our study reveals that cultism, robbery and rape are dominant in most areas in Benin metropolis. The study further reveals that areas such as Uwelu, Uwasota, Ekosodin where most University of Benin students reside, Nitel Junction at Ikpoba Hill along Benin-Auchi road, and Uwa primary School are prone to these crimes.
Figure 13. Buffer police station/crime hotspot in relation to other socio-economic activity.
crime in the study area. First the buffer around the police stations has shown areas of lack in terms of security outfit, and it has also shown the distance it takes a police to move from one hotspot to the other. Secondly, the areas with overlapping buffer suggest the need for constant patrol.
In the same vein, the situation described also reveals that police can be dispatched to hotspot strategically unlike the use of trial and error. More importantly, during the chase of a suspect, the route layer provided by GIS analysis can easily help in the apprehension of the suspect and generally in establishing a better crime fighting plan. Thirdly, the study has proved that GIS can give a better synoptic perspective to crime study, analysis, and mapping, thus acting as decision support system.
6. Conclusions and Recommendations
T. F. Balogun et al.
crime management and in security situation analysis for efficient community policing in Nigeria, using Benin as case study. The location of police station vis-à-vis police-public relation was observed to be very poor hence, the low report of crime incidents and suspects. The study also shows that armed robbery is the major crime in the city closely followed by burglary, rape, pick pocket, murder and other crimes. Combating crime, therefore, re-quires a well prepared police force with efficient manpower and a robust logistics which for now are absent. Record keeping is in analogue format which is inefficient in crime analysis. This situation is not good enough in the light of the modern day crime fighting and policing techniques. The benefits derived from using GIS tech-nique in combating crime are considered enormous, hence it is recommended to the Nigerian Police Force for adoption without further delay. The proximity to crime hotspots shows some areas are more vulnerable to crime than the others.
Furthermore, the application of GIS in crime study will enable the creation of a “geo-database” to reduce re-dundancy, automate police field operation and increase the effectiveness of crime fighting in all ramifications. GIS uses automated means of detecting, analyzing and combating crime through the production and use of hard- copy and soft-copy guidable maps to analyze crime trends based on their location, types, or time of occurrence [19]. Crime mapping is used by analysts in law enforcement agencies to map, visualize, and analyze crime inci-dent patterns. It helps law enforcement management to make better decision, target resources, and formulate strategies, as well as for tactical analysis such as crime forecasting. Mapping crime, using geographic informa-tion systems (GIS), allows crime analysts to identify crime hotspots, along with other trends and patterns.
It is concluded that for effective crime control and management in Nigeria, the security operatives should en-gage in the modern standard of policing by adopting and integrating GIS methodology as this will help the force to be proactive in their operations. Based on the response from the police and the result of the study, the follow-ing recommendations are proposed. There should be provision of GIS laboratory for data handlfollow-ing within the police information system, regular capacity building of police personnel based on the use of this geospatial technology should be considered seriously, provision of navigation vehicles and GPS facilities for effective tracking and acquisition of digital map for every city in different coverages and layers.
The Nigerian approach to crime control and management is still mundane and grossly inefficient to effec-tively combat the present day surge of crime. This is particularly worrisome in the midst of series of artificial intelligence, offered by sophisticated technologies, thus the recommendation for the use of GIS in preventing and managing crime in Nigeria. There is an urgent need to upgrade to a more advanced system of crime control by employing GIS facilities in crime mapping to improve the understanding of crime pattern in relation to roads, police stations, residence of offenders and also to identify jeopardy surfaces (hotspots) of crime in a locality. The use of GIS technology will be of great significance to the law enforcement agency, as it will serve as a tool for decision support system for policy makers by providing a frame work for improving quality of service deliv-ery, and efficient policing, thus making the police react quickly and proactively. This will enhance safety of lives and properties as well as provide a favourable business environment within the nation.
References
[1] http://www.cps.gov.uk/publications/agencies/dv/gwent_info.html
[2] Eylon, L. (2004) GIS: A Powerful Weapon in the Fight against Crime. http://wwwgisvisionmag.com/feature/crime [3] Eck, J. (2002) Preventing Crime at Places. In: Sherman, L., Farrington, D., Welsh, B. and MacKenzie, D.L., Eds.,
Evi-dence-Based Crime Prevention, Routledge, New York, 241-295.
[4] Harries, K. (1974) The Geography of Crime and Justice. In: Harries, Ed., Mapping Crime: Principle and Practical U.S. Department of Justice, Office of Justice Program, Washington D.C., 20531.
https://www.ncjrs.gov/pdffiles1/nij/178919.pdf
[5] Agboola, T. (1997) The Architecture of Fear: A Pilot Study of Planning Urban Design and Construction Reaction to Urban Violence in Lagos, Nigeria. Ibadan IFRA and African Builders. In: Adedokun, O. and Atere, A., Eds., Crime Management in Nigeria,Lagos State University, Lagos, ix-x.
[6] Sahu, R. and Srivastava, P. (2004) Effective Crime Control using GIS. Map India Conference 2004 GIS develop-ment.net. http://gisdevelopment.net/application/military/defence/mi04184.htm
[7] Nelson Lew (1999) GIS: The Powerful Weapon for Law Enforcement. ESRI Arcuser Magazine Jan-March 1999.
En-vironment Systems Research Institute Inc., ESRI. www.esricom
Sys-tems Army Headquarters.
[9] Andreas, M.S. (1997) Spatial Analysis of Crime Using GIS-Based Data: Weighted spatial Adaptive filtering and Cha-otic Cellular Forecasting with Application to Street Level Drug Markets. Ph.D. Dissertation, H. John Heinz III School of Public Policy and Management Carnegie Mello University.
[10] Green, L.A. (1993) Drug Nuisance Abatement, Offender Movement Patterns, and Implications for Spatial Displace-ment Analysis. In: Block, C.R. and Dabdoub, M., Eds., Workshop on Crime Analysis through Computer Mapping Proceedings,Illinois Criminal Justice Information Authority, Chicago, 21-32.
[11] Cohen, J., Gorr, W.L. and Olligschlaeger, A.M. (1993) Modeling Street-Level Illicit Drug Markets. Working Paper #93-64, H. John Heinz III School of Public Policy and Management, Carnegie Mellon University, Pittsburgh.
[12] Phillips, P.D. (1972) A Prologue to the Geography of Crime. Proceedings of the Association of American Geographers,
4, 86-91.
[13] Coker, R.O. (2004) Geospatial Information System Application to Security Situation Analysis for Efficient Policing: A Case Study of Mushin Local Government Area in Lagos State. Unpublished PGD Project, RECTAS, OAU Campus, Ile-Ife.
[14] Bowers, K.J., Johnson, S.D. and Pease, K. (2004) Prospective Hotspotting: The Future of Crime Mapping. British Journal of Criminology, 44, 641-658.
[15] Frisbie, D.W., Fishbine, G., Huntz, R., Joelson, M. and Nutter, J.B. (1977) Crime in Minneapolis: Proposals for Pre-vention. Community Crime Prevention Project, Governor’s Commission on Crime Prevention and Control, St Paul.
[16] Date, C.J. (1994) Relational Database Writings 1991-1994. Addison-Wesley 1995,Boston, I-XVIII, 1-542.
[17] de By, R.A. and Janssen, L.L.F. (2001) Principles of Remote Sensing and Geographic Information Systems on CDROM. ITC, Enschede.
[18] Kufoniyi, O. (1995) Spatial Coincidence Modeling Automated Database Updating and Data Consistency in Vector GIS. ITC Publication Number 28 and PhD Thesis, Department of GIS and Remote Sensing, Wageningen Agricultural Uni-versity, Netherlands, 206.