Open Access
Research
Gene set analysis methods applied to chicken microarray
expression data
Axel Skarman, Li Jiang, Hornshøj Henrik, Bart Buitenhuis, Jakob Hedegaard,
Lene N Conley and Peter Sørensen*
Address: Department of Genetics and Biotechnology, Faculty of Agricultural Sciences, Aarhus University, DK-8830 Tjele, Denmark
Email: Axel Skarman - [email protected]; Li Jiang - [email protected]; Hornshøj Henrik - [email protected];
Bart Buitenhuis - [email protected]; Jakob Hedegaard - [email protected]; Lene N Conley - [email protected]; Peter Sørensen* - [email protected]
* Corresponding author
Abstract
Background: Gene set analysis is considered to be a way of improving our biological interpretation of the observed expression patterns. This paper describes different methods applied to analyse expression data from a chicken DNA microarray dataset.
Results: Applying different gene set analyses to the chicken expression data led to different ranking of the Gene Ontology terms tested. A method for prediction of possible annotations was applied.
Conclusion: Biological interpretation based on gene set analyses dependent on the statistical method used. Methods for predicting the possible annotations for genes with unknown function from the expression data at hand could be useful, but our results indicate that careful validation of the predictions is needed.
Background
A major challenge in large-scale gene expression studies is the biological interpretation of the observed expression patterns. Gene set analysis identifies expression changes in functionally related genes and it is considered to be a way of improving understanding of the underlying biol-ogy [1]. Gene sets can be defined based on prior biological knowledge on gene functions available from public avail-able databases (e.g. Gene Ontology (GO)) [2]. The aim of this work was to compare different gene set analyses methods when applied to a chicken microarray data set.
As a high number of probes on the chicken microarray lack annotation we also applied a method to predict the possible annotations from the expression data.
Methods
The data – host reactions in broilers after a secondary challenge
The data originated from a microarray experiment con-ducted to study the host reactions in broilers shortly after a secondary challenge. The broilers were initially inocu-lated with phosphate buffered saline (P) or with E.
from EADGENE and SABRE Post-analyses Workshop Lelystad, The Netherlands. 12–14 November 2008
Published: 16 July 2009
BMC Proceedings 2009, 3(Suppl 4):S8 doi:10.1186/1753-6561-3-S4-S8
<supplement> <title> <p>EADGENE and SABRE Post-analyses Workshop</p> </title> <editor>Dirk-Jan de Koning</editor> <sponsor> <note>The publication of these proceedings was supported by the EC-funded Network of Excellence EADGENE (EC contract number FOOD-CT-2004-506416).</note> </sponsor> <note>Proceedings</note> <url>http://www.biomedcentral.com/content/pdf/1753-6561-3-S4-info.pdf</url> </supplement> This article is available from: http://www.biomedcentral.com/1753-6561/3/S4/S8
© 2009 Skarman et al; licensee BioMed Central Ltd.
maxima (M) followed by a secondary with PBS (P), E. maxima (M) or with E. acervulina (A), forming five chal-lenge groups PP, PM, PA, MM and MA. Samples of the jejunum were collected 8 and 24 hours after the second challenge and gene expression profiles were obtained using chicken whole genome oligonucleotide microar-rays. The result of the contrasts between MM8-PM8, MM8-MA8 and MM8-MM24 were provided for this work-shop. A more detailed description of the experiment can be found in an adjacent paper [3]Hedegaard et al: "Meth-ods for interpreting lists of affected genes obtained in a DNA microarray experiment".
Gene Ontology class prediction
GO class predictions for genes with unknown GO annota-tions were based on expression ratios and support vector machine (SVM). SVM is a set of machine learning meth-ods that can be used for data classification and has been implemented in Gist 2.3 version [4,5] that we have used in this study. The predictions were focused on signifi-cantly differentially expressed genes in the contrasts MM8-MA8, MM8-MM24 and MM8-PM8, defined as the probes with p-values at or below 0.05 after correcting for multiple testing by Benjamin and Hochberg's False Discovery Rate method (FDR) [6]. The total number of oligonucleotides representing differentially expressed genes was deter-mined to be 2347. Gist requires expression ratio matrices without missing values, therefore the number of oligonu-cleotides were reduced to 936. Of these oligonuoligonu-cleotides, 280 oligonucleotides have previously been mapped to a GO Biological Process (BP) term. The expression ratios for these 280 oligonucleotides were defined as the training set. The test set for class prediction consisted of the expres-sion ratios for the remaining 656 oligonucleotides with-out GO BP annotations.
Defining gene sets for gene set analysis
Gene set analyses is based on the available annotation for the chicken genome. According to EADGENE Oligo Set Annotation Files [7] version 2 from 11th of September 2008, there are 20460 unique oligonucleotides on the chicken array. Among these 14592 oligonucleotides rep-resent 11532 Ensembl chicken genes. There are 2420 Ensembl chicken genes represented by multiple (2 to 9) oligonucleotides on the array.
Each of the gene lists for the three contrasts (MM8-MM24, MM8-MA8 and MM8-PM8) [4] contains 13158 oligonu-cleotides, of which 13126 are unique. The remaining 32 oligonucleotides are multiple copies of control probes. The oligonucleotides in the gene list were mapped to GO annotation with 3422 oligonucleotides associated with (BP), 4385 associated with molecular function (MF) and 3455 associated with cellular component (CC).
Gene sets were defined based on the annotated oligonu-cleotidesand gene sets with fewer than 5 oligonucleotides were excluded. There were originally 2553 BP, 1436 MF and 481 CC terms represented on the array. Applying the above criteria of gene set definition and filtering reduced this to 475 BP, 248 MF and 157 CC terms available for the analysis.
Since a unique gene can be represented by multiple differ-ent probes on a microarray, it is of interest to compare the gene set tests based on individual oligonucleotides (oligo-wise) or on individual genes (gene-(oligo-wise).
Gene set analysis methods and software
Gene set analysis was performed using software packages developed in Bioconductor [8] and R [9]. The tests used were the Wilcoxon test as implemented in the LIMMA package (version 2.14.5 [10,11]), Fisher's exact test [12] and Kolmogorov Smirnoff implemented in the topGO (version 1.8.1. [13]), and Globaltest [14,15] implemented in the Globaltest package (version 4.12.0). For the Fisher's exact test a predefined adjusted p-value of 0.05 was cho-sen to be the cutoff for individual oligonucleotides to be differentially expressed. Except for the Globaltest, the result of statistical hypothesis testing (t-statistics or p-value) for the oligonucleotides was used as input data for the gene set analyses. The Globaltest uses the expression data directly when testing gene sets and the corresponding p-values were computed using either the asymptotic dis-tribution or permutations [14]. The gene set testing was done both with and without adjusting the p-values for multiple testing using FDR [6]. A two-sided binomial test was used to assess if the p-values from gene-wise and probe-wise gene set tests tended to be smaller in one case or another.
Results and discussion
Class prediction for genes with unknown GO annotations We generated an expression ratio data set with 936 oligo-nucleotides for genes without missing expression values. These oligonucleotides were differentially expressed with false discovery rate at 0.05 in one or more of the contrasts (MM8-MM24, MM8-MA8 and MM8-PM8). From previ-ous annotation, 280 oligonucleotides mapped to 467 GO BP terms and 656 oligonucleotides did not map to any GO BP term. We characterized two sets, one as a training set and one as a test set respectively. For each GO term in the training set it was predicted whether any of the oligo-nucleotides in the test set could be classified as belonging to the GO BP term based on similarity in expression pro-files between the two sets across the tissue samples (MA8, MM8, MM24 and PM8).
above 1. Additional file 1 shows the top 20 predictions based on ranking the number of oligonucleotides for each GO BP term. For most GO BP terms the number of pre-dicted oligonucleotides is higher than the number of oli-gonucleotides that was previously mapped. Additional file 2 shows an example of class prediction for the GO term 'immune response' (GO:0006955) visualized by hierarchical clustering of the expression ratios for genes previously known to map to this GO BP term and genes that were predicted to belong to this GO term. Validation of the prediction method using this GO BP term was attempted using the following approach. Each oligonucle-otides with previously known mapping to this term was taken out one by one and tested whether class prediction classified it to the expected term. Unfortunately, valida-tion was only possible for oligonucleotides ID RIGG20020 with the combination of tissue expression data and prediction method used in this study. The class prediction approach used in this study was inspired by a previous study in mice [5]. In comparison to our study, they used a much higher number of different annotated GO terms and a much higher number of different tissues, which may explain the low validation success that we observed here.
Adjustment for multiple testing
To adjust for multiple testing we applied FDR to the dif-ferent gene set tests. After adjustment most methods had no terms with p-value below 0.05 for all categories of GO terms, the exception being Globaltest. Except for Global test the corrected p-values were in most cases close to one or relatively high. There were even many cases where all p-values became one or close to one. It was therefore decided to compare the different gene set methods with-out adjusting for multiple testing. In our attempt to account for multiple testing we ignored the structure of the GO graph. Multiple testing procedures assume that the tests performed are independent. This assumption is often violated as the GO terms are not independent to each other due to hierarchical structure of GO and the usage of multiple GO terms in the annotation of one gene. Another problem with most multiple testing adjustments is that they do not change the ranks and therefore the rel-ative importance of the different GO terms. Alternrel-atively it is possible to use an adjustment method that account for the dependencies. One example could be to use the focus level procedure [16] even though it is not valid for all kinds of tests.
Gene set tests based on individual oligonucleotides or genes
Since the same gene can be measured by a set of different oligonucleotides which are very likely to have the identi-cal annotation, it is of interest to compare the gene set tests based on individual oligonucleotides (oligo-wise) or
on individual genes (gene-wise). For this comparison we used the Wilcoxon test which determines if the oligonu-cleotides/genes in the set is up-regulated (up), down-reg-ulated (down) or differentially expressed regardless of direction (mixed). Gene sets were defined based on GO annotation and we analyzed all three contrasts (MM8-MM24, MM8-MA8 and MM8-PM8).
We computed the Spearman correlations between the vec-tors of p-values from Wilcoxon tests based on individual oligonucleotides or genes. For the Wilcoxon test the direc-tion was not considered. Each vector was generated in the gene set test defined by GO class for each contrast. There was a high correlation (0.84–0.92) between these tests. Comparing across all gene set tests it appeared that the gene-wise p-values in general are smaller than the oligo-wise p-values (smaller in 58% of the cases corresponding to p = 2.2*10-16 in a binomial two sided test). Figure 1 shows the BP terms tested (up-regulated, down-regulated or differentially expressed) having a p-value less than 0.01 for the different contrasts. The pattern of BP terms for gene-wise and oligo-wise tests is very similar across the
Visualization of class predictions for GO BP term 'immune response' showing expression ratio profiles for both cleotides with known mapping to this term (1) and oligonu-cleotides predicted to belong to this term (0)
Figure 1
All the BP gene sets which were tested (up-regulated, down-regulated or differentially expressed) having a p-value less than 0.01 are shown for the different contrasts
Figure 2
All the BP gene sets which were tested (uregulated, down-regulated or differentially expressed) having a p-value less than 0.01 are shown for the different contrasts. g: stands for gene-wise and p: stands for oligo-wise. 1: differ-entially expressed BP gene sets from MM8_MM24; 2: differential expressed BP gene sets from MM8_MA8; 3: differdiffer-entially expressed BP gene sets from MM8_PM8; 4: up regulated BP gene sets from MM8_MM24; 5: up regulated BP gene sets from MM8_MA8; 6: up regulated BP gene sets from MM8_PM8; 7: down regulated BP gene sets from MM8_MM24; 8: down regu-lated BP gene sets from MM8_MA8 and 9: down reguregu-lated BP gene sets from MM8_PM8.
1 g 2 g 3 g 4 g 5 g 6 g 7 g 8 g 9 g 1 p 2 p 3 p 4 p 5 p 6 p 7 p 8 p 9 p
Wnt receptor signaling pathway vesicle−mediated transport unfolded protein response ubiquitin cycle
tRNA aminoacylation for protein translation transport
translation transcription
skeletal muscle development rRNA processing
regulation of transcription DNA−dependent regulation of transcription
regulation of cell proliferation regulation of cell differentiation proteolysis
protein metabolic process protein folding
positive regulation of transcription from RNA polymerase II promoter positive regulation of angiogenesis
oxidation reduction
neuropeptide signaling pathway neuromuscular junction development negative regulation of BMP signaling pathway muscle development
multicellular organismal development mismatch repair
metabolic process male gonad development lipid metabolic process ISG15−protein conjugation heart development glycolysis
glutathione metabolic process electron transport dendrite development defense response to virus cholesterol homeostasis cellular protein metabolic process cell redox homeostasis cell−substrate junction assembly cell−matrix adhesion cardiac muscle contraction bone resorption
ATP synthesis coupled proton transport angiogenesis
adult heart development
biological pathway
0 0.01
Value
different contrasts although there are cases where terms for only the gene-wise or the oligo-wise test.
For the tests based on individual genes the median value of the t-statistics from all its corresponding oligonucle-otides was used. The median value measures the trend of all its transcripts as a whole and if the different oligonu-cleotides measure different splice variants using the median may lead to biased results. Alternatively, the t-sta-tistic for a single oligonucleotides could be used to repre-sent the gene in the gene set test. Although the results indicate only minor differences between gene set test based on individual oligonucleotides or genes it is diffi-cult to generalize to other datasets. The best choice depends on the design of the array and in particular if the number of replicate probes varies for different genes it will often be better to use tests based on individual genes.
Gene set tests taking GO structure into account
GO has a hierarchical structure that forms a directed acy-clic graph which leads to a high degree of dependencies between the tested terms. We used the topGO package which based on the Fisher's exact test implements two algorithms (eliminate and weight) that takes the GO structure into account when testing the gene sets. These two algorithms were compared to the "classical" Fisher's exact test and the Kolmogorov Smirnoff test which both ignores the GO structure. The terms for the three GO cat-egories were tested for the three contrasts. Figure 2 shows that taking the GO structure into account leads to fewer terms with p-value below 0.05 which may indicate increased specificity as suggested by the authors of the method [13].
Comparing Globaltest and Wilcoxon test
We also compared the results from the Globaltest and Wilcoxon test. These methods differ in two important aspects. First, Wilcoxon test is a competitive test in the sense that genes in the set are compared to other genes whereas Globaltest is a self-contained test which generally leads to higher power [17]. Second Wilcoxon test treats
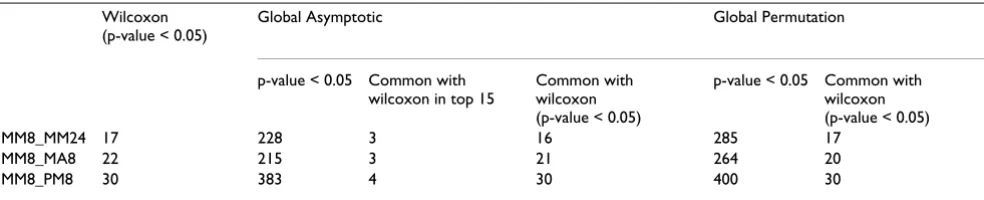
the individual genes/oligonucleotides as the sampling units and Globaltest treats the subjects as sampling units which is a more sound statistical approach. These differ-ences may in part explain when comparing different methods the highest ranked terms are not necessarily the same. We compared the two methods by the number of common terms among the terms with p-value below 0.05 or among the 15 top ranking terms (Table 1).
The Globaltest gave a much larger number of terms with a p-value below 0.05. It is however unclear to what extent this comes at a cost of a higher number of false positives. For each of the comparisons the terms with p-value below 0.05 given by the Wilcoxon test were almost all found by the Globaltest (p-value below 0.05). However, only 3 or 4 out of the top 15 terms are overlapping. For the Globaltest we also found that the number of terms with p-values below 0.05 to be higher when p-values were computed using permutation compared to when the asymptotic was used.
Conclusion
Applying different gene set test to the EADGENE chicken expression data led to different ranking of the GO terms tested. Therefore biological interpretation based on gene set analyses is depending on the statistical method used. Methods for predicting the possible annotations for genes with unknown function from the expression data at hand are useful, but our results indicate that careful validation of the predictions is needed.
List of abbreviations used
GO: Gene Ontology; SVM: Support Vector Machine; FDR: Benjamin and Hochberg's False Discovery Rate; BP: Bio-logical Process; MF: Molecular Function; CC: Cellular Component;
Competing interests
The authors declare that they have no competing interests.
Table 1: Comparison of Wilcoxon and Globaltest.
Wilcoxon (p-value < 0.05)
Global Asymptotic Global Permutation
p-value < 0.05 Common with wilcoxon in top 15
Common with wilcoxon (p-value < 0.05)
p-value < 0.05 Common with wilcoxon (p-value < 0.05)
MM8_MM24 17 228 3 16 285 17
MM8_MA8 22 215 3 21 264 20
MM8_PM8 30 383 4 30 400 30
Publish with BioMed Central and every scientist can read your work free of charge
"BioMed Central will be the most significant development for disseminating the results of biomedical researc h in our lifetime."
Sir Paul Nurse, Cancer Research UK
Your research papers will be:
available free of charge to the entire biomedical community
peer reviewed and published immediately upon acceptance
cited in PubMed and archived on PubMed Central
yours — you keep the copyright
Submit your manuscript here:
http://www.biomedcentral.com/info/publishing_adv.asp
BioMedcentral
Authors' contributions
The authors contributed equally to the final manuscript.
Additional material
Acknowledgements
The authors wish to acknowledge Caroline Channing and the other organ-isers of the workshop, Dr. Rebel and colleagues from Animal Science Group in Lelystad, the reviewers and EADGENE and SABRE for financial support.
This article has been published as part of BMC Proceedings Volume 3 Sup-plement 4, 2009: EADGENE and SABRE Post-analyses Workshop. The full contents of the supplement are available online at http://www.biomedcen tral.com/1753-6561/3?issue=S4.
References
1. Huang DW, Sherman BT, Lempicki RA: Bioinformatics enrich-ment tools: paths toward the comprehensive functional analysis of large gene lists. Nucleic Acids Research 2009,
37(1):1-13.
2. The Gene Ontology Consortium: Gene Ontology: tool for the unification of biology. Nature Genet 2000, 25:25-29.
3. Hedegaard J, Arce C, Bicciato S, Bonnet A, Ramerez-Boo M, Buiten-huis AJ, Collado-Romero M, Conley LN, SanCristobal M, Ferrari F, et al.: Methods for interpreting lists of affected genes obtained in a DNA microarray experiment. BMC Proceedings 2009,
3(Suppl 4):S5.
4. Gist 2.3 [http://www.bioinformatics.ubc.ca/gist]
5. Zhang W, Morris QD, Chang R, Shai O, Bakowski MA, Mitsakakis N, Mohammad N, Robinson MD, Zirngibl R, Somogyi E, Laurin N, Eftekharpour E, Sat E, Grigull J, Pan Q, Peng WT, Krogan N, Green-blatt J, Fehlings M, Kooy D van der, Aubin J, Bruneau BG, Rossant J, Blencowe BJ, Frey BJ, Hughes TR: The functional landscape of mouse gene expression. J Biol 2004, 3(5):21.
6. Benjamini Y, Hochberg Y: Controlling the false discovery rate – a practical and powerful approach to multiple testing. J R Stat Soc Series B Stat Methodol 1995, 57:289-300.
7. EADGENE Oligo Set Annotation Files [http://www.ead gene.info/TheProject/
IntegratioBiologicalresourcesandfacilitiesWP11/
EADGENEOligoSetsAnnota tionFiles/tabid/324/Default.aspx] 8. Gentleman RC, Carey VJ, Bates DM, Bolstad B, Dettling M, Dudoit S,
Ellis B, Gautier L, Ge Y, Gentry J, Hornik K, Hothorn T, Huber W, Iacus S, Irizarry R, Leisch F, Li C, Maechler M, Rossini AJ, Sawitzki G, Smith C, Smyth G, Tierney L, Yang JYH, Zhang J: Bioconductor: open software development for computational biology and bioinformatics. Genome Biol 2004, 5:R80.
9. R Development Core Team: R: A language and environment for statistical computing. 2008 [http://www.R-project.org]. R Founda-tion for Statistical Computing, Vienna, Austria ISBN 3-900051-07-0 10. Smyth GK, Yang Y-H, Speed TP: Statistical issues in microarray
data analysis. Methods Mol Biol 2003, 224:111-136.
11. Smyth GK: Limma: linear models for microarray data. In 'Bio-informatics and Computational Biology Solutions using R and Bioconductor'
Edited by: Gentleman R, Carey V, Dudoit S, Irizarry R, Huber W. Springer, New York; 2005.
12. Lehmann EL: Testing Statistical Hypotheses. In Springer Texts in Statistics 2nd edition. Springer-Verlag, New York; 1986.
13. Alexa A, Rahnenführer J, Lengauer T: Improved scoring of func-tional groups from gene expression data by decorrelating GO graph structure. Bioinformatics 2006, 22(13):1600-1607. 14. Goeman JJ, Geer SA van de, de Kort F, van Houwelingen HC: A
glo-bal test for groups of genes: testing association with a clinical outcome. Bioinformatics 2004, 20:93-99.
15. Goeman JJ, Oosting J, Cleton-Jansen A-M, Anninga JK, van Houwelin-gen HC: Testing association of a pathway with survival. Bioin-formatics 2005, 21:1950-1957.
16. Goeman JJ, Mansmann U: Multiple testing on the directed acy-clic graph of gene ontology. Bioinformatics 2008, 24(4):537-544. 17. Goeman JJ, Buhlmann P: Analyzing gene expression data in terms of gene sets: methodological issues. Bioinformatics 2007,
23:980-987.
Additional file 1
Top 20 class predictions for GO BP ranked descending by the number of predicted oligonucleotides. The table contains the following columns: GO ID: GeneOntology Identifier, GO description: GeneOntology descrip-tion, Oligonucleotide count known: number of oligonucleotides that were previously mapped to the GO BP term, Oligonucleotide count predicted: number of oligonucleotides that were predicted to belong to the GO BP term.
Click here for file
[http://www.biomedcentral.com/content/supplementary/1753-6561-3-S4-S8-S1.pdf]
Additional file 2
Visualization of class predictions
GO BP term ‘immune response’ showing expression ratio profiles for both oligonucleotides with known mapping to this term (1) and oli-gonucleotides predicted to belong to this term (0). Validation was pos-sible only for oligonucleotides ID RIGG20020.
Click here for file