P R O C E E D I N G S
Open Access
Multi-task feature selection in microarray data
by binary integer programming
Liang Lan, Slobodan Vucetic
*From
Great Lakes Bioinformatics Conference 2013
Pittsburgh, PA, USA. 14-16 May 2013
Abstract
A major challenge in microarray classification is that the number of features is typically orders of magnitude larger than the number of examples. In this paper, we propose a novel feature filter algorithm to select the feature subset with maximal discriminative power and minimal redundancy by solving a quadratic objective function with binary integer constraints. To improve the computational efficiency, the binary integer constraints are relaxed and a low-rank approximation to the quadratic term is applied. The proposed feature selection algorithm was extended to solve multi-task microarray classification problems. We compared the single-task version of the proposed feature selection algorithm with 9 existing feature selection methods on 4 benchmark microarray data sets. The empirical results show that the proposed method achieved the most accurate predictions overall. We also evaluated the multi-task version of the proposed algorithm on 8 multi-task microarray datasets. The multi-task feature selection algorithm resulted in significantly higher accuracy than when using the single-task feature selection methods.
Background
Microarray technology has the ability to simultaneously measure expression levels of thousands of genes for a given biological sample, which is classified into one of the several categories (e.g., cancer vs. control tissues). Each sample is represented by a feature vector of gene expressions obtained from a microarray. Using a set of microarray samples with known class labels, the goal is to learn a classifier able to classify a new tissue sample based on its microarray measurements. A typical micro-array classification data set contains a limited number of labeled examples, ranging from only a few to several hundred. Building a predictive model from such small-sample high-dimensional data is a challenging problem that has received a significant attention in machine learning and bioinformatics communities. To reduce the risk of over-fitting, a typical strategy is to select a small number of features (i.e., genes) before learning a classifi-cation model. As such, feature selection [1,2] becomes an essential technique in microarray classification.
There are several reasons for feature selection in microarray data, in addition to improving the classifier’s generalization ability. First, the selected genes might be of interest to domain scientists interested in identifying disease biomarkers. Second, building a classifier from a small number of features could result in an easily inter-pretable model that could give important clues to biolo-gists. Depending on how the feature selection process is combined with model learning process, feature selection techniques can be organized into three categories. (1) Filter methods [3] are independent of the learning algo-rithm. (2) Wrapper methods [4] are coupled with the learning algorithm using heuristics such as forward selection and backward elimination. (3) Embedded methods [5,6] integrate feature selection as a part of the classifier training. Both the wrapper and the embedded methods effectively introduce hyper-parameters that require computationally costly nested cross-validation and increase likelihood of over-fitting. Feature filter methods are very popular because they are typically conceptually simple, computationally efficient, and robust to over-fitting. These properties also explain why the filter methods are more widely used than the other two approaches in microarray data classification.
* Correspondence: [email protected]
Department of Computer and Information Science, Temple University, Philadelphia, PA, USA
Traditional filter methods rank the features based on their correlation with the class label and then select the top ranked features. The correlation can be measured by statistic tests (e.g.,t-test) or by information-theoretic cri-teria such as mutual information. The filter methods easily scale up to high dimensional data and can be used in conjunction with any supervised learning algorithm. However, because the traditional filter methods access each feature independently, highly correlated features tend to have similar rankings and tend to be selected jointly. Using redundant features could result in low clas-sification accuracy. As a result, one common improve-ment for filter methods is to reduce redundancy between selected features. For example, minimal-redundancy-maximal-relevance (mRMR) proposed by [7] selects the feature set with both maximal relevance to the target class and minimal redundancy among the selected fea-ture set. Because of the high computational cost of con-sidering all possible feature sets, the mRMR algorithm selects features greedily, minimizing their redundancy with features chosen in previous steps and maximizing their relevance to the target class.
A common critique of popular feature selection filters is that they are typically based on relatively simple heuris-tics. To address this concern, recent research resulted in more principled formulation of feature filters. For exam-ple, algorithms proposed in [8] and [9] attempt to select the feature subset with maximal relevance and minimal redundancy by solving a constrained quadratic optimiza-tion problem (QP). The objective used by [8] is a combi-nation of a quadratic term and a linear term. The redundancy between feature pairs is measured by the quadratic term and the relevance between features and class label is measured by the linear term. The features are ranked based on a weight vector obtained by solving a QP problem. The main limitation of this method is that the relevance between a feature and the class label is measured by either Pearson correlation or mutual infor-mation. However, Pearson correlation assumes normal distribution of the measurements, which might not be appropriate to measure correlation between numerical features and binary target. The mutual information requires using discrete variables and is sensitive to discre-tization. The objective used by [9] contains only one quadratic term. This quadratic term consists of two parts: one measures feature relevance using mutual infor-mation between features and the class label, and another measures feature redundancy using mutual information between each feature pair. However, the square matrix in the proposed quadratic term is not positive semi-definite. Thus, the resulting optimization problem is not convex and could result in poor local optima.
In this paper, we propose a novel feature filter method to find the feature subset which maximizes the inter-class
separability and intra-class tightness, and minimizes the pairwise correlations between selected features. We for-mulate the problem as a quadratic programming with bin-ary integer constraints. For high dimensional microarray data, to solve the proposed quadratic programming pro-blem with binary integer constraints requires high time and space cost. Therefore, we relax binary integer con-straints and apply the low rank approximation to the quadratic term in the objective function. The resulting objective function can be efficiently solved to obtain a small subset of features with maximal relevance and mini-mal redundancy.
In many real-life microarray classification problems, the size of the given microarray dataset is particularly small (e.g., we might have less than 10 labeled high-dimensional examples). In this case, even the most carefully designed feature selection algorithms are bound to underperform. Probably the only remedy is to borrow strength from external microarray datasets. Recent research [10,11] illus-trates that multi-task feature selection algorithms can improve the classification accuracy. The multi-task feature selection algorithms select the informative features jointly across many different microarray classification data sets. Following this observation, we extend our feature selection algorithm to the multi-task microarray classification setup. The contributions of this paper can be summarized as follows.(1) We propose a novel gene filter method which can obtain a feature subset with maximal discriminative power and minimal redundancy; (2) The globally optimal solution can be found efficiently by relaxing the integer constraints and using a low-rank approximation techni-que; (3) We extend our feature selection method to multi-task classification setting; (4) The experimental results show our algorithms achieve higher accuracy than the existing filter feature selection methods, both in sin-gle-task learning and multi-task settings.
Results and discussion
We compared our proposed feature algorithm with 9 representative feature selection filters. The first 6 are standard feature selection filters: Pearson Correlation (PC), ChiSquare [3], GINI, Infogain, Kruskal-Wallis test and Relief [12]. They rank the features based on different criteria that measure correlation between each feature and class label. The remaining 3 are the state-of-the-art feature selection methods which are able to remove redundant features: mRMR [7], QPFS [8] and SASMIF [9]. The feature similarity for both QPFS and our algo-rithm was measured by Pearson correlation. For fair
comparison, for the SASMIF method we used top m
ranked features. To balance the effect of feature relevance and feature redundancy, the parameterlin (9) was set to m2M
iCi
as suggested in [13]. Our algorithm is denoted as ST-BIP for single task version and MT-BIP for multi-task version.
Given the selected features, we used LIBLINEAR [14] to train the linear SVM model. The linear SVM model was chosen because previous studies [5] showed SVM classifier could be very accurate on microarray data. The
regularization parameterCof LIBLINEAR was chosen
among {10-3, 10-4, …, 103}. For the experiments in the single-task scenario, we used the nested 5 cross validation to select the optimal regularization parameter. For experiments in multi-task learning scenario, it was too time consuming to use the nested cross-validation to select the regularization parameter. Thus, we simply fixed the regularization parameter to 1 in the multi-task experiments.
Single task feature selection
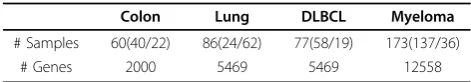
In this section, we evaluate our proposed feature selection algorithm for single-task learning using four benchmark microarray gene expression cancer datasets: (1) Colon dataset [15] containing 62 samples, 40 tumor and 22 nor-mal samples; (2) Lung dataset [16] containing 86 samples coming from 24 patients that died and 62 that survived; (3) Diffuse B-cell Lymphoma (DLBCL) dataset [17] con-taining 77 samples, 58 coming from DLBCL patients and 19 from Bcell lymphoma patients. (4) Myeloma dataset [18] containing 173 samples, 137 coming from patients with bone lytic lesions and 36 from control patients. We summarize the characteristics of these datasets in Table 1.
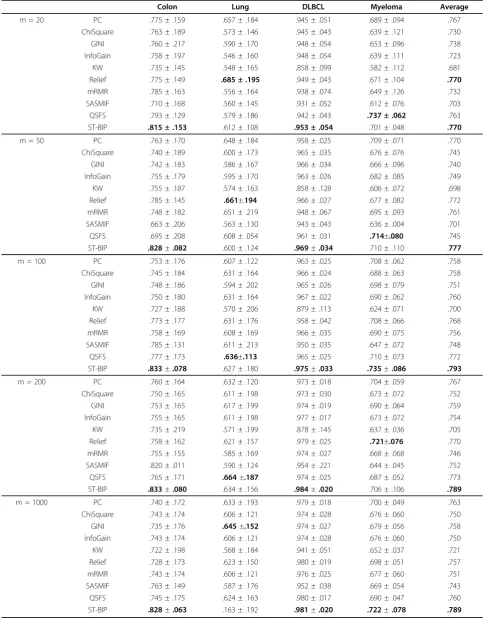
For each microarray dataset, we randomly selected 20 positive and 20 negative examples (except for choos-ing 15 positive and 15 negative in DLBCL dataset) as the training set and the rest as the test set. Due to the class imbalance in test sets, we used AUC, the area under the Receiver Operating Characteristic (ROC) curve, to evaluate the performance. The average AUC based on 10 repetitions of experiments on different random splits to training and test set are reported in Table 2. We Compared the AUC accuracy of different feature selec-tion algorithms form= 20, 50, 100, 200, 1000. For each dataset, the best AUC score among all methods was emphasized in bold. As shown in Table 2, our proposed method achieved the highest accuracy on Colon and DLBCL datasets. On the Myeloma dataset, it had the
highest accuracy whenm= 100 and 1000 and had the
second highest accuracy whenm= 20, 50 and 200. On
the Lung dataset, our algorithm was ranked in the upper half of the competing algorithms. The last column in
Table 2 shows the average AUC score across four differ-ent datasets. Our method achieved the highest average AUC scores. The next two successful feature selection algorithms are Relief and QSFS. The mRMR had some-what lower accuracy, comparable to simple filters such as PC, ChiSquare, GINI and InfoGain. SASMIF was consid-erably less accurate, while KW was the least successful.
Multi-task feature selection
In this section, we evaluate our proposed feature selec-tion algorithm for multi-task learning. We used 8 cancer related binary microarray classification datasets published in [19]. The data are summarized in Table 3. As shown in Table 3, the size of the 8 microarray datasets was very small. The single-task feature selection algorithms are not expected to perform well because there might be insufficient information even when simple feature selec-tion filters are used. In contrast, our multi-task feature selection algorithm is expected to improve the accuracy by borrowing strength across multiple microarray datasets.
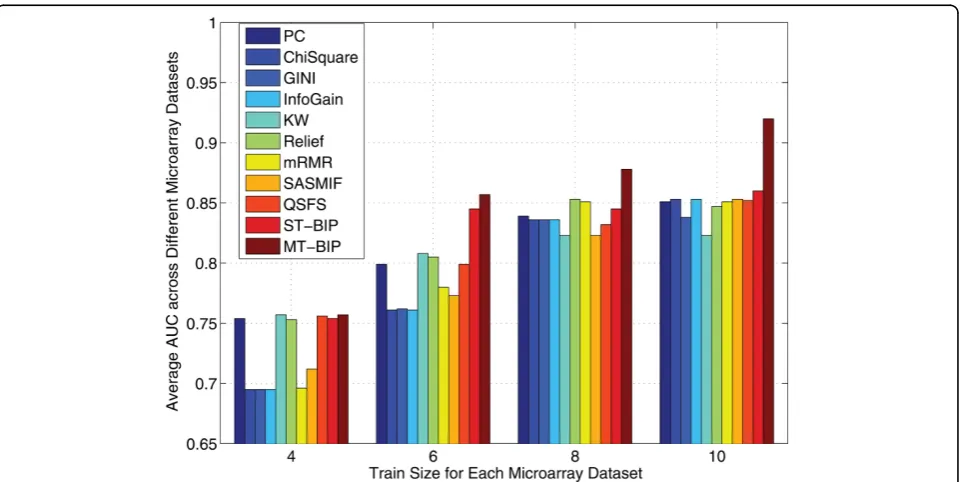
For each microarray data set, we randomly selectedN+= 2, 3, 4, 5 positive and the same number of negative exam-ples as the training data and used the rest as the test data. We show the results form= 100 in this section. The aver-age AUC across these 8 microarray datasets is shown in Figure 1. The results clearly show the multi-task version of our proposed algorithm was the most successful algorithm overall.
To gain a deeper understanding about the reason why the multi-task feature selection algorithm obtained better overall accuracy than single-task feature selection algo-rithms, we show the AUC score of each individual microar-ray dataset based onN+= 3in Table 4. We can see that the single task version of our feature selection algorithm had the highest overall accuracy among other single-task benchmarks, a result consistent with Table 2. The multi-task version of our algorithm has higher AUC than its sin-gle task version on 4 datasets and its average AUC is about 1.5% higher. In 4 cases, (e.g. Colon, Lung, Pancreas, Renal datasets) we can also observe the negative transfer, where the accuracy drops. How to prevent negative transfer in multi-task feature selection would be another interest research topic for our future research.
Gene-annotation enrichment analysis for multi-task microarray datasets
The multi-task experimental results show that accuracies obtained by MT-BIP are better than other single task fea-ture filters overall. So we would like to perform function annotation of the MP selected genes. In MT-BIP filter, only one selected gene list is obtained for all 8 different types of cancers. Given this gene list, the top 10 enriched GO terms were obtained using DAVID Bioinformatics Table 1 Summary of the Microarray Datasets
Colon Lung DLBCL Myeloma
# Samples 60(40/22) 86(24/62) 77(58/19) 173(137/36)
Table 2 Average AUC of 10 different feature selection algorithms on 4 different microarray datasets
Colon Lung DLBCL Myeloma Average
m = 20 PC .775 ± .159 .657 ± .184 .945 ± .051 .689 ± .094 .767
ChiSquare .763 ± .189 .573 ± .146 .945 ± .043 .639 ± .121 .730
GINI .760 ± .217 .590 ± .170 .948 ± .054 .653 ± .096 .738
InfoGain .758 ± .197 .546 ± .160 .948 ± .054 .639 ± .111 .723
KW .735 ± .145 .548 ± .165 .858 ± .099 .582 ± .112 .681
Relief .775 ± .149 .685 ± .195 .949 ± .043 .671 ± .104 .770
mRMR .785 ± .163 .556 ± .164 .938 ± .074 .649 ± .126 .732
SASMIF .710 ± .168 .560 ± .145 .931 ± .052 .612 ± .076 .703
QSFS .793 ± .129 .579 ± .186 .942 ± .043 .737 ± .062 .763
ST-BIP .815 ± .153 .612 ± .108 .953 ± .054 .701 ± .048 .770
m = 50 PC .763 ± .170 .648 ± .184 .958 ± .025 .709 ± .071 .770
ChiSquare .740 ± .189 .600 ± .173 .965 ± .035 .676 ± .076 .745
GINI .742 ± .183 .586 ± .167 .966 ± .034 .666 ± .096 .740
InfoGain .755 ± .179 .595 ± .170 .963 ± .026 .682 ± .085 .749
KW .755 ± .187 .574 ± .163 .858 ± .128 .606 ± .072 .698
Relief .785 ± .145 .661±.194 .966 ± .027 .677 ± .082 .772
mRMR .748 ± .182 .651 ± .219 .948 ± .067 .695 ± .093 .761
SASMIF .663 ± .206 .563 ± .130 .943 ± .043 .636 ± .004 .701
QSFS .695 ± .208 .608 ± .054 .961 ± .031 .714±.080 .745
ST-BIP .828±.082 .600 ± .124 .969±.034 .710 ± .110 .777
m = 100 PC .753 ± .176 .607 ± .122 .963 ± .025 .708 ± .062 .758
ChiSquare .745 ± .184 .631 ± .164 .966 ± .024 .688 ± .063 .758
GINI .748 ± .186 .594 ± .202 .965 ± .026 .698 ± .079 .751
InfoGain .750 ± .180 .631 ± .164 .967 ± .022 .690 ± .062 .760
KW .727 ± .188 .570 ± .206 .879 ± .113 .624 ± .071 .700
Relief .773 ± .177 .631 ± .176 .958 ± .042 .708 ± .066 .768
mRMR .758 ± .169 .608 ± .169 .966 ± .035 .690 ± .075 .756
SASMIF .785 ± .131 .611 ± .213 .950 ± .035 .647 ± .072 .748
QSFS .777 ± .173 .636±.113 .965 ± .025 .710 ± .073 .772
ST-BIP .833±.078 .627 ± .180 .975±.033 .735±.086 .793
m = 200 PC .760 ± .164 .632 ± .120 .973 ± .018 .704 ± .059 .767
ChiSquare .750 ± .165 .611 ± .198 .973 ± .030 .673 ± .072 .752
GINI .753 ± .165 .617 ± .199 .974 ± .019 .690 ± .064 .759
InfoGain .755 ± .165 .611 ± .198 .977 ± .017 .673 ± .072 .754
KW .735 ± .219 .571 ± .199 .878 ± .145 .637 ± .036 .705
Relief .758 ± .162 .621 ± .157 .979 ± .025 .721±.076 .770
mRMR .755 ± .155 .585 ± .169 .974 ± .027 .668 ± .068 .746
SASMIF .820 ± .011 .590 ± .124 .954 ± .221 .644 ± .045 .752
QSFS .765 ± .171 .664±.187 .974 ± .025 .687 ± .052 .773
ST-BIP .833±.080 .634 ± .156 .984±.020 .706 ± .106 .789
m = 1000 PC .740 ± .172 .633 ± .193 .979 ± .018 .700 ± .049 .763
ChiSquare .743 ± .174 .606 ± .121 .974 ± .028 .676 ± .060 .750
GINI .735 ± .176 .645±.152 .974 ± .027 .679 ± .056 .758
InfoGain .743 ± .174 .606 ± .121 .974 ± .028 .676 ± .060 .750
KW .722 ± .198 .568 ± .184 .941 ± .051 .652 ± .037 .721
Relief .728 ± .173 .623 ± .150 .980 ± .019 .698 ± .051 .757
mRMR .743 ± .174 .606 ± .121 .976 ± .025 .677 ± .060 .751
SASMIF .763 ± .149 .587 ± .176 .952 ± .038 .669 ± .054 .743
QSFS .745 ± .175 .624 ± .163 .980 ± .017 .690 ± .047 .760
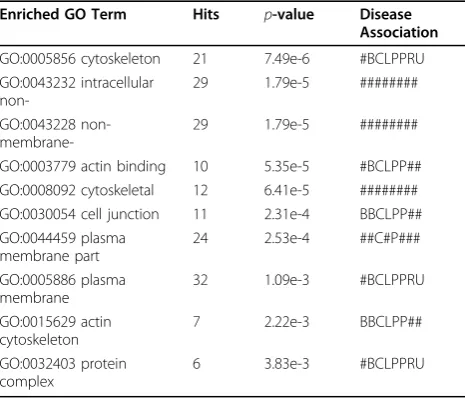
Resources [20]. The top 10 enriched GO terms based on MT-BIP selected gene list is shown in Table 5. In this table, the hits means the number of genes that are found in the selected gene list associating with the specific GO
term. The p-value was obtained by Fisher Exact test
which is used to measure the gene-enrichment in annota-tion terms. After we got the enriched GO terms, we used the Comparative Toxicogenomics Database (CTD) [21] to check whether there is an association between the GO term and the cancer type. The last column in Table 5 shows the disease association for each GO term. The datasets are ordered as Bladder (B), Breast (B), Colon (C), Lung (L), Pancreas (P), Prostate (P), Renal (R) and Uterus (U). If a GO term is associated with the given type of cancer, we write down the cancer name. Otherwise, we put the symbol # in that position. We could see that the enriched GO terms based MT-BIP tends to associate many different types of cancer. As shown in Table 5, GO:0005856 (cytoskeleton) and GO:0005886 (plasma membrane) were associated with 7 different cancers. GO:003054 (cell junction), GO:0015629 (actin cytoskele-ton) and GO:0032403 (protein complex binding) are associated with 6 different cancers.
Conclusion
We proposed a novel feature filter method to select a fea-ture subset with discriminative power and minimal redundancy. The proposed feature selection method is based on quadratic optimization problem with binary integer constraints. It can be solved efficiently by relaxing the binary integer constrains and applying a low-rank approximation to the quadratic term in the objective. Furthermore, we extend our feature selection algorithm to multi-task classification problems. The empirical results on a number of microarray datasets show that in the single task scenario the proposed algorithm results in higher accuracy than the existing feature selection meth-ods. The results also suggest that our multitask feature selection algorithm can further improve the microarray classification performance.
Methodology
Feature selection by binary integer programming
Let us denote the training dataset as D= (xi,yi), i= 1, …,N, where xiis anM dimensional feature vector for
thei-th example andyiis its class label. Nis the
num-ber of training examples. Our objective is to select a fea-ture subset that is strongly predictive of class label and has low redundancy. We introduce a binary vector
w= [w1,w2, . . . ,wM]T to indicate which features are
selected:
wj=
1if feature j is selected
0if feature j is not selected (1) Table 3 Multi-Task Microarray Datasets(cancer:normal
case)
Bladder 18(11/7)
Lung 27(20/7)
Prostate 23(14/9)
Breast 22(17/5)
Renal 24(11/13)
Colon 26(15/11)
Pancreas 21(11/10)
Uterus 17(11/6)
So, the new feature vector for thei-th example after fea-ture selection can be represented asgi=xi⊙w, where the
symbol⊙denotes the pairwise product. Therefore,gij=xij,
forwj= 1 andgij= 0 forwj= 0. Alternatively,gican be
represented asgi=Wxi, whereWis a diagonal matrix and
its diagonal is the vectorw.
Intuitively, we would like the examples with the same class to be close (intra-class tightness) and the examples from different classes to be far away (inter-class separ-ability) in the spaces defined by selected features. The Euclidean distance between two examples xi andxj in
the new feature space can be calculated as
dij =||gi−gj|| 2
= ||xiw−xjw||2= ||Wxi−Wxj||2 (2)
The inter-class separability of the data can be mea-sured by a sum of the pairwise distances between exam-ples with different class labels
yi=yj
xiw−xjw
2
. (3)
The intra-class tightness of the data can be measured by a sum of the pair-wise distances between examples with the same class label
yi=yj
x
iw
−
x
jw
2
.
(4)Therefore, the problem of selecting a feature subset to maximize the intra-class tightness and inter-class separ-ability can be formulated as
min w
yi=yj
xiw−xjw 2
−
yi=yj
xiw−xjw 2
.(5)
Objective (5) can be rewritten as
min
wN
i=1
N
j=1
x
iw
−
x
jw
2A
ij,
(6)where matrix A is defined as:
A
ij=
1
if y
i=
y
j−
1
if y
i=
y
j(7)
In addition to the objective (5) or (6), in order to improve the diversity of selected features, we would like to select a feature subset with minimal redundancy. A feature is defined to be redundant if there is another feature highly correlated with it. Let us denote Qas a
symmetric positive semidefinite matrix with size M ×
M, whose elementQij represents the similarity between
featurei and featurej. Since the measurements of each feature across different samples are normal distributed, it is reasonable to use Pearson Correlation to measure the similarity between two features here. Also, the simi-larity matrix Qis positive semi-definite when Pearson Table 5 Top 10 enriched GO terms based on 100 MT-BIP
selected genes
Enriched GO Term Hits p-value Disease Association
GO:0005856 cytoskeleton 21 7.49e-6 #BCLPPRU GO:0043232 intracellular
non-29 1.79e-5 ########
GO:0043228 non-
membrane-29 1.79e-5 ########
GO:0003779 actin binding 10 5.35e-5 #BCLPP## GO:0008092 cytoskeletal 12 6.41e-5 ######## GO:0030054 cell junction 11 2.31e-4 BBCLPP## GO:0044459 plasma
membrane part
24 2.53e-4 ##C#P###
GO:0005886 plasma membrane
32 1.09e-3 #BCLPPRU
GO:0015629 actin cytoskeleton
7 2.22e-3 BBCLPP##
GO:0032403 protein complex
6 3.83e-3 #BCLPPRU
Table 4 Average AUC of 11 different feature selection algorithms on 8 different microarray datasets
Blad Breast Colon Lung Panc. Pros. Renal Uterus Ave
PC .991 .696 .816 .703 .78 .603 .916 .883 .799
ChiSquare .969 .625 .749 .669 .789 .636 .741 .908 .761
GINI .969 .625 .749 .669 .789 .636 .743 .917 .762
InfoGain .969 .625 .749 .669 .789 .636 .741 .908 .761
KW .903 .621 .907 .750 .876 .626 .870 .913 .808
Relief .991 .729 .795 .721 .796 .594 .929 .888 .805
mRMR .969 .650 .765 .682 .830 .682 .786 .875 .780
SASMIF .978 .739 .704 .671 .823 .650 .768 .854 .773
QSFS .991 .693 .817 .700 .788 .600 .916 .883 .799
ST-BIP .991 .679 .921 .782 .882 .612 .966 .910 .843
Correlation is used. Then, we define a redundancy among the selected set of features represented by vector
was their average pair-wise similaritywTQw/m2, where mis the number of selected features. Our objective is to minimize the redundancy defined in such way.
The first contribution of this paper is to formulate the feature selection task as a new quadratic programming problem subject to binary integer and linear constraints as follows,
The first term in (8), which is a linear term as shown in the followingProposition 1, tries to maximize the inter-class separability and intra-inter-class tightness of the data. It describes the discriminative power of the selected feature subset. The second quadratic term is the average pair-wise similarity score between the selected features, which results in reduction of feature redundancy. Parameterl is introduced to control the tradeoff between feature rele-vance and feature redundancy. SinceQis a positive semi-definite matrix, the proposed objective function is con-vex. The first constraint ensures that the resulting vector
w is binary, while the second constraint ensures
that exactlymfeatures are selected. The following pro-position establishes that the first term in the objective (8) is linear.
Proposition 1. The first term of the objective function (8) can be written as a linear termcTw, wherecis vector of size M with elements ci= (XTLX)ii, L is the Laplacian
matrix of A, defined as L = D − A. D is a diagonal degree matrix such thatDii=
jAij. The X is the N×M
feature matrix. Each row in X corresponds to one exam-ple. (XTLX)ii denotes the i-th element in the diagonal of
the matrix XTLX.
Proof. Let us denoteWas a diagonal matrix whereWii=
wi. Then,
Based onProposition 1, objective (8) can be rewritten as the following constrained quadratic optimization pro-blem,
There are two practical obstacles in solving (9): (1) Binary constraint of variable w, and (2) feature similarity
matrixQis with sizeM ×M, which implies high
com-putational cost for high dimensional data. In the next two sections, we will first relax the binary constraint,
and then we will apply a low-rank approximation to Q.
The resulting constrained optimization problem can be solved very efficiently, with linear time with respect to the number of featuresM.
Problem relaxation. Due to the binary constraint on the indictor vectorw, it is difficult to solve (9) [9]. To resolve this, we first relax the binary constraint onwby allowing its elements wi to be within the range [0,m].
Then, (9) could be approximated by
min
Now, (10) becomes a standard Quadratic Program-ming (QP) problem. The optimal solution can be obtained by a general QP solver (e.g., MOSEK [22]).
Low-rank approximation. The matrixQin (10) is of sizeM ×M . So, it results in high time and space cost if we work with high dimensional microarray data. There-fore, we would like to avoid the computational bottle-neck by using low-rank approximation techniques.
The matrix Qin (10) is symmetric positive semidefi-nite. So, it can be decomposed as Q=UΛUT, whereU is a matrix of eigenvectors andΛis a diagonal matrix
with corresponding eigenvalues of Q. By setting
α=12UTw, it follows that w=U− 1
2α. Therefore, problem (10) can be rewritten as
min
Typically, the rank ofQ(let us denote it ask) is much
smaller thanM,k M.Therefore, we can replace the
topkeigenvectors and eigenvalues, resulting in anM×k matrixUkand ak×kdiagonal matrixΛk, without losing
much information. Therefore, (11) is reformulated as
min
is reduced to a new QP in a k-dimensional space with
M + 1 constraints. Once the solution a of (12) is
obtained, the variable w in original space can be
approximated byw=U
k
−12
k α.
Decomposing matrixQrequires O(M3) time, which is expensive in microarray data where Mis large. Next we will show how to efficiently compute the topk eigenvec-tors and eigenvalues using Nystrom approximation
tech-nique [23]. Nystrom method approximates a M ×M
symmetric, positive semi-definite matrixQby
Q=EMkWkk−1ETMk (13)
where EMkdenotes the sub-matrix of Q created by
selectingkof its columns, andWkk is a sub-matrix that
corresponds to the intersection of the selected columns and rows. Sampling schemes in Nystrom method include random sampling [23], probabilistic sampling
[24], andk-means based sampling [13]. We chose the
k-means sampling in our experiments because [13] showed that it produces very good low-rank approxima-tions at a relatively low cost. Given (13), we can easily obtain the low rank approximation of Q as
Q=GGTwhere G=EMkW
−1
2
kk .
(14)
As shown in the following Proposition 2, the top k
eigenvectors and eigenvalues can be computed inO(Mk2) time using Nystrom method, which is much more efficient
than doing eigen-decomposition of Q, which requires
O(M3) time.
Proposition 2.The top k eigenvectors Ukand the
cor-responding eigenvectorsΛk ofQ=GGTcan be
approxi-mated as Λk = ΛG andUk=GUG−
1 2
G , where UG and
ΛG are obtained by the eigen-decomposition of k × k
matrixGTG=U GGUTG
Proof. First, we observe thatUk contains orthonormal
columns.
Next, we observe that
UkkUkT=GUG
Our proposed feature selection algorithm is summarized in Algorithm 1. In the Algorithm 1, steps 1 to 5 require O(Mk2+k3) time. QP in step 6 withkvariables has a poly-nomial time complexity with respect tok. Step 7 requires O(Mk) time. Therefore, overall, the proposed feature selec-tion algorithm is very efficient and it has linear time com-plexity with the number of featuresM.
Algorithm 1Single-Task Binary Integer Program Fea-ture Selection
Input:training dataX, their labelsy, regularized para-meter l, number of featuresm, low-rank parameterk.
Output:mselected features
1. ApplyProposition 1to compute the vectorc
2. Usek-means to selectklandmark features for
low-rank approximation ofQ
3. ComputeEMkand Wkkin (13)
4. Obtain low-rank approximation ofQby (14) 5. ApplyProposition 2to compute the topk eigenva-lueΛkand eigenvectorUkofQ
6. Obtainaby solving the lower dimensional QP pro-blem(12).
7. Obtainwin original feature space asw=U
k−
1 2α 8. Rank the features according to the weight vectorw and select the topmfeatures
Multi-task feature selection by binary integer programming
Multi-task learning algorithms have been shown to be able to achieve significantly higher accuracy than single task learning algorithms both empirically [11] and theo-retically [25]. Motivated by these promising results, in this section, we extend our feature selection algorithm to the multi-task setting. The objective is to select fea-tures which are discriminative and non-redundant over multiple microarray datasets.
Let us suppose there areKdifferent but similar classi-fication tasks, and denote the training data of the t-th task as Dt={(xt
i, yti), i= 1, . . . , Nt}, where Nt is the
number of training examples of the t-th task. [10,11]
regularizer over allbs across Kclassification tasks could be expressed asMj=1(Kt=1||βtj||2), whereβtjis the
coef-ficient of thej-th feature in thet-th task. Due to theℓ1
norm on the ℓ2 norm of group of coefficients of each
feature across Ktasks, theℓ1,2norm regularizer selects
the same feature subset across K tasks. However, the
ℓ1,2 norm regularized problem is challenging to solve
because the non-smoothness of theℓ1,2 norm. In this
section, we would like to show our proposed feature selection can be easily extended to multi-task learning version. The resulting objective optimization problem have the same form as objective (9), which can be solve efficiently as shown in previous section.
Let us denotewtas the binary indicator defined in (1)
to represent the selected feature subset of thet-th classi-fication task. If we do not consider the relatedness between these Kclassification task, individual wtcould
be obtained by applying Algorithm 1to different classi-fication tasks. Based on the conclusion given by [10,11], it would be beneficial to select the same feature subset across Krelated classification task. In our case, this is can be achieved by settingwt =w∀ t. Therefore, the
same feature acrossKtasks, defined by vectorw, can be obtained by solving the following optimization problem,
min
wherecjandQjare the linear and quadratic terms of the
QP corresponding to thej-th task. The details about how to compute thecjandQjare explained in the previous
sec-tion. The technique of relaxing binary integer constraints and applying low-rank approximation toQintroduced in the previous section can be used to solve (15). The extended multi-task feature selection algorithm is also a feature filter. It can be used in conjunction with any super-vised learning algorithm.
Competing interests
The authors declare that they have no competing interests.
Authors’contributions
LL and SV conceived the study and developed the algorithm. LL wrote the first draft of the manuscript. Both authors participated in the preparation of the manuscript and approved the final version.
Acknowledgements
This work was supported by the U.S. National Science Foundation Grant IIS-0546155.
Declarations
Publication of this work was supported by the U.S. National Science Foundation Grant IIS-0546155.
This article has been published as part ofBMC ProceedingsVolume 7 Supplement 7, 2013: Proceedings of the Great Lakes Bioinformatics Conference 2013. The full contents of the supplement are available online at http://www.biomedcentral.com/bmcproc/supplements/7/S7.
Published: 20 December 2013
References
1. Guyon I, Elisseeff A:An Introduction to Variable and Feature Selection.
Journal of Machine Learning Research2003, 1157-1182.
2. Saeys Y, Inza I, Larranãga P:A review of feature selection techniques in bioinformatics.Bioinformatics2007,23(19):2507-2517.
3. Liu H, Setiono R:A probabilistic approach to feature selection - a filter solution.Proceedings of the Thirteeth th International Conference on Machine Learning1996, 319-327.
4. Kohavi R, John G:Wrappers for Feature Subset Selection.Artificial Intelligence1997,97:273-324.
5. Guyon I, Weston J, Barnhill S, Vapnik V:Gene Selection for Cancer Classification using Support Vector Machines.Machine Learning2002,
46:389-422.
6. Tibshirani RJ:Regression Shrinkage and Selection via the Lasso.Journal of the Royal Statistical Society, Series B1996,58:267-288.
7. Peng H, Long F, Ding CHQ:Feature Selection Based on Mutual Information: Criteria of Max-Dependency, Max-Relevance, and Min-Redundancy.IEEE Transactions on Pattern Analysis and Machine Intelligence
2005,27(8):1226-1238.
8. Lujan IR, Huerta R, Elkan C, Cruz CS:Quadratic Programming Feature Selection.Journal of Machine Learning Research2010,11:1491-1516. 9. Liu S, Liu H, Latecki LJ, Yan S, Xu C, Lu H:Size Adaptive Selection of Most
Informative Features.Proceedings of the Twenty-Fifth AAAI Conference on Artificial Intelligence2011.
10. Argyriou A, Evgeniou T, Pontil M:Convex multi-task feature learning.
Machine Learning2008,73(3):243-272.
11. Obozinski G, Taskar B, Jordan MI:Joint covariate selection and joint subspace selection for multiple classification problems.Statistics and Computing2010,20(2):231-252.
12. Kira K, Rendell LA:A Practical Approach to Feature Selection.
Proceedings of the Ninth International Conference on Machine Learning
1992, 249-256.
13. Zhang K, Kwok JT, Parvin B:Prototype vector machine for large scale semi-supervised learning.Proceedings of the Twenty-sixth International Conference on Machine Learning2009, 1233-1240.
14. Fan RE, Chang KW, Hsieh CJ, Wang XR, Lin CJ:LIBLINEAR: A Library for Large Linear Classification.Journal of Machine Learning Research2008,
9:1871-1874.
15. Alon U, Barkai N, Notterman DA, Gish K, Ybarra S, Mack D, Levine AJ:Broad patterns of gene expression revealed by clustering analysis of tumor and normal colon tissues probed by oligonucleotide arrays.The Proceedings of the National Academy of Sciences USA1999, 6745-6750. 16. Beer DG, Kardia SL, Huang CC, Giordano TJ, Levin AM, Misek DE, Lin L,
Chen G, Gharib TG, Thomas DG, Lizyness ML, Kuick R, Hayasaka S, Taylor JM, Iannettoni MD, Orringer MB, Hanash S:Gene-expression profiles predict survival of patients with lung adenocarcinoma.Nature Medicine2002, 816-824.
17. Shipp MA, Ross KN, Tamayo P, Weng AP, Kutok JL, Aguiar RC,
Gaasenbeek M, Angelo M, Reich M, Pinkus GS, Ray TS, Koval MA, Last KW, Norton A, Lister TA, Mesirov J, Neuberg DS, Lander ES, Aster JC, Golub TR:
Diffuse large B-cell lymphoma outcome prediction by gene-expression profiling and supervised machine learning.Nature Medicine2002, 68-74. 18. Tian E, Zhan F, Walker R, Rasmussena E, Ma Y, Barlogie B, Shaughnessy J:
The role of the Wnt-signaling antagonist DKK1 in the development of osteolytic lesions in multiple myeloma.New England Journal of Medicine
2003, 2483-2494.
19. Ramaswamy S, Tamayo P, Rifkin R, Mukherjee S, Yeang CH, Angelo M, Ladd C, Reich M, Latulippe E, Mesirov JP, Poggio T, Gerald W, Loda M, Lander ES, Golub TR:Multiclass cancer diagnosis using tumor gene expression signatures.Proceedings of the National Academy of Sciences USA
2001, 15149-54.
20. Da Wei Huang BTS, Lempicki RA, et al:Systematic and integrative analysis of large gene lists using DAVID bioinformatics resources.Nature protocols
21. Davis AP, King BL, Mockus S, Murphy CG, Saraceni-Richards C, Rosenstein M, Wiegers T, Mattingly CJ:The comparative toxicogenomics database: update 2011.Nucleic acids research2011,39(suppl 1):D1067-D1072. 22. Andersen ED, Andersen KD:The MOSEK interior point optimizer for linear
programming: an implementation of the homogeneous algorithm.High Performance Optimization2000, 197-232.
23. Williams CKI, Seeger M:The Effect of the Input Density Distribution on Kernel-based Classifiers.Proceedings of the Seventeenth International Conference on Machine Learning2000, 1159-1166.
24. Drineas P, Mahoney MW:On the Nyström Method for Approximating a Gram Matrix for Improved Kernel-Based Learning.Journal of Machine Learning Research2005,6:2153-2175.
25. Ben-David S, Schuller R:Exploiting Task Relatedness for Multiple Task Learning.COLT: Proceedings of the Workshop on Computational Learning Theory2003.
doi:10.1186/1753-6561-7-S7-S5
Cite this article as:Lan and Vucetic:Multi-task feature selection in microarray data by binary integer programming.BMC Proceedings2013
7(Suppl 7):S5.
Submit your next manuscript to BioMed Central and take full advantage of:
• Convenient online submission
• Thorough peer review
• No space constraints or color figure charges
• Immediate publication on acceptance
• Inclusion in PubMed, CAS, Scopus and Google Scholar
• Research which is freely available for redistribution