R E S E A R C H
Open Access
HCV genotype-specific correlation with serum
markers: Higher predictability for genotype 4a
Waqar Ahmad
1, Bushra Ijaz
1, Fouzia T Javed
2, Humera Kausar
1, Muhammad T Sarwar
1, Sana Gull
1, Sultan Asad
1,
Imran Shahid
1and Sajida Hassan
1*Abstract
Background:Several factors have been proposed to assess the clinical outcome of HCV infection. The correlation of HCV genotypes to possible serum markers in clinical prediction is still controversial. The main objective of this study was to determine the existence of any correlation between HCV genotypes to viral load and different clinical serum markers.
Methods:We performed a prospective cross-sectional and observational study. About 3160 serum HCV RNA positive patients were chosen from 4020 randomly selected anti-HCV positive patients. Statistical analysis was performed using the SPSS 16 software package. ROC (receiver operating characteristics) curves were used to compare diagnostic values of serum markers to predict genotypes.
Results:The most prevalent genotype was 3a (73.9%) followed by 1a (10.7%), 4a (6.4%) and 3b (6.1%) in Pakistani population. No correlation was found between viral load and serum markers for genotype 3a in a large no. of sample (n = 2336). While significant correlation was observed between viral load and AST in genotype 3b, ALP with viral load and ALT for genotype 1a. Patients with genotype 4a showed a significant inverse correlation with viral load and Hb level and AST with ALP. For genotype 4a, AUC (area under the curve) of ALT, ALP, AST, bilirubin, Hb level and viral load was 0.790, 0.763, 0.454, 0.664, 0.458 and 0.872 respectively.
Conclusions:In conclusion, there was a significant variable response of HCV genotypes with serum markers. Severity of disease is independent of serum marker level in genotype 3a, while the liver damage in genotype 4a may associate with viral cytopathic effect as well as the immune-mediated process. An index using six serum markers may correctly predict genotype 4a in patients with≥75% accuracy.
Introduction
Hepatitis C virus (HCV) is a major cause of liver asso-ciated diseases all over the world. An estimated 3% of the world’s populations (more than 350 million people) are chronically infected with HCV, which is the main cause of liver fibrosis, cirrhosis and hepatocellular carci-noma (HCC) in a substantial number of patients [1,2]. Due to considerable sequence diversity and sequence comparisons in different parts of hepatitis C virus gen-ome, classification of the virus into a series of genotypes showed distinct geographical and frequency distribution across the whole world [3-6].
Approximately, 10 million people in Pakistan are infected with HCV [7]. It is well established factor that in patients infected with HCV, the clinical findings, geno-types and viral load are strong predictors for the outcome of antiviral therapy [8,9]. The most prevalent genotype in Pakistan is 3a followed by 3b and 1a [10]. Due to high prevalence of genotype 3a in Pakistan; HCV genotyping is not recommended for HCV infected patients routinely by Pakistan’s Society of Gastroenterology [11]. Secondly, due to poverty and cost of genotyping test, many patients refused to do genotyping. Nevertheless, genotyping is important because it not only provides information as to strain variation and potential association with disease severity but also related to the possibility of treatment response, as the treatment plan of chronic HCV infection with interferon varies with the genotype being treated [12,13]. It is reported that treatment with interferon is * Correspondence: [email protected]
1
Applied and Functional Genomics Lab, Centre of Excellence in Molecular Biology, University of the Punjab, Lahore-53700, Pakistan
Full list of author information is available at the end of the article
more effective in patients with genotypes 2 and 3 than in patients infected with genotypes 1 and 4 [14,15]. Several studies revealed that HCC develops in 1-4% of patients and liver biopsy is considered the gold standard to iden-tify liver fibrosis. Unfortunately, procedure of liver biopsy is invasive, expensive and unsuitable for all patients with severe side effects leading to death [1,11,15,16]. An assessment of the disease development based on clinical findings is still critical for patients infected with HCV. At present, the clinicopathological significance of serum bio-chemical markers and viral load and their relationship among different genotypes is not well known. Several authors tried to find accurate noninvasive markers of liver damage and developed correlations between the serum hyaluronic acid levels, collagen level, platelet count, serum bilirubin levels, HCV viral load, genotypes and elevated ALT/AST levels in HCV infected patients, but no clear conclusions were formed [17-23].
In present study, we investigated the correlation of sev-eral clinical findings like Hb level, bilirubin level, ALT, ALP and AST and viral load in patients with different genotypes. The ideal serum markers for genotype deter-mination should have good sensitivity, be readily avail-able, inexpensive, reproducible, safe and able to predict genotypes with accuracy. The need of genotyping may be eradicated if the serum biochemical markers with high positive or negative predictive values of several genotypes can be obtained and thus minimize the cost of genotyp-ing and liver biopsy.
Materials and methods
Patients
Patients of this study were the people referred to Pathol-ogy department, Jinnah Hospital, Lahore, Pakistan, for biochemical and serological tests. This analytical study was carried out from March 2007 to September 2009 with collaboration of National Centre of Excellence in Molecular Biology, University of the Punjab, Lahore, Pakistan. Blood samples (10 mL) were collected from each patient and tested for anti-HCV antibody by ELISA. Adult (≥18 years) patients with positive serology and/or positive test for HCV alone and no evidence of liver fail-ure were included in this study. Patients who were not keen to give informed consent, not able to make follow-up visits and not willing to undergo genetic testing and allow samples to be stored for future research were excluded from the study. Accordingly, thus, 3160 HCV-RNA positive patients from 4020 HCV antibody (anti-HCV)-positive persons were identified. Questioner (including their personal, lab tests and demographical information, possible transmission route of HCV infec-tion, clinical, virological and biochemical data) was pre-pared for patients who came for HCV initial screening and further genotyping and viral load quantification. The
routine liver function tests (LFTs), Hb level and direct bilirubin were estimated for each patient in the hospital laboratory. Informed consent was obtained from patients. The study was approved by the institutional ethical committee.
HCV antibody and viral assays
HCV detection and genotyping was performed at the Department of Pathology, Jinnah Hospital, Lahore, Paki-stan. RNA was extracted from 140µl of serum samples using QIAamp viral RNA extraction kit (Qiagen, USA) according to the manufacturer’s protocol. cDNA was synthesized using Moloney murine leukemia virus (MmLV) followed by PCR using primers derived from the 5’UTR non-coding region of HCV genome described by Chanet al.[24]. For HCV RNA quantification, Qiagen HCV RG RT-PCR assay was used. Quantification was car-ried out with 10 ul of the extracted RNA on Rotor-gene Real-Time PCR machine (USA) using fluorescent probes to detect amplification after each replicating cycle as described by manufacturer protocol. The lower limit of detection for this assay is 1000 IU/ml HCV and genotyp-ing was carried out usgenotyp-ing Invader HCV genotypgenotyp-ing assay (Third wave technology, USA). Briefly, 100 ng of the HCV RNA was reverse transcribed to cDNA using 200 U of MmLV (Invitrogen, USA). From the amplified product, 2µl were taken and the genotyping assay was performed for 12 different HCV types.
Statistical analysis
plotting sensitivity of the assays against false positivity (1-specificity [25]. Comparison of the area under the curve (AUC) was used to assess the overall diagnostic values of serum markers.
Results
Prevalence of HCV infection
Of the 4020 ELISA positive patients, 3160 (78.6%) showed positive PCR while 860 (21.4%) were negative for HCV. Out of 3160 patients with positive PCR, 1515 (48%) were males while 1645 (52%) were females. The median age of patients was 37 years (range 18-75). Age of the patients was taken as a continuous as well as a categorical variable. Patients were divided into two age groups i.e.≤40 years and >40 years. In age group≤40 years there were 2119 patient, while age group >40 years include 1041 patients.
Genotype distribution among patients
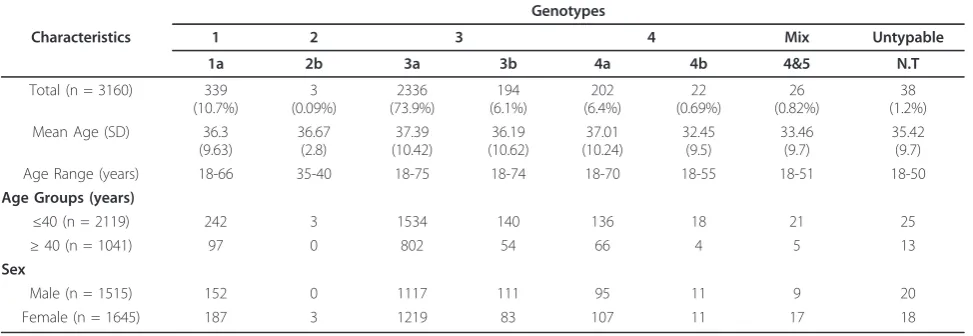
Based on weighted analysis of patients infected with HCV, the most frequently detected genotype was 3 (80%), with predominant subtype 3a (73.9%) and 3b (6.1%). Genotype 1 (10.7%) was exclusively consisted of the subtype 1a, while genotype 4 (7.1%) comprised the subtype a (6.4%) and b (0.7%). Patients with mix geno-type 4 &5 (0.8%) and untypable genogeno-type 1(0.2%) were also identified. The genotype 2b was detected in only three (0.1%) patients. The frequency distribution of dif-ferent genotypes according to age groups and gender is given in Table 1. Distribution of genotypes among age groups was not statistically different (p= 0.488). Geno-type subGeno-type 3a was the most prevalent genoGeno-type in both age groups followed by 1a. Only three patients (0.14%) with genotype 2b were observed in age group
≤40 years. Overall prevalence of genotypes within gen-der was also statistically non-significant (p= 0.098).
Association of age, gender and genotypes with serum markers and viral load
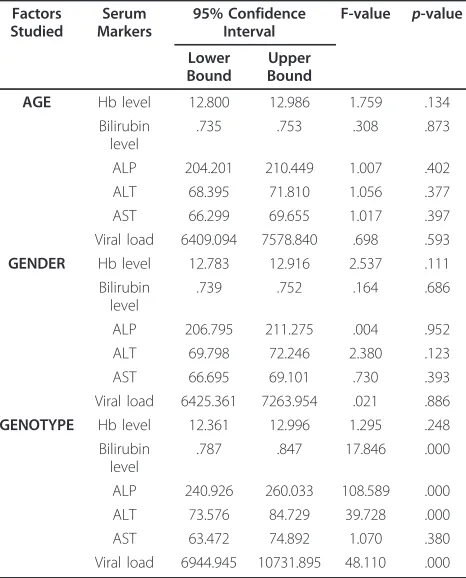
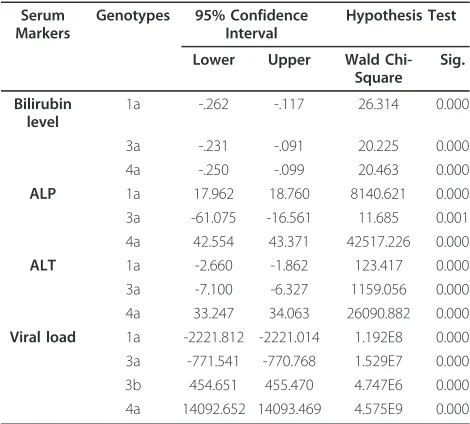
Univariate analysis (Table 2) revealed that all serum mar-kers were independently distributed between gender and age groups while serum markers including direct bilirubin level, serum ALP and ALT levels and viral load were sig-nificantly different among genotypes. Box plots of the above four significant serum markers with eight different HCV genotypes are shown in Figure 1. The overall mean bilirubin value was 0.74 ± 0.18 mg/dL. The bilirubin level was high in genotype 2b (0.80 ± 0.10), 4a (0.81 ± 0.05), 4b (0.90 ± 0.12), 4&5 (0.89 ± 0.003) and untypable (0.88 ± 0.09) while genotype 1a (0.706 ± 0.14) and 3a (0.735 ± 0.20) showed a low bilirubin level. Serum ALP levels (mean 209.03 ± 64 IU/mL) were higher in genotype 1a (251 ± 62.2), 2b (287 ± 36.37), 3b (221.1 ± 70.1), 4a (275.7 ± 70.5), 4b (227.2 ± 72.1), 4&5 (232.7 ± 63.1) and untypable (315.1 ± 54.1) in comparison to genotype 3a (193.9 ± 54.3). Serum levels of ALT (mean value 71.1 ± 35.06 IU/mL) were significantly elevated in 2b (105 ± 9.64) and 4a (108.1 ± 35.6) genotypes as compared to 1a (72.1 ± 36.5), 3a (67.6 ± 32.9), 3b (72.6 ± 35.6), 4b (75.6 ± 31.3) and mix genotype 4&5 (74.4 ± 37.02), while serum ALT levels were significantly low in patients with untyp-able genotype (57.65 ± 23.5). Viral load varied from 1.1 × 10³IU/mL to 8.5 × 10⁸IU/mL (mean, 6.8 × 10⁷± 1.2 × 10⁸). The viral load was significantly higher in genotype 2b (1.5 × 10⁷± 2.3 × 10⁷) and 4a (2.1 × 10⁷± 1.1 × 10⁷) while the patients with genotype 1a (4.5 × 10⁶ ± 9.8 × 10⁶), 3a (5.9 × 10⁶± 1.1 × 10⁷), 3b (7.1 × 10⁶± 1.1 × 10⁷), 4b (1.9 × 10⁶± 3.1 × 10⁶), 4&5 (6.7 × 10⁶± 1.1 × 10⁷) and untype-able (8.1 × 10⁶± 1.1 × 10⁷) showed intermediate viremia levels. Genotype 2b, 4b, mix and untypable were elimi-nated from further analysis because of small sample size. Further Multivariate analysis in Table 3 revealed that
Table 1 Genotype-specific representation according to gender and age
Genotypes
Characteristics 1 2 3 4 Mix Untypable
1a 2b 3a 3b 4a 4b 4&5 N.T
Age Range (years) 18-66 35-40 18-75 18-74 18-70 18-55 18-51 18-50
bilirubin, ALP, ALT levels and viral load were significantly different among genotypes 1a, 3a, 3b and 4a.
Correlation of Significant Serum Markers and Viral load within HCV genotypes
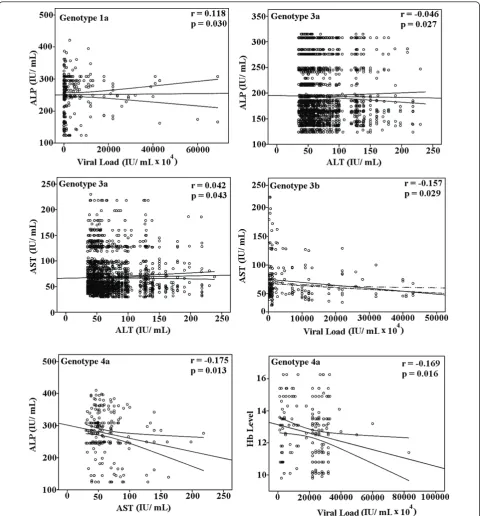
A correlation of significant serum markers with each other and viral load in HCV infected patients is illu-strated in Figure 2 showed that viral load has positive correlation with ALP in genotype 1a (r = 0.118, p= 0.030), linear significant correlation of viral load and AST was found in 3b (r = -0.157, p = 0.029), while negative linear correlation of Hb level with viral load in genotype 4a, was observed (r = -0.169, p = 0.016). Regarding relationship between clinical factors, we observed significant correlations between ALP and ALT (r = -0.214, p= 0.000) in genotype 1a (Figure 3), ALT and AST (r = 0.042,p= 0.043) and ALP and ALT (r = -0.046, p= 0.027) in genotype 3a, and AST and ALP (r= -0.175,p= 0.013) in genotype 4a.
Determination of cutoff values of serum markers to predict genotypes
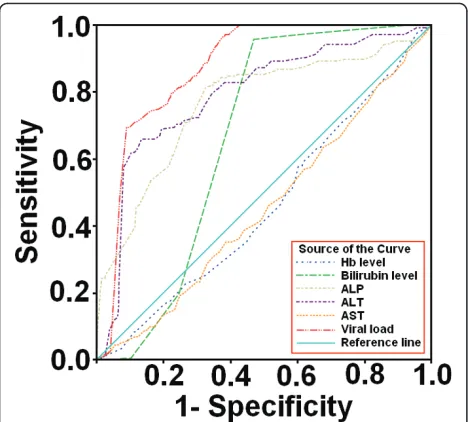
ROC curves (Figure 4) to predict genotypes among patients were plotted against serum markers and we were able to found best cutoff points for genotype 4a. The best cutoff values calculated to predict genotype 4a
were as: Hb level ≤ 11.85 g/dL, bilirubin level ≥ 0.75 mg/ dL, ALP level ≥ 243 IU/ mL, ALT≥ 125 IU/ mL, AST level ~ 40-75 IU/ mL and serum viral load ≥1 × 10⁷ IU/mL. The cut off values with significant positive predictive values (PPV) and negative predictive values (NPV) and specificity and sensitivity for genotypes 4a are given in Table 4. ALT, ALP, viral load and bilirubin levels showed high PPV and NPV as compared to AST and Hb level. Moreover, during evaluation the area under the curve (AUC) of each serum marker as illu-strated in Table 5 we observed high AUC for ALP 0.763 (95% Cl 0.724-0.801, p = 0.000), ALT 0.790 (95% Cl 0.756-0.824, p = 0.000) and viral load 0.872 (95% Cl 0.854-0.890,p= 0.000) while bilirubin level 0.664 (95% Cl 0.641-0.0.686,p= 0.000), AST 0.454 (95% Cl 0.414-0.494, p = 0.028) and Hb level 0.458 (95% Cl 0.418-0.497,p= 0.045) showed moderate AUC.
Discussion
The difference in distribution of HCV genotypes sug-gests the subsistence of diverse form of disease acquire-ment. The basic aim of this study was to evaluate the predictive value of a combination of basic serum bio-chemical markers for the diagnosis of genotypes and their relation to disease outcome.
The present study was conducted in randomly selected samples of general population in Pakistan (Table 1). Our patient’s data showed no significant dif-ferences in genotype distribution in relation to gender and age groups. Various genotypes, particularly 1, 3 and 4 were equally distributed in gender and age groups. Prevalence of genotype in our study was: genotype 3 (n = 2530, 80%), followed by genotype 1 (n = 339, 10.8%) and genotype 4 (n = 224, 7.08%). Subtypes 3a, 1a and 4a were predominant, whereas mix subtype 4a/5a was also found in some patients (n = 26, 0.8%). Among patients, 1.2% (n = 38) showed untypable genotype.
The correlation among HCV genotypes with viral load and serum markers and their association with disease severity and sensitivity to interferon treatment remains controversial till date [26,27]. Evaluating the correlation between different clinical markers with genotypes, our results showed that a combination of four clinical mar-kers (ALT, AST, ALP and bilirubin level) and serum viral load can have high positive or negative predictive value for diagnosis of different HCV genotypes. Our data showed significant increase in bilirubin levels in patients with genotypes 4, mix (4&5) and untypable. High bilirubin level is usually associated with liver metastases and liver tumor involvement leading to hepa-tocellular carcinoma and liver cirrhosis by active or non-active HCV or HBV [28]. As different genotypes lead to diverse severity levels of liver disease so the treatment plan of chronic HCV infection with interferon varies Table 2 Univariate analysis of patient’s data by age, sex
and genotype
AGE Hb level 12.800 12.986 1.759 .134
Bilirubin level
.735 .753 .308 .873
ALP 204.201 210.449 1.007 .402
ALT 68.395 71.810 1.056 .377
AST 66.299 69.655 1.017 .397
Viral load 6409.094 7578.840 .698 .593
GENDER Hb level 12.783 12.916 2.537 .111 Bilirubin
level
.739 .752 .164 .686
ALP 206.795 211.275 .004 .952
ALT 69.798 72.246 2.380 .123
AST 66.695 69.101 .730 .393
Viral load 6425.361 7263.954 .021 .886
GENOTYPE Hb level 12.361 12.996 1.295 .248 Bilirubin
level
.787 .847 17.846 .000
ALP 240.926 260.033 108.589 .000
ALT 73.576 84.729 39.728 .000
AST 63.472 74.892 1.070 .380
with the genotype being treated [29]. Bilirubin may be used as marker of liver injury and to determine the proper dose of interferon in patients with different gen-otypes. Elevated aminotransferases levels act as indica-tors of liver cell injury and are usually predominant in liver cirrhosis with increased ALT levels [20,30]. We observed elevated ALT and AST levels in all genotypes compared to normal range but in patients infected with genotype 4a values were quite higher (>2 times to nor-mal range 5-40 IU/ mL). These results could lead to the confirmation association of genotype 4a with increased risk of cirrhosis [31]. In previous studies, serum ALP levels were not considered valuable markers during HCV diagnosis but recent studies revealed that the higher levels of ALP are usually associated with liver metastasis, extraheptic bile obstruction, primary biliary cirrhosis, intraheptic cholestasis, infiltrative liver disease, hepatitis, cirrhosis, primary sclerosisng cholangitis, hepa-tic lymphoma, liver abscess, sarcoidosis and congestive cardiac failure [31-33]. A change in ALP levels greater Figure 1Variation of significant serum markers among genotypes. Box plots of four significant serum markers i.e. viral load, bilirubin level, Serum ALP and ALT in relation with eight different HCV genotypes. The line through the middle of the box is the median while the top and bottom of the box are 25thand 75thpercentiles.
Table 3 Multivariate analysis of significant serum markers among genotypes 1a, 3a, 3b and 4a
Serum Markers
Genotypes 95% Confidence Interval
Hypothesis Test
Lower Upper Wald Chi-Square
Sig.
Bilirubin level
1a -.262 -.117 26.314 0.000
3a -.231 -.091 20.225 0.000
4a -.250 -.099 20.463 0.000
ALP 1a 17.962 18.760 8140.621 0.000
3a -61.075 -16.561 11.685 0.001
4a 42.554 43.371 42517.226 0.000
ALT 1a -2.660 -1.862 123.417 0.000
3a -7.100 -6.327 1159.056 0.000
4a 33.247 34.063 26090.882 0.000
Viral load 1a -2221.812 -2221.014 1.192E8 0.000
3a -771.541 -770.768 1.529E7 0.000
3b 454.651 455.470 4.747E6 0.000
than 120 U/L can be indicative of advanced disease pro-gression [34]. In our study patients with genotype 4a reflected high ALP levels as compared to others as illu-strated in Figure 1.
Patients infected with genotype 3a showed negative correlation between ALP and ALT while a positive
A linear relationship established between serum HCV RNA levels and amount of virus in liver or serum HCV RNA levels and liver injury and vice versa in many stu-dies. The involvement of different factors like different clinico-histopathological evaluation procedures [2,16] can lead to the opinion that liver injury in HCV infec-tion due to genotype 3a is not directly associated with serum viremia levels or the number of infected hepato-cytes. Zechini et al found a relation between HCV viral load and AST. However, we observed a negative correla-tion between viral load and AST in genotype 3b that
may be due to poor immune response resulting in lower AST level and higher viral load and vise versa lead to liver damage [19,36].
In patients infected due to genotype 1a, viral load showed significant positive correlation with ALP, and ALP with ALT. Serum ALT and ALP can be used for assessing the liver function status in anti-HCV positive patients [37]. As elevated levels of ALP, ALT and AST are associated with liver injury leading to cirrhosis, HCV infection with genotype 1a could lead to more severe liver damage as compared to genotype 3.
In our study patients infected with genotype 4a showed high serum viral loads as compared to others, while an inverse correlation between viral load and Hb level and serum AST and ALP levels in genotype 4a was also observed. Kato et al monitored significantly higher HCV RNA level in patients with chronic active hepatitis and cirrhosis compared to chronic persistent hepatitis [38]. As HCV is associated with many extra hepatic complications involving renal, articular, neuorologic, cutaneous and haemopoietic systems, several autoim-mune phenomenon are observed in patients infected with HCV [39,40], decline of Hb level with increase of viral load in genotype 4 may lead to autoimmune hae-molytic anemia (AIHA) that can contribute to enhance the liver cirrhosis in genotype 4 as the patients with HCV related AIHA have higher prevalence of cirrhosis Figure 3Association of ALP and ALT in HCV genotype 1a. A
negative significant correlation was observed between ALP and ALT in patients with genotype 1a.
Figure 4Receiver operator characteristic (ROC) curves of six serum markers. ROC curves were drawn to evaluate best cutoff points for predicting genotypes. ROC curves of serum markers in patients showed that viral load, ALP, ALT and bilirubin level can better predict genotype 4a at given cutoff values.
Table 4 Sensitivity, specificity, and cutoff values of the six serum markers to predict genotype 4a
SERUM MARKERS
Cutoff values Sensitivity Specificity PPV (%)
NPV (%) Hb level 11.85 g/dL 60 37 65 44
Bilirubin level
0.75 mg/ dL 96 53 96 60
ALP 243 IU/ mL 81 62 82 78
ALT 125 IU/ mL 62 89 62 96
AST ~ 40-75 IU/ mL 51 45 65 64
Viral load 1 × 10⁷IU/ mL 75 82 77 86
Table 5 AUROC analysis of serum markers for predicting genotype 4a in chronic HCV patients
Serum Marker
Area Std. Error
Significance 95% Confidence Interval Lower Bound
Upper Bound Hb level 0.458 0.020 0.045 0.418 0.497
Bilirubin level
0.664 0.011 0.000 0.641 0.686
ALP 0.763 0.020 0.000 0.724 0.801
ALT 0.790 0.017 0.000 0.756 0.824
AST 0.454 0.020 0.028 0.414 0.494
[41]. Higher ALP and bilirubin levels and mild increase in AST levels in patients with genotype 4a may lead to cholestatic hepatitis that is a severe form of HCV recur-rence after treatment and organ transplantation like liver, kidney and heart [42,43].
Based on our findings, we calculated the optimum cut-off values of serum markers by generating ROC curves to predict HCV genotypes in HCV-RNA positive patients. To assess the diagnostic accuracy of serum markers to evaluate patients require the selection of a decision threshold. As, both sensitivity and specificity are equally important in classifying patients with positive PCR for genotypes, we were able to find the best cutoff values of each serum marker for genotype 4a that can maximize the sum of sensitivity and specificity as illustrated in Table 4. At given cutoff values for each serum marker in patients infected with genotype 4a, 60% have raised ALT
≥125 IU/ mL, 82.5% have elevated ALP≥243 IU/ mL, 99.5% have bilirubin level more than≥0.8 mg/ dL and 95% with raised serum viremia levels up to≥1 × 10⁷IU/ mL, 75.2% have low Hb level (≤ 11.85g/ dL) and 65% showed mild increase in AST levels (40~75 IU/ mL). The percentage accuracy of each serum marker at given cutoff values is; Hb level 58%, bilirubin level 73.2%, ALP 70.3%, ALT 86.5%, AST 44.6% and viral load 84.6%. These all serum markers in combination may predict genotype 4a in patients with more than 75% accuracy.
In Pakistan due to poverty, doctors usually do not recommend the genotype testing, as they consider HCV 3a more prevalent and INF therapy responder, but due to high frequency of genotype 1a and 4a and for better dose administration, time course of INF therapy and sustainable response, importance of genotyping cannot be neglected. It is conceivable that serum viral load, ALT, ALP and bilir-ubin levels are suitable factors that may determine liver damage as well as HCV genotypes. Although all genotypes showed significant variable response to the serum markers, we were able to find serum markers with viral load that can predict genotype 4a, with more than 75% accuracy. However we recommend genotyping assay to find possible association with disease severity and guide about treat-ment duration and outcomes. Future studies are required in liver biopsy samples to confirm the association we found in this study.
Abbreviations
HCV: hepatitis C; PPV: positive predicted value; NPV: negative predicted value; AUC: area under the curve; ROC: receiver operating characteristic
Acknowledgements
The authors wish to thank all laboratory staff for their help in gathering data.
Author details
1
Applied and Functional Genomics Lab, Centre of Excellence in Molecular Biology, University of the Punjab, Lahore-53700, Pakistan.2Fouzia Tahir Javed,
Department of Pathology, Jinnah Hospital, Lahore-54590, Pakistan.
Authors’contributions
WA and BI contributed equally to this study. WA, BI and SH designed the study, analyze the data and wrote paper. AS, HK, SG, Sarwar MT and IS performed all lab work. FTJ and SA collected and arranged data. All work was performed under supervision of SH. All the authors read and approved final version of manuscript.
Competing interests
The authors declare that they have no competing interests.
Received: 1 April 2011 Accepted: 10 June 2011 Published: 10 June 2011
References
1. Alter MJ:Epidemiology of hepatitis C.Hepatology1997,26:62S-65S. 2. Giannini C, Bréchot C:Hepatitis C virus biology.Cell Death Differ2002,10:
S27-38.
3. Abid K, Quadri R, Veuthey AL, Hadengue A, Negro F:A novel hepatitis C virus (HCV) subtypes from Somalia and its classification into HCV Clade 3.J Gen Virol2000,81:1485-1493.
4. Candotti DJ, Temple J, Sakodie F, Allain JP:Frequent recovery and broad genotype 2 diversity characterize hepatitis C virus infection in Ghana, West Africa.J Virol2003,77(14):7914-7923.
5. Ndjomou J, Pybus OG, Matz B:Phylogenetic analysis of hepatitis C virus isolates indicates a unique pattern of endemic infection in Cameroon.J Gen Virol2003,84(9):2333-2341.
6. Simmonds P:Genetic diversity and evolution of hepatitis C virus-15 years on.J Gen Virol2004,85(11):3173-3188.
7. Raja NS, Janjua KA:Epidemiology of hepatitis C virus infection in Pakistan.J Microbiol Immunol Infect2008,41(1):4-8.
8. Kumar D, Farrell GC, Fung C, George J:Hepatitis C virus genotype 3 is cytopathic to Hepatocytes: Reversal of hepatic steatosis after sustained therapeutic response.Hepatology2002,36:1266-1272.
9. Manns MP, McHutchison JG, Gordon SC, Rustgi VK, Shiffman M, Reindollar R, Goodman ZD, Koury K, Ling M, Albrecht JK:Peginterferon alfa-2b plus ribavirin compared with interferon alfa-2b plus ribavirin for initial treatment of chronic hepatitis C: a randomised trial.Lancet2001, 358:958-965.
10. Ahmad W, Ijaz B, Javed FT, Jahan S, Shahid I, Khan FM, Hassan S:HCV genotype distribution and possible transmission risks in Lahore, Pakistan.World J Gastroenterol2010,16(34):4321-4328.
11. Hamid S, Umar M, Alam A, Siddiqui A, Qureshi H, Butt J:Pakistan Society of Gasteroenterology. PSG consensus statement on management of Hepatitis C virus infection–2003.J Pak Med Assoc
2003,54(3):146-150.
12. Derbala MF, Al Kaabi SR, El Deweik NZ, Pasic F, Butt MT, Yakoob R, Al-Marri A, Amer AM, Morad N, Bener A:Treatment of hepatitis C virus genotype 4 with peginterferon alfa-2a: impact of bilharziasis and fibrosis stage.World J Gasteroenterol2006,12(35):5692-5698.
13. Kabir A, Alavian SM, Keyvani H:Distribution of hepatitis C virus genotypes in patients infected by different sources and its correlation with clinical and virological parameters: a preliminary study.Comp Hepatol2006,5:4. 14. Tassopoulos NC, Papatheodoridis GV, Katsoulidou A, Delladetsima JK,
Sypsa V, Touloumi G, Nikandros M, Hatzakis A:Factors associated with severity and disease progression in chronic hepatitis C.
Hepatogastroenterology1998,45(23):1678-1683.
15. Adinolfi LE, Gambardella M, Andreana A, Tripodi MF, Utili R, Ruggiero G: Steatosis accelerates the progression of liver damage of chronic hepatitis C patients and correlates with specific HCV genotype and visceral obesity.Hepatology2001,33(6):1358-1364.
16. El-Serag HB:Hepatocellular carcinoma and hepatitis C in the United States.Hepatology2002,36:S74-S83.
17. Idrees M, Riazuddin S:Frequency distribution of hepatitis C virus genotypes in different geographical regions of Pakistan and their possible routes of transmission.BMC Infect Dis2008,8:69. 18. Azzari C, Resti M, Moriondo M, Ferrari R, Lionetti P, Vierucci A:Vertical
transmission of HCV is related to maternal peripheral blood mononucleat cell infection.Blood2009,96(6):2045-2048.
20. Imbert-Bismut F, Ratziu V, Pieroni L, Charlotte F, Benhamou Y, Poynard T: Biochemical markers of liver fibrosis in patients with hepatitis C virus infection: a prospective study.Lancet2001,357:1069-1075.
21. Kowala-Piaskowska A, Mozer-Lisewska I, Figlerowicz M, Sluzewski W: Influence of the presence of HCV-RNA in peripheral blood mononuclear cells on the clinical course of chronic hepatitis C in children.Eur J Epidemiol2007,22(5):343-348.
22. Pratt DS, Kaplan MM:Evaluation of abnormal liver-enzyme results in asymptmatic patients.N Eng J Med2000,342(17):1266-1271. 23. Silva RG Jr, Fakhouri R, Nascimento TV, Santos IM, Barbosa LM:Aspartate
aminotransferase-to-Platelet ration index for fibrosis and cirrhosis prediction in chronic hepatitis C patients.Braz J Infect Dis2008, 12(1):15-19.
24. Chan SW, McOmish F, Holmes EC, Dow B, Peutherer JF, Follett E, Yap PL, Simmonds P:Analysis of a new hepatitis C virus type and its phylogenetic relationship to existing variants.J Gen Virol1992, 94:3576-3582.
25. Zweig MH, Campbell G:Receiver-operating characteristic (ROC) plots: a fundamental evaluation tool in clinical medicine.Clin Chem1993, 39:561-577.
26. Al-Khurri LE, Al-Khafaji KR, Al-Salihi SA, Alwaysi SAA, Al-Akayshi RJ:Serum HCV-RNA levels in patients with chronic hepatitis C: Correlation with histological features.Arab J Gastroenterol2009,10:10-13.
27. De Moliner L, Pontisso P, De Salvo GL, Cavalletto L, Chemello L, . Alberti A: Serum and liver HCV RNA levels in patients with chronic hepatitis C: correlation with clinical and histological features.Gut1998,42:856-860. 28. Raymond E, Boige V, Faivre S, Sanderink GJ, Rixe O, Vernillet L, Jacques C,
Gatineau M, Ducreux M, Armand JP:Dosage adjustment and pharmacokinetic profile of Irinotecan in cancer patients with hepatic dysfunction.J Clin Oncol2002,20:4303-4312.
29. Ramos B, Nunez M, Toro C, Sheldon J, Garcia-Samaniego J, Rios P, Soriano V:Changes in distribution of hepatitis C virus (HCV) genotypes over time in Spain according to HIV serostatus: Implications for HCV therapy in HCV/HIV-coinfected patients.J Infect2007,54:173-179. 30. Green RM, Flamm S:AGA technical review on the evaluation of liver
chemistry tests.Gastroenterology2002,123(4):1367-1384.
31. Bircher J:Oxford textbook of clinical hepatology.New York; Oxford university press;, 2 1999, 503-521.
32. Lee GH, Benner D, Regidor DL, Kalatar-Zadeh K:Impact of kidney bone disease and its management on survival of patients on dialysis.J Ren Nutr2007,17(1):38-44.
33. Wiwanikit V:High serum alkaline phosphatase levels, a study in 181 Thai adult hospitalized patients.BMC Fam Pract2001,2:2.
34. Saif MW, Alexander D, Wicox CM:Serum Alkaline Phosphatase Level as Prognostic Tool in Colorectal Cancer: A study of 105 patients.J Appl Res
2005,5(1):88-95.
35. Abraham R, Ramakrishna B, Balekuduru A, Daniel HD, Abraham P, Eapen CE, Kurian G:Clinicopathological features and genotype distribution in patients with hepatitis C virus chronic liver disease.Ind J Gastroenterol
2009,28(2):53-58.
36. Zechini B, Pasquazzi C, Aceti A:Correlation of serum aminotransferases with HCV RNA levels and histological findings in patients with chronic hepatitis C: the role of serum aspartate transaminase in the evaluation of disease progression.Eur J Gasteroenterol Heptol2004,16(9):891-896. 37. Murakami S, Okubo K, Tsuji Y, Sakata H, Takahashi T, Kikuchi M, Hirayama R:
Changes in liver enzymes after surgery in anti-hepatitis C virus-positive patients.World J Surg2004,28:671-674.
38. Kato N, Yokosuka O, Hosoda K, Ito Y, Ohto M, Omata M:Quantification of hepatitis C virus by competitive reverse transcription polymerase chain reaction: increase of the virus in advanced liver disease.Hepatology1993, 18(1):16-20.
39. Gumber SC, Chopra S:Hepatitis C: a multifactorial disease. Review of extrahepatic manifestations.Ann Intern Med1995,123:615-620. 40. Wilson RA:Extrahepatic manifestations of chronic viral hepatitis.Am J
Gastroenterol1997,92(8):3-17.
41. Chiao EY, Engels EA, Kramer JR, Pietz K, Henderson L, Giordano TP, Landgren O:Risk of immune thrombocytopenic purpura and autoimmune hemolytic anemia among 120 908 US veterans with hepatitis C virus infection.Arch Intern Med2009,169(4):357-363. 42. Deshpande V, Burd E, Aardema KL, Ma CK, Moonka DK, Brown KA,
Abouljoud MS, Nakhleh RE:High levels of hepatitis C virus RNA in native
livers correlate with the development of cholestatic hepatitis in liver allografts and a poor outcome.Liver Transpl2001,7(2):118-124. 43. Ong JP, Barnes DS, Younossi ZM, Gronlich T, Yen-Lieberman B,
Goormastic M, Sheffieled C, Hoercher K, Starling R, Young J, Smedira N, McCarthy P:Outcome of de novo hepatitis C virus infection in heart transplant recipients.Hepatology1999,30(5):1293-1298.
doi:10.1186/1743-422X-8-293
Cite this article as:Ahmadet al.:HCV genotype-specific correlation with serum markers: Higher predictability for genotype 4a.Virology Journal 20118:293.
Submit your next manuscript to BioMed Central and take full advantage of:
• Convenient online submission
• Thorough peer review
• No space constraints or color figure charges
• Immediate publication on acceptance
• Inclusion in PubMed, CAS, Scopus and Google Scholar
• Research which is freely available for redistribution