Is the plastic flow uniformly distributed below the seismogenic region?
Yoshihisa Iio1and Yoji Kobayashi2
1Earthquake Research Institute, the University of Tokyo, Yayoi 1-1-1, Bunkyo-ku, Tokyo 113-0032, Japan 2Institute for Geoscience, University of Tsukuba, Tsukuba, Ibaragi 305-0006, Japan
(Received December 30, 2001; Revised July 29, 2002; Accepted August 23, 2002)
The cut-off depth of seismicity in and around the Nojima fault broken by the 1995 Kobe earthquake occurring in the intraplate Japan was compared with a brittle-ductile transition depth of the widely-accepted strength profile model of the crust. It was found that the cut-off depth is much deeper than the transition depth under the assumption that wet granite is deformed at a strain rate of 10−15/s. Such a small strain rate implies that the plastic flow is uniformly distributed below the seismogenic region. When the strain rate is assumed to be greater than 10−13, the cut-off depth can be attributed to the transition depth. This suggests that deformation is localized in a narrow fault zone below the seismogenic region even in the intraplate region.
1.
Introduction
At present, the strength of the crust is understood based on a simple model which utilizes the friction law of rocks (Byerlee, 1978) in the shallower part of the crust (the brittle region) and the plastic flow law in the deeper part (the ductile region) (e.g., Kobayashi, 1977; Goetze and Evans, 1979; Brace and Kohlstedt, 1980; Kirby, 1980; Sibson, 1982). Important parameters of the flow law are temperature and strain rate. The strain rate assumed in the flow law is usually 10−14/s to 10−15/s for the intraplate region in the continental crust (e.g., Goetze and Evans, 1979; Brace and Kohlstedt, 1980; Kohlstedtet al., 1995). Such a small value of the strain rate implies that rocks are uniformly deformed in the ductile regime in the intraplate region.
However, it has been inferred from the postseismic defor-mation of large intraplate earthquakes that afterslips may oc-cur on a downward extension of a seismogenic fault in the ductile region (e.g., Shen et al., 1994; Savage and Svarc, 1997). This inference suggests that deformation is localized even in the ductile region in an intraplate region. Although an alternative hypothesis asserts that the postseismic defor-mation is due to viscoelastic relaxation in the lower crust (e.g., Denget al., 1998), this hypothesis might not be real-istic because it requires the assumption of a viscosity much lower than that determined by another method (Kaufmann and Amelung, 2000).
The manner of deformation in the ductile region in the in-traplate region has not yet been accurately elucidated. Even in the interplate region, a problem similar to that described above has been presented (Bourneet al., 1998). These phe-nomena are problematic because it is difficult for measure-ments at the surface to distinguish between the two deforma-tion processes occurring in the deeper crust (Savage, 1990).
In this paper, we will infer the deformation process in an
Copy right cThe Society of Geomagnetism and Earth, Planetary and Space Sciences (SGEPSS); The Seismological Society of Japan; The Volcanological Society of Japan; The Geodetic Society of Japan; The Japanese Society for Planetary Sciences.
intraplate region from precise in-situ data obtained in the af-tershock area of the 1995 Kobe earthquake. We will compare the cut-off depth of seismicity with a brittle-ductile transi-tion depth estimated from an accurately estimated tempera-ture profile, assuming various strain rates.
2.
Cut-Off Depth of Seismicity
A vertical distribution of aftershock hypocenters of the 1995 Kobe earthquake is displayed in Fig. 1 (Nakamura and Ando, 1996). These hypocenters were calculated simultane-ously with station corrections and a one-dimensional veloc-ity structure by applying a joint hypocenter-velocveloc-ity inver-sion program (Dietz and Ellsworth, 1990) to the data from a dense temporal network of 56 stations (Ohmi, 1995; Hirata
et al., 1996). As is shown in Fig. 1, seismicity is confined to depths shallower than approximately 17 km except for a few events occurring beneath the main-shock hypocenter.
The standard error in focal depth was estimated as less than 0.3 km from rms P-arrival residuals of 0.06 s (Nakamura and Ando, 1996). However, focal depths could be shifted if the velocity structure was not accurately determined, given that a trade off exists between focal depth and velocity (Dietz and Ellsworth, 1990). The obtained velocity model was com-pared with that from a refraction seismic experiment (Piaoet al., 1997) (see Fig. 1(b)). Since the velocities from the joint inversion are a little bit smaller than those from the refrac-tion experiment, it is possible that the true cut-off depth is slightly deeper than the obtained one. Furthermore, station corrections are determined between−0.20 and 0.25 s in the joint inversion (Nakamura and Ando, 1996). Then, in the worst case, true P-arrival residuals for each station could be about 0.25 s. The P-arrival residuals correspond to an un-certainty in the cut-off depth of about 1.5 km. As a conse-quence, the cut-off depth is thought to fall between 15.5 and 18.5 km as hatched in Fig. 1(a). Although this is the cut-off depth of an aftershock distribution, we do not regard the cut-off depth as a temporal one, because microearthquakes
20
10
0
0
10
20
depth(km)
Magnitude
4
3
2
1
depth(km
)
Drilling site
Nojima fault
PACIFIC PLATE
PHILIPPINE PLATE SHIKO KU KYUSHU
HOKKAIDOU
HONSHU
130˚ 150˚
40˚
30˚
Drilling site
10
20
depth(km
)
5 5.5 6 6.5 7
0
5
10
15
20
25
N & A refraction
Vp (km/s)
? ?
a)
b)
Fig. 1. (a) Map showing the location of the borehole drilled near the Nojima fault of the 1995 Kobe earthquake (upper panel) and a vertical distribution of microearthquake hypocenters (Nakamura and Ando, 1996) (lower panel). The star indicates the hypocenter of the 1995 Kobe earthquake. By considering the errors in hypocentral locations, the cut-off depth of seismicity is thought to fall in the hatchmarked region at depths between 15.5 and 18.5 km. (b) Velocity models obtained from the joint inversion (Nakamura and Ando, 1996) and from a refraction seismic experiment conducted along the Kobe aftershock area (Piaoet al., 1997).
occurred near the lower boundary of seismicity even before the Kobe earthquake (Kyoto Univ., 1995).
3.
Temperature Pro
fi
le
A temperature logging was conducted in the borehole drilled in granitic rocks down to a depth of about 2000 m from the surface through the Nojima fault, about six months after the drilling had been finished (Ikedaet al., 2001). Tem-peratures from the surface to a depth of 1100 m were mea-sured without any disturbances by the drilling (Kitajimaet al., 2001). Thermal conductivities and heat productions were also measured from a collection of core samples (Kitajimaet al., 2001). Below 1100 m, temperatures were not measured because the borehole had been collapsed at a fracture zone of the Nojima fault. Given that the temperatures were mea-sured in massive granitic rocks outside of the fracture zone, it is not likely that the measured temperatures were seriously affected by water circulation near the surface.
We estimated the temperature profiles from the surface to a depth of 30 km. The heat production, A(z)is assumed to be distributed asA(z)= A(0)exp(−z/D)(Lachenbruch, 1970) wherez, is the depth (m),A(0)is the heat production at the surface, andDis the width of the layer on which the
radio isotopes are concentrated (m). The temperature,T(z), is calculated as
T(z)=T0+(Q0/K−A0D/K)z +(A0D2/K){1−exp(−z/D)},
where T0 is the absolute temperature at the surface, Q(0) is the heat flow at the surface, and K is the thermal con-ductivity. We obtained the following values: Q(0)of 56.6 (mW/m2),Kof 1.22 to 3.09 (W/mK), and A(0)of 1.1 to 2.0 (μW/m3) (Kitajimaet al., 2001). The value ofDwas not es-timated around the Nojima fault; it was assumed to be from 5 to 10 km in this study, following estimates of 7.8 km at the Hidaka, Japan region (Furukawa and Uyeda, 1986), and 10 km at the San Andreas (Lachenbruch, 1970). A(0)was set as 1.0, 1.5, or 2.0 according to the obtained values. K was set as 3.0, almost the upper limit of the obtained value, because values ofK showed a tendency to increase with bulk density (Kitajimaet al., 2001).
Fig. 2. (a) Temperature profiles calculated using the parameters obtained from the borehole drilled in granitic rocks near the Nojima fault (Kitajima
et al., 2001). Q(0)andK are set as 56.6 (mW/m2) and 3.0 (W/mK),
respectively. A(0)was assumed as 1.0, 1.5, or 2.0 (μW/m3);Das 5 or
10 km. Two extreme cases are displayed in comparison. The first: the heat production is constant independent of depth,Ao= 1.5 (μW/m3). The second: no heat production. (b) Shear strengths estimated from the Byerlee’s friction law and the flow law of wet granite (Hansen and Carter, 1982). The pore pressure is assumed to be hydrostatic. μis set as 0.6. εis set as 3×10⁻¹⁵(s−1). The shear strengths for the flow law are calculated for the various temperature profiles shown in Fig. 2(a), which were estimated for possible values ofA(0)andD.
the heat production is constant independently of depth. The second is no heat production. The temperature at the cut-off depth was determined to be about 600 K except in these two cases.
4.
Strength Pro
fi
le
The stress differenceσ1−σ3in the ductile regime is com-puted as
σ1−σ3 =(ε/Aexp(−H/RT))(1/n), (1) whereε is the strain rate (s−1), A is a constant, H is the activation energy, and R is the gas constant (Goetze and Evans, 1979),A,H, andnare set as 2.0×10⁻⁴(MPa−ns−1),
Shear stress (MPa)
Granite
0 50 100 150 200 250 300
0
5
10
15
20
25
30
3e-12 wet 3e-13 wet 3e-14 wet 3e-15 wet 3e-15 dry 0.6 hydrostatic 0.2 hydrostatic 0.6 suprahydrostatic
Depth (km)
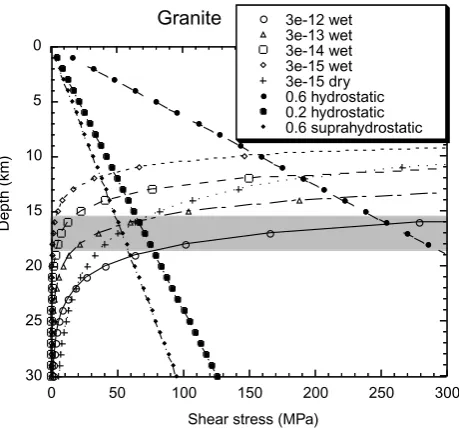
Fig. 3. Modified strength profiles. The pore pressure is assumed to be not only hydrostatic but also suprahydrostatic, 24 z (MPa).μis set not only as 0.6 but also as 0.2.εis changed from 3×10⁻¹⁵to 3×10⁻¹⁴, 3×10⁻¹³,
and 3×10⁻¹². In all cases,A(0)andDare fixed to be the most likely
values of 1.5 and 10, respectively. The flow law of dry granite is also displayed in comparison to the wet flow law.
137 (KJmol−1), and 1.9, respectively, following the values for wet granite (Hansen and Carter, 1982), and assuming that materials around the brittle-ductile transition are composed of granitic rocks (Shimada, 1993). The influence of usage of different flow laws on the result will be discussed later.
In the brittle region, the maximum compressional stress, σ1is calculated as
σ1= {((μ2+1)(1/2)+μ)/((μ2+1)(1/2)−μ)}σ3 − {2μ((μ2+1)(1/2)−μ)}p,
where σ3 is the minimum compressional stress, σ3 is the coefficient of friction, p is the pore pressure (Jaeger and Cook, 1979). The shear stressσ3is calculated as,
τ =((σ1−σ3)/2)sin(tan−1(1/μ)/2). (2) In and around the Kobe aftershock region, it was known that the maximum compressional stress was aligned horizontally along the E-W direction, and that the magnitude of σ3 is almost the same as the vertical stress (Iio, 1996). σ3 is calculated then as 2.75×10⁻²z (MPa).
Surface
Brittle
region
Ductile
region
fault
Seismic
activity
Aseismic fault
Localized shear
a) Previous studies
b) This study
Distributed ductile flow
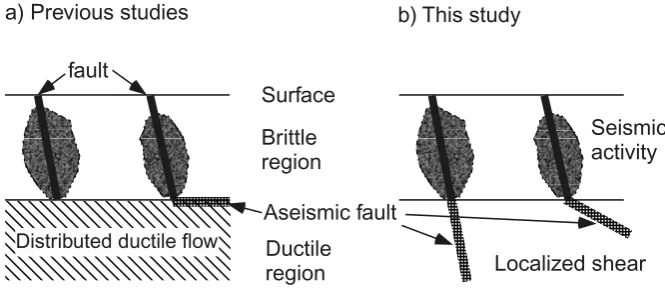
Fig. 4. A schematic drawing showing two possible deformation processes below the seismogenic region; these involve the uniformly distributed (left) and localized (right) plastic flows.
Table 1. Strain rate (/s) in a fault zone.
rank Average Fault width
slip rate 1 km 100 m 10 m 1 m
(mm/year)
A 3 10−13 10−12 10−11 10−10
B 0.3 10−14 10−13 10−12 10−11
C 0.03 10−15 10−14 10−13 10−12
Next, we examined the parameter values used in the above calculation. Pore pressure, coefficient of friction, and/or strain rate can be a control parameter for strength models. Figure 3 shows modified strength profiles using different values for the above parameters. Pore pressure is assumed to be not only hydrostatic but also suprahydrostatic, and 2.4×10⁻²z (MPa). μis set not only as 0.6 but also as 0.2, which values are estimated from numerous microearthquake focal mechanisms in the central Kinki district, Japan (Iio, 1997). Strain rateεis changed from 3×10⁻¹⁵to 3×10⁻¹⁴, 3×10⁻¹³, and 3×10⁻¹², respectively. In all cases, A(0) andD are fixed to be the most likely values of 1.5 and 10, respectively.
A series of combinations of parameters can explain the cut-off depth: (1) ε of 3 ×10⁻¹² and μ of 0.6, (2) ε of 3×10⁻¹³and suprahydrostatic, and (3)εof 3×10⁻¹³andμ of 0.2. These results clearly show that larger strain rates are necessary. When the Byerlee’s law is assumed,εshould be set as approximately 3−12.
Table 1 demonstrates strain rates computed from various fault widths and average slip rates, under the assumptions that faults below the seismogenic region slip at the same rate as those at the surface, and that fault width is constant in the ductile region. In Table 1, the faults are distinguished into three groups by their average geological slip rates (Research Group for Active Faults of Japan, 1980). It is necessary that the fault width be narrower than 100 m for all types of faults, for the purpose that the strain rate is set as greater than 3×10⁻¹². This suggests that below the seismogenic region, deformation is localized in a narrow zone even in an intraplate region, as schematically displayed in Fig. 4.
5.
Discussion
5.1 Flow law in the ductile layer
In the above, we estimated the strength in the ductile layer by the flow law of wet granite. P-wave velocities around the transition depth of 10 to 15 km are estimated as 6.0 or 6.2 km/s, as shown in Fig. 1(b). These values are consistent with laboratory measured velocities of granitic rocks (e.g., Holbrooket al., 1992). Consequently, rocks above a depth of 18 km are thought to be granitic. In some reports, a flow law of dry granite was used to explain the cut-off depth, because the dry flow law predicts a stronger strength than the wet flaw law (e.g., Shimada, 1993). However, it is not likely that the region around the brittle-ductile transition is dry, since it is believed that the lower crust has significant water contents, particularly in the upper part (e.g., Jones, 1992). In Japan, high conductivity anomalies in the lower crust were found except the fore-arc region and it is inferred that the lower crust has high water contents (Utadaet al., 1996).
5.2 Brittle-ductile transition
A criterion for the brittle-ductile transition different from the one used in this study, the Goetze’s criterion, is also dis-played in Fig. 3. That criterion is that the stress difference necessary for ductile flow is about equal to the confining pressure (Kohlstedtet al., 1995). The results are not seri-ously affected by the different criterion. The intersections of the line for the Goetze’s criterion and the flow law curves show almost the same depth as those of the lines of the By-erlee’s law.
observed cut-off depth of the seismicity.
Another hypothesis is that the cut-off depth is determined by the transition to the stable frictional sliding regime (Tse and Rice, 1986). It is estimated that the cut-off depth pre-dicted by this idea is shallower than the depth of the transi-tion to the plastic flow (Kohlstedtet al., 1995). Thus, in this case also, it is necessary to increase the plastic flow strength. 5.3 Applicability of experimental results
More fundamental questions have been raised about the application of experimental results to the estimate of the strength in the crust (Paterson, 1987; Chester, 1995). It is claimed that in the case of quartz-rich rocks, it is premature to attempt any extrapolation of the experimental results to geological conditions except as an upper bound of the plas-tic flow strength (Paterson, 1987). If the estimated plasplas-tic flow strength were only an upper bound, the discrepancy between the estimated brittle-ductile transition and cut-off depth would be more serious, and would be emphasized by a possible reduction of the plastic flow strength. In this case also, we have to introduce higher strain rates in order to over-come the discrepancy.
5.4 Deformation in the lower crust
When the deformation in the ductile region is localized in a narrow fault zone, the strain rate in the adjacent region is naturally lower than that of the fault zone. Then, if the flow law and its parameter values, excepting the strain rate, were the same in both regions, the adjacent region would be weaker than the fault zone. Thus, there should be differences in either the flow law or its parameters between the fault zone and the adjacent region. There are two possibilities to explain this sort of difference. The first is that water is localized in the fault zone (Kronenberg et al., 1990). The second is that grain sizes in the fault zone are smaller than those in the adjacent region (Bell and Etheridge, 1973).
6.
Concluding Remarks
We found that the cut-off depth of seismicity in and around the Nojima fault broken by the 1995 Kobe earthquake is not explained by the wet granite strength model in which a dis-tributed plastic flow is assumed below the seismogenic re-gion. We showed that the cut-off depth could be explained by the assumption that the deformation is localized in a nar-row zone of a downward extension of the seismogenic fault even in the intraplate region. This result was obtained only at one site, but it may be universal in the intraplate region given evidence that cut-off depths in other regions in the Japanese Island arcs also have a tendency to coincide with a depth of approximately 600K (Ito, 1990; Kitajimaet al., 2001). This new scope is important in considering the deformation pro-cess of intraplate regions, and in understanding the generat-ing process of intraplate earthquakes.
Acknowledgments. This study is partly supported by a grant from the Comprehensive Joint Research of the Special Coordination Funds for Promoting Science and Technology. The authors are grateful to Goetz H. R. Bokelmann and an anonymous reviewer for their thoughtful comments and suggestions.
References
Bell, T. H. and M. A. Etheridge, Microstructure of mylonite and their descriptive terminology,Lithos,6, 337–348, 1973.
Brace, W. F. and D. L. Kohlstedt, Limits on lithospheric stress imposed by laboratory experiments,J. Geophys. Res.,85, 6248–6252, 1980. Bourne, S. J., P. C. England, and B. Parsons, The motion of crustal blocks
driven by flow of the lower lithosphere and implications for slip rates of continental strike-slip faults,Nature,391, 655–659, 1998.
Byerlee, J. D., Friction of rocks,Pure and Appl. Geophys.,116, 615–626, 1978.
Chester, F. M., A rheologic model for wet crust applied to strike-slip faults,
J. Geophys. Res.,100, 13,033–13,044, 1995.
Deng, J., M. Gurnis, H. Kanamori, and E. Hauksson, Viscoelastic flow in the lower crust after the 1992 Landers, California earthquake,Science, 282, 1,689–1,692, 1998.
Dietz, L. D. and W. L. Ellsworth, The October 17, 1989, Loma Prieta, Cal-ifornia Earthquake and its aftershocks: Geometry of the sequence from high-resolution locations,Geophys. Res. Lett.,17, 1417–1420, 1990. Furukawa, Y. and S. Uyeda, Thermal state under Tohoku arc with
consider-ation of crustal heat generconsider-ation,Kazan (Bull. Volcano. Soc. Japan), 2,31, 15–28, 1986 (in Japanese with English abstract).
Goetze, C. and B. Evans, Stress and temperature in the bending lithosphere as constrained by experimental rock mechanics,Geophys. J. R. Astron. Soc.,59, 463–478, 1979.
Hansen, F. D. and N. L. Carter, Creep of selected crustal rocks at 1000 Mpa,
Trans. Amer. Geophys. Union,63, 437, 1982.
Hirata, N. and Japanese university group of the urgent joint observation for the 1995 Hyogo-ken Nanbu Earthquake,J. Phys. Earth,44, 317–328, 1996.
Holbrook, W. S., W. D. Mooney, and N. I. Christensen, The seismic velocity structure of the deep continental crust, inContinental Lower Crust, edited by D. M. Fountain, R. Arculus, and R. W. Kay, pp. 1–43, Elsevier, 1992. Iio, Y., Depth-dependent change in the focal mechanisms of shallow earth-quakes in a seismogenic region: Implications for the brittle-plastic tran-sition,J. Geophys. Res.,101, 11,209–11,216, 1996.
Iio, Y., Frictional coefficient on faults in a seismogenic region inferred from earthquake mechanism solutions, J. Geophys. Res., 102, 5403–5412, 1997.
Ikeda, R., Y. Iio, and K. Omura, In-situ stress measurements in NIED borehole in and around the fault zone near the 1995 Hyogo-ken Nanbu earthquake, Japan, Island,Island Arc,10, 252–260, 2001.
Ito, K., Regional variations of the cutoff depth of seismicity in the crust and their relation to heat flow and large inland-earthquakes,J. Phys. Earth, 38, 223–250, 1990.
Jaeger, J. C. and N. W. G. Cook, Fundamentals of rock mechanics, Chapman and Hall, New York, 1979.
Jones, A. G., Electrical conductivity of the continental lower crust, in Con-tinental Lower Crust, edited by D. M. Fountain, R. Arculus, and R. W. Kay, pp. 81–143, Elsevier, 1992.
Kaufmann, G. and F. Amelung, Reservior-induced deformation and conti-nental rheology in vicinity of Lake Mead, Nevada,J. Geophys. Res.,105, 16,341–16,358, 2000.
Kirby, S. H., Tectonic stress in the lithosphere: Constraints provided by the experimental deformation of rock,J. Geophys. Res.,85, 6353–6363, 1980.
Kitajima, T., Y. Kobayashi, R. Ikeda, Y. Iio, and K. Omura, Terrestrial heat flow in Hirabayashi, Awaji, Island,Isrand Arc,10, 318–325, 2001. Kobayashi, Y., A relationship between the distribution of focal depth of
micro-earthquakes and surface heat flow in the southern Japan and central Japan, Proc. Symp. Earthquake Pred. Res. (1976), National Committee of Geophysics and Seismological Society of Japan, 184–193, 1977 (in Japanese with English abstract).
Kohlstedt, D. L., B. Evans, and S. J. Mackwell, Strength of the lithosphere: Constraints imposed by laboratory experiments,J. Geophys. Res.,100, 17,587–17,602, 1995.
Kronenberg, A. K., P. Segall, and G. H. Wolf, Hydrolytic weakening and penetrative deformation within a natural shear zone, inThe brittle-ductile transition in rocks (The heard volume), edited by A. G. Duba, W. B. Durham, J. W. Handin, and H. F. Wang, Geophys. Monogr., 56, pp. 21– 36, AGU, Washington, D.C., 1990.
Kyoto Univ., Abnormal initial rise of the foreshock of the 1995 Southern Hyogo Prefecture earthquake, Report of the coordinate committee for earthquake prediction, 54, 620–623, 1995.
Lachenbruch, A. H., Crustal temparature and heat production: Implications of the linear heat flow relation,J. Geophys. Res.,75, 3291–3300, 1970. Miyazaki, S., T. Tada, and T. Sagiya, Present crustal deformation in
Nakamura, M. and M. Ando, Aftershock distribution of the January 17, 1995 Hyogo-ken Nanbu Earthquake determined by the JHD method,J. Phys. Earth,44, 329–335, 1996.
Ohmi, S., Data processing of the urgent joint observation of aftershocks of the 1995 Hyogo-ken Nanbu Earthquake, Program and abstract of the 1995 Seismol. Soc. Jpn. Fall meeting, A39, 1995 (in Japanese). Ohnaka, M, Earthquake source nucleation: a physical model for short term
precursors,Tectonophys.,211, 149–178, 1992.
Paterson, M. S., Problem in the extrapolation of laboratory rheological data,
Tectonophys.,133, 33–43, 1987.
Piao, C., T. Iwasaki, T. Yoshii, S. Sakai, T. Takeda, T. Moriya, T. Oomura, F. Yamazaki, K. Ito, Y. Shimada, A. Yamazaki, K. Tashiro, K. Miyashita, and H. Miyamachi, Crustal structure in and around the source region of the 1995 Southern Hyogo Prefectural Earthquake deduced from seismic refraction experiment 2, Program and abstract of the 1997 Joint Geophys-ical meeting, E11-P14, 1997 (in Japanese).
Research Group for Active Faults of Japan, Active faults in Japan, sheet maps and inventories, Univ. of Tokyo, Tokyo, 1980.
Sagiya, T., T. Tada, and S. Miyazaki, Deformation in Japanese Island by GPS measurements,Earth Monthly,21, 236–243, 1999 (in Japanese). Savage, J., Equivalent strike-slip earthquake cycles in half space and
lithosphere-athenosphere earth models,J. Geophys. Res.,95, 4873–4879, 1990.
Savage, J. C. and J. L. Svarc, Postseismic deformation associated with the
1992 Landers earthquake, southern California, J. Geophys. Res., 102, 7,565–6,577, 1997.
Shen, Z. K., D. D. Jackson, Y. Feng, M. Cline, P. Fang, and Y. Bock, Post-seismic deformation following the Landers earthquake, California, 28 June 1992,Bull. Seismol. Soc. Am.,84, 780–791, 1994.
Shimada, M., Lithosphere strength inferred from fracture strength of rocks at high confining pressures and temperatures,Tectnophys.,217, 55–64, 1993.
Sibson, R. H., Fault zone models, heat flow and the depth distribution of earthquakes in the continental crust of the United States,Bull. Seismol. Soc. Am.,72, 151–163, 1982.
Strehlau, J., A discussion of the depth extent of rupture in large continental earthquakes, inEarthquake Source Mechanics, Geophys. Monogr., 37, edited by S. Das, J. Boatwright, and C. H. Scholz, pp. 131–145, AGU, Washington, D.C., 1986.
Tse, S. T. and J. R. Rice, Crustal earthquake instability in relation to the depth variation of frictional properties, J. Geophys. Res., 91, 9,452– 9,472, 1986.
Utada, H., Y. Hamano, and J. Segawa, Conductivity anomaly around the Japanese islands, Geology and Geophysics of the Japan Sea, Japan-USSR Monograph Series, 1, pp. 103–149, 1996.