P R O C E E D I N G S
Open Access
Regularized regression method for genome-wide
association studies
Jin Liu
1*, Kai Wang
2, Shuangge Ma
3, Jian Huang
1,2From
Genetic Analysis Workshop 17
Boston, MA, USA. 13-16 October 2010
Abstract
We use a novel penalized approach for genome-wide association study that accounts for the linkage
disequilibrium between adjacent markers. This method uses a penalty on the difference of the genetic effect at adjacent single-nucleotide polymorphisms and combines it with the minimax concave penalty, which has been shown to be superior to the least absolute shrinkage and selection operator (LASSO) in terms of estimator bias and selection consistency. Our method is implemented using a coordinate descent algorithm. The value of the tuning parameters is determined by extended Bayesian information criteria. The leave-one-out method is used to computep-values of selected single-nucleotide polymorphisms. Its applicability to a simulated data from Genetic Analysis Workshop 17 replication one is illustrated. Our method selects three SNPs (C13S522, C13S523, and C13S524), whereas the LASSO method selects two SNPs (C13S522 and C13S523).
Background
Genome-wide association studies (GWAS) are a modern approach to genetic studies. Although GWAS success-fully dissect genetic factors that underlie complex traits, they raise many challenging statistical issues. A promi-nent issue is how to identify single-nucleotide poly-morphisms (SNPs) that are in linkage disequilibrium (LD) with a genetic variant of weak effect. To identify such SNPs, investigators use the modern approach of regularized regression, for instance, the least absolute shrinkage and selection operator (LASSO) [1]. However, existing regularized regression methods do not take into account LD information among adjacent SNPs. The fused LASSO [2] may be suitable for this purpose. How-ever, the ambiguity in the choice of the reference allele for scoring genotypes makes it not applicable. Presum-ably, incorporating LD information into the analysis would be highly beneficial in delineating association sig-nals by achieving smoothness and reducing randomness in single-SNP analysis. To make use of LD information, we have developed an L2 penalty that encourages a
smaller difference in genetic effect at adjacent SNPs that are in stronger LD. This penalty is used in combination with the minimax concave penalty (MCP) [3], which is efficient in shrinking many nuisance predictors to exactly zero. In what follows, we describe the new method and then present its application to the Genetic Analysis Workshop 17 (GAW17) simulated data set of unrelated individuals.
Methods
Letpbe the number of SNPs andnjthe number of sub-jects whose genotypes are nonmissing at thejth SNP. The centered phenotype of theith subject with nonmissing genotype at SNPjis denotedyij. The genotype at a SNP is scored as 0, 1, or 2 depending on the number of copies of the reference allele in the subject. Letxijdenote the stan-dardized genotype scores satisfyingΣixij= 0. Then:
xij n
i
j
2
∑
= . (1)Let bj be the genetic effect corresponding to SNPj. The model solves:
Department of Statistics and Actuarial Science, University of Iowa, 241 Schaeffer Hall, Iowa City, IA 52242, USA
Full list of author information is available at the end of the article
There are two parts of penalty here, denotedr1 and threshold (g= 1) as special cases.l1is a tuning parameter. The second part of the penalty is the quadratic absolute difference in genetic effect between two successive SNPs:
r2
(
bj,bj+1)
=(
bj − bj+1)
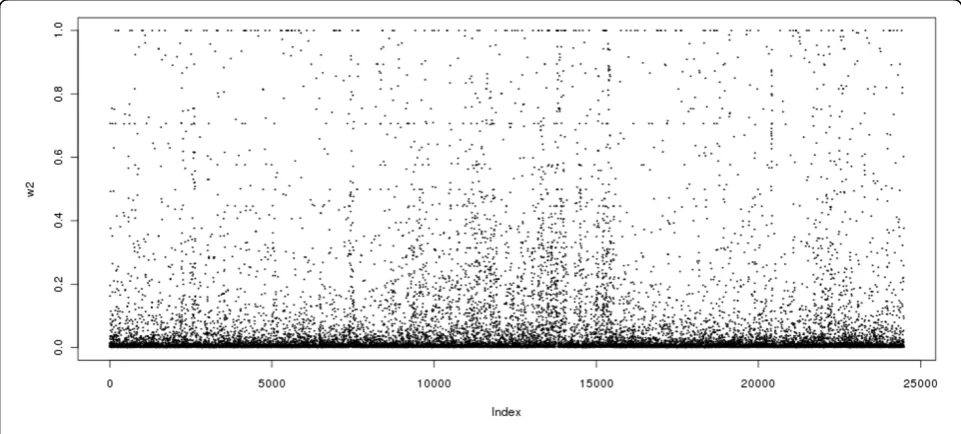
2. (4) We choose ςj in expression (2) to be the absolute value of the Pearson correlation between the genotype scores of SNP j and SNP (j + 1). The second penalty was motivated by the fact that the adjacent SNPs are usually highly correlated.Figure 1 shows the absolute lag-one autocorrelation coefficients over the whole genome. Figure 2 shows the proportion of the absolute lag-one autocorrelation coef-ficients greater than 0.5 for 100 SNPs per segment over the genome. One can see that even for partially selected SNPs over the genome, strong correlations exist between adjacent SNPs. Although it may be more infor-mative to use pairwise correlations among SNPs, the computational burden makes this implementation impossible in a real data set. Those facts motivated us to include the adjacent LD information in the second penalty in the model. The method is referred to as the smoothed minimax concave penalization (SMCP) [4].
The loss function in expression (2) is a sum of the marginal loss function at each SNP. We use a marginal loss function instead of a joint loss function because it is easier to deal with missing genotypes that way. Huang et al. [5] discussed the asymptotic properties of a mar-ginal loss function with a bridge penalty under certain regularity conditions.
We implement an iterative coordinate descent algo-rithm to estimate model parameters. This algoalgo-rithm has been used on many other occasions, including estima-tion in nonconvex penalized regression [6]. Because the first derivative of the objective function has explicit solutions, this algorithm is computational efficient. For the tuning parameters l1 and l2, we reparameterize them through:
t =l1+l2, (5)
h l
t
= 1. (6)
The value of tuning parametergin the MCP is chosen to be 3 [6]. h is fixed at 0.1, and τ is determined by using the extended Bayesian information criterion (EBIC) [7]. We use the leave-one-out (LOO) method [8] to evaluate the significance of the selected SNPs.
Results
The GAW17 data set consists of 24,487 SNP markers throughout the genome for 697 individuals. We analyze the unrelated individuals data with quantitative trait Q1 in replicate 1. All SNPs are included in the analysis. We coded the seven population groups as dummy variables. We first regress the quantitative trait Q1 on sex, age,
smoking status, and group dummy variables in order to remove their confounding effects. This procedure helps to adjust for population stratification. Then, we use the residuals from this regression as the response and fit them using the SMCP model and the LASSO model. The selected tuning parameterτ is 1.655 for the SMCP model withh= 0.1 and 0.184 for the LASSO model.
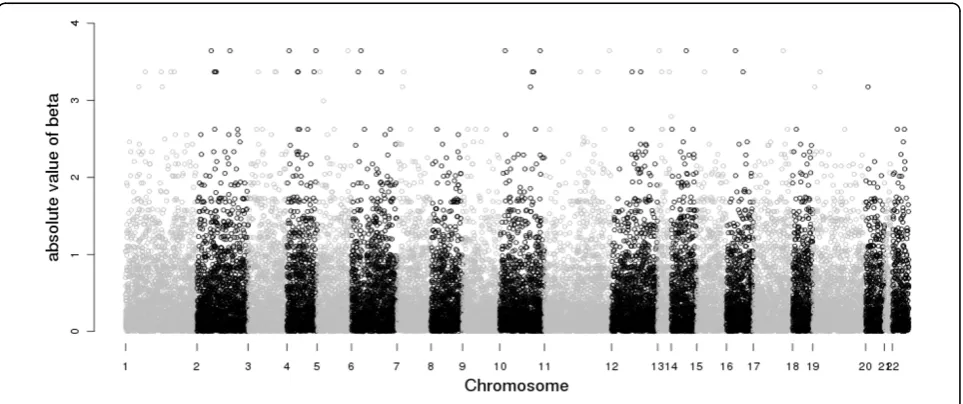
Absolute values of the estimates from the simple lin-ear regression are plotted in Figure 3. The estimation results are presented in Table 1. Both the SMCP model and the LASSO model selected two SNPs
(C13S522 and C13S523) from gene FLT1. For each
method, these two SNPs have significant LOO p
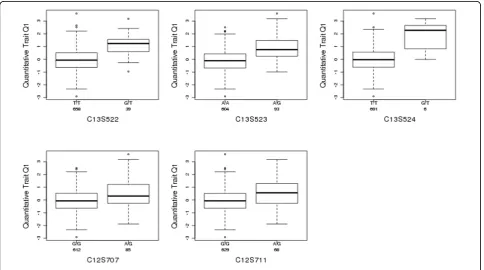
-values. The SMCP model selected three more SNPs,
one (C13S524) from gene FLT1 and the other two
(C12S707 and C12S711) from gene PRR4. Only one
SNP (C13S524) from gene FLT1 is significant. The
boxplots for these five SNPs selected by the SMCP and LASSO models are shown in Figure 4.
With knowledge of the underlying model, we com-puted the true-positive rate and the false-positive rate for the SMCP model , the LASSO model, and regular single-SNP regression on trait Q1 using all 200 repli-cates (Table 2). For regular single-SNP regression, the Benjamini-Hochberg method is used to control the false discovery rate and to conduct multiple testing. The
Figure 2Proportion of absolute lag-one autocorrelation coefficients greater than 0.5 for 100 SNPs per segment over the genome
SMCP model tends to select more SNPs than the LASSO model with a higher true-positive rate and a higher false-positive rate. Although regular methods can select a higher true positive, its false positive is much higher than those in the SMCP and LASSO models. Further simulation studies can be found in [4].
Discussion
The penalized approach is a modern variable selection method developed to handle large p, small nproblems. Application of this approach to GWAS is highly antici-pated. Compared to traditional GWAS, in which SNPs are analyzed one by one, a penalized method is able to handle a collection of SNPs simultaneously. We have used a method that takes into account the LD infor-mation among adjacent SNPs in order to reduce the randomness seen in the traditional one-SNP-at-a-time analysis. For trait Q1 in replicate 1, the SMCP model selected three SNPs (C13S522, C13S523, and C13S524) from the associated gene FLT1 and two SNPs that are
false positives. In comparison, the LASSO model selected two SNPs (C13S522 and C13S523), both of which are true positives. We note that the SNPs pro-vided for GAW17 are a small subset of the SNPs that are genotyped. The strength of LD for this set of SNPs has been greatly reduced. In addition, the GAW17 data were simulated to mimic rare variants. The SMCP method is specially designed to map rare variants. Even so, the SMCP model is able to select three SNPs, more than the LASSO model can. In comparison, the results of the regular simple linear regression are much noisier.
Conclusions
The SMCP model is a novel penalized regression method. By taking into account the LD information between adjacent SNPs, the SMCP model is a useful tool that is better at delineating an association signal while reducing random noise. The algorithm used for the SMCP model is available in R package SMCP.
Table 1 SNPs selected by the SMCP and LASSO models for trait Q1 in replicate 1
SNP Position Gene Univariate estimate Univariatep-value SMCP estimate LOOp-value LASSO estimate LOOp-value
C12S707 11065657 PRR4 0.53 2.0 × 10⁻⁷ 0.002 7.9 × 10⁻¹
C12S711 11065733 PRR4 0.61 7.6 × 10⁻⁸ 0.007 3.0 × 10⁻¹
C13S522 27899910 FLT1 1.22 2.1 × 10⁻¹⁷ 0.169 5.7 × 10⁻⁷ 0.096 1.6 × 10⁻⁸
C13S523 27899912 FLT1 0.94 2.6 × 10⁻²² 0.173 6.2 × 10⁻¹⁰ 0.134 1.6 × 10⁻¹³
C13S524 27899915 FLT1 1.88 2.2 × 10⁻⁷ 0.058 1.1 × 10⁻²
Acknowledgments
We thank the two anonymous reviewers for their comments and
suggestions. The work of JL and JH is partly supported by National Institutes of Health (NIH) grant R01 CA120988 and National Science Foundation grant DMS 0805670. The work of SM is partly supported by NIH grants R01 CA120988, R03 LM009754, and R03 LM009828.
This article has been published as part ofBMC ProceedingsVolume 5 Supplement 9, 2011: Genetic Analysis Workshop 17. The full contents of the supplement are available online at http://www.biomedcentral.com/1753-6561/5?issue=S9.
Author details
1Department of Statistics and Actuarial Science, University of Iowa, 241
Schaeffer Hall, Iowa City, IA 52242, USA.2Department of Biostatistics, University of Iowa, C22 General Hospital, Iowa City, IA 52242, USA.3Division
of Biostatistics, School of Public Health, Yale University, 60 College Street, New Haven, CT 06520, USA.
Authors’contributions
JL, JH and SM conceived of study. JL participated in the design and carried out the analysis and helped to draft the manuscript. KW helped to draft the manuscript. All authors read and approved the final manuscript.
Competing interests
The authors declare that there are no competing interests.
Published: 29 November 2011
References
1. Tibshirani R:Regression shrinkage and selection via the LASSO.J R Stat Soc B1996,58:267-288.
2. Tibshirani R, Saunders M, Zhu J, Knight K:Sparsity and smoothness via the fused LASSO.J R Stat Soc B2005,67:91-108.
3. Zhang CH:Nearly unbiased variable selection under minimax concave penalty.Ann Stat2010,38:894-942.
4. Liu J, Wang K, Ma S, Huang J:Accounting for linkage disequilibrium in genome-wide association studies: a smoothed minimax concave penalty approach.Technical Report 410, Department of Statistics and Actuarial Science, University of Iowa; 2011.
5. Huang J, Horowitz J, Ma S:Asymptotic properties of bridge estimators in sparse high-dimensional regression models.Ann Stat2008,36:587-613. 6. Breheny P, Huang J:Coordinate descent algorithms for nonconvex
penalized regression methods.Ann Appl Stat2011,5:232-253. 7. Chen J, Chen Z:Extended Bayesian information criteria for model
selection with large model spaces.Biometrika2008,95:759-771. 8. Wu TT, Chen YF, Hastie T, Sobel E, Lange K:Genome-wide association
analysis by LASSO penalized logistic regression.Bioinformatics2009,
25:714-721.
doi:10.1186/1753-6561-5-S9-S67
Cite this article as:Liuet al.:Regularized regression method for genome-wide association studies.BMC Proceedings20115(Suppl 9):S67.
Submit your next manuscript to BioMed Central and take full advantage of:
• Convenient online submission
• Thorough peer review
• No space constraints or color figure charges
• Immediate publication on acceptance
• Inclusion in PubMed, CAS, Scopus and Google Scholar
• Research which is freely available for redistribution
Submit your manuscript at www.biomedcentral.com/submit
Table 2 Mean and standard error (in parentheses) of true positives and false positives for selected SNPs over 200 replicates for trait Q1
SMCP model LASSO model Regular regression
True positive 3.35 (1.52) 2.48 (1.19) 7.03 (1.81)