R E S E A R C H
Open Access
Link performance model for filter bank based
multicarrier systems
Dmitry Petrov
1*†, Alexandra Oborina
2†, Lorenza Giupponi
2and Tobias Hidalgo Stitz
1Abstract
This paper presents a complete link level abstraction model for link quality estimation on the system level of filter bank multicarrier (FBMC)-based networks. The application of mean mutual information per coded bit (MMIB) approach is validated for the FBMC systems. The considered quality measure of the resource element for the FBMC transmission is the received signal-to-noise-plus-distortion ratio (SNDR). Simulation results of the proposed link abstraction model show that the proposed approach is capable of estimating the block error rate (BLER) accurately, even when the signal is propagated through the channels with deep and frequent fades, as it is the case for the 3GPP Hilly Terrain (3GPP-HT) and Enhanced Typical Urban (ETU) models. The FBMC-related results of link level simulations are compared with cyclic prefix orthogonal frequency division multiplexing (CP-OFDM) analogs. Simulation results are also validated through the comparison to reference publicly available results. Finally, the steps of link level abstraction algorithm for FBMC are formulated and its application for system level simulation of a professional mobile radio (PMR) network is discussed.
Keywords: FBMC; SNDR; Effective SNDR mapping; Link performance; PMR
Introduction
Orthogonal frequency division multiplexing (OFDM) is the dominant high data rate telecommunications physi-cal layer (PHY) technology used by, among others, IEEE 802.11a/g (WiFi) [1], IEEE 802.16 (WiMAX) [2,3], and 3GPP Long Term Evolution (LTE) [4]. Widespread adop-tion of OFDM is motivated by factors like efficient signal processing based on the fast Fourier transform (FFT), robustness in frequency selective channels, simple equal-ization, etc. However, OFDM might not be an optimal solution in future wireless networks due to its inherent limitations.
One of the objectives of future wireless communication systems is to utilize fragmented spectrum efficiently. Cur-rently, professional mobile radio (PMR) networks occupy a number of narrow frequency bands (mainly allocated in the 410 to 430 MHz band in the European Union) allo-cated to public service and safety professionals according to the TETRA [5] and Tetrapol [6] standards. However, it would be greatly beneficial to deploy broadband data communication services within the spectrum currently
*Correspondence: [email protected] †Equal contributors
1Magister Solutions Ltd., Sepänkatu 14 C, 40720 Jyväskylä, Finland Full list of author information is available at the end of the article
devoted to the PMR network [7], making use of the advan-tages of cognitive radio. In order to utilize the spectrum efficiently, the multicarrier (MC) transmission scheme should be capable of identifying and exploiting unused frequency gaps, coexisting with other users or services occupying the spectrum around these gaps. Transmis-sion of signals using such MC modulation scheme should produce only negligible interference to already operating wireless communication systems. OFDM has a poor spec-tral localization in frequency (13-dB attenuation at the first side lobe) due to the rectangular impulse used for modulation. It results in a potentially high intercarrier interference (ICI) in non-synchronized transmission and strong out-of-band emission. Hence, OFDM is not capable of fulfilling the strict interference requirements for coex-istence with the PMR network, unless a lot of sub-carriers are used as a guard band, which significantly reduces the OFDM spectral efficiency advantage. There are several proposals to address OFDM’s poor spectral containment, including weighted FFT, guard frequencies, application of additional windowing, etc. [8-10], trading off signal processing complexity, and loss in spectral efficiency.
A promising MC modulation alternative is the filter bank based multicarrier (FBMC) technique, which usu-ally modulates a prototype filter with tight frequency
localization to obtain frequency localized sub-carriers. One of the first FBMC realizations was the OFDM off-set quadrature amplitude modulation (OFDM/OQAM) scheme, with isotropic orthogonal transform algorithm (IOTA), where orthogonal pulse shapes were constructed from Gaussian functions [11]. By weakening the require-ment of strict orthogonality of the signal basis, even better localization properties can be achieved with the so-called nearly-perfectly orthogonal filter banks (FBs). Figure 1 shows the better spectral containment of the FBMC sig-nal, by comparing power spectral densities (PSD) of a FBMC with a regular OFDM signal. Here, a pulse shap-ing function, developed by the PHYDYAS project [12], for the construction of FBMC symbols is used. Recently, advanced FBMC techniques have received renewed inter-est due to their potential suitability for 5th generation (5G) systems. The fast convolution filter bank (FC-FB) technique described in [13] extends the system flexibility of FBMC in the case of non-continuous spectrum. Non-orthogonal or generalized frequency division multiplexing (NOFDM or GFDM) schemes presented in [14,15] and non-uniform FBs proposed in [16] exhibit potential gains over OFDM. In this paper, we focus on the orthogonal uni-form FB (OFDM/OQAM), for which efficient polyphase realizations are available [17].
Additionally to the benefits provided by FMBC, we should also mention the drawbacks of FBMC compared to OFDM. The absence of the cyclic prefix (CP) in the FBMC increases spectral efficiency but also reduces robustness to channel fades in multipath propagation sce-narios, where symbol distortion, caused by ‘only real’
0 100 200 300 400 500
−180 −160 −140 −120 −100 −80 −60 −40 −20 0 20
Subcarrier number
PSD, dB
Figure 1Power spectral densities of OFDM and OQAM signals. Power spectral densities (PSDs) of OFDM (solid line) and
OFDM/OQAM (dashed line) signals: 512 sub-carriers, 300 active (= 25 LTE resource blocks), AWGN channel.
orthogonality of the FB basis functions, appears. This problem can be solved by utilization of advanced but more complicated channel estimation and equalization for FBMC on sub-carrier level. The PHYDYAS project demonstrated FBMC performance improvements over OFDM in a WiMAX-like communication system, mainly on the link level [18,19]. In order to assess the advantages of FBMC technology on the fragmented spectrum even further, it is necessary to evaluate its performance in PMR scenarios and compare it to an OFDM reference system on both, the link and the system levels.
level abstractions for FBMC, have been presented in the earlier works of the authors [21,22]. The main objective of this paper is to justify the applicability of the MMIB technique as link level abstraction for FBMC transmission in the PMR network. This paper presents the complete model of link-to-system mapping and final performance results for the FBMC transmission, including necessary calibration parameters that can be used for the whole set of channel quality indicators (CQIs) in different chan-nel conditions. The particularity of the FBMC system is addressed by taking into account the distortion at the receiver [23] for resource quality measure estimation.
The rest of the paper is organized as follows: next section introduces the main link level abstraction meth-ods with focus on the effective signal-to-noise and inter-ference mapping (ESM) model. In addition, the detailed mathematical derivations for the MMIB approach are pro-vided. In the third section, we introduce the FBMC signal, describe its intrinsic interference, and provide its values for different fading channels. In the fourth section, the link level simulator is described and validated, and the received BLER simulation results for FBMC are analyzed. Section 5 summarizes the MMIB link level abstraction algorithm steps for FBMC-based systems. Conclusions are finally drawn in the 6th section.
Principles of link level abstraction
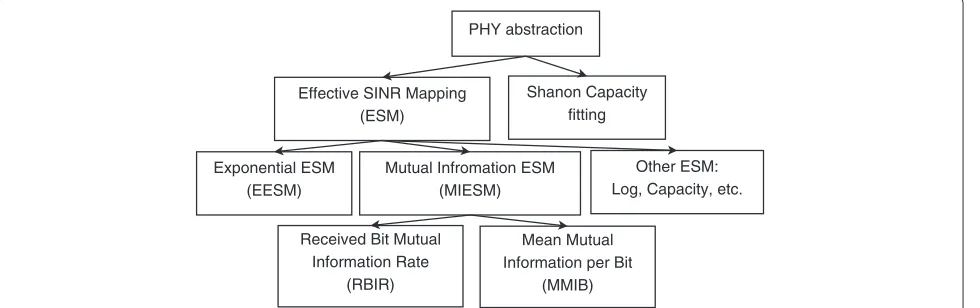
The main purpose of a link level abstraction model is to determine the value of a performance metric, such as the BLER, based on the instantaneous fading pro-file and selected transmission parameters. MC systems used in multi-state channels can not be treated by link level abstraction models in a similar manner as single-carrier systems with slow-varying channels. In OFDM-based systems, non-linear SNR averaging is introduced in the so-called ESM model and the Shannon capacity fitting approach, as illustrated in Figure 2.
ESM-based models
Several ESM approaches have been proposed for OFDM transmission. In this paper, the most accurate approach, mutual information ESM (MIESM), is adapted to FBMC-based systems. The general ESM approach allows to predict the link performance accurately and in a simple manner, under different channel and interference condi-tions and for different modulation and coding schemes (MCSs) [24]. Let a channel state be characterized by K
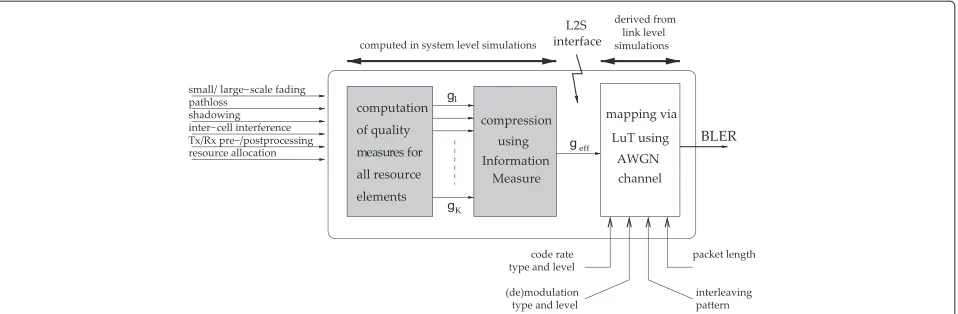
quality measures of time/frequency/space resource ele-ments, denoted byγ1,γ2,. . .,γk,. . .,γK. The general idea of all ESM-based methods is to map these instantaneous quality measures into an effective quality measure, γeff. It is then mapped to a performance metric (e.g., BLER), in a single-state channel, through additive white Gaussian noise (AWGN) performance curves via link level simu-lations. Alternatively, polynomial fitting reference perfor-mance curves can be utilized [24]. The ESM mapping model is presented in Figure 3.
In order to determine an instantaneous BLER based on the instantaneous fading profile, the ESM model matches the actual block error probability (BLEP) for the instanta-neous channel state, to the AWGN BLEP, corresponding to the effective quality measure equivalent.
BLEPAWGN(γeff)≈BLEP({γ1,γ2,. . .,γK}). (1)
The effective mapping for the general ESM approach is defined as follows [24]:
γeff=α1I−1
1
K K
k=1 I
γk
α2
, (2)
where I is the specified information measure function [25] andI−1its inverse.{γ
1,γ2,. . .,γK}are the resource quality measures, e.g., received post-processed SNR val-ues, within a coded transport block for MC transmission. If scalarsα1andα2are used, they are adjusted through the
PHY abstraction
Effective SINR Mapping (ESM)
Exponential ESM (EESM)
Received Bit Mutual Information Rate
(RBIR)
Mutual Infromation ESM (MIESM)
Mean Mutual Information per Bit
(MMIB)
Other ESM: Log, Capacity, etc. Shanon Capacity
fitting
Figure 3Link-to-system interface model for the system level performance evaluation.
ESM principle (Equation 1) for a given modulation and coding scheme. This can be done by utilizing a least square fitting between the estimated BLERs and the simulated BLERs on the link level.
The optimum least square fit in the logarithmic BLER domain defines the final adjustment coefficients pair
(α1,opt,α2,opt), for each modulation and coding scheme as follows:
(α1,opt,α2,opt)=arg minα N
n=1
|log10BLERest,n(α1,α2)
−log10BLERsim,n
|2,
where BLERest and BLERsim are estimated BLERs and simulated BLERs for the set of effective data sam-ples (Equation 2) mapped from the set of used quality measures, {γ1,γ2,. . .,γK}, within a coded block of the transmission. Minimization is done overN independent channel realizations.
The mutual information ESM (MI-ESM) model differs from the general ESM approach in the use of a precise informational measure function and the absence of fit-ting coefficients. The information measure function I for the MI-ESM model is the MI function. The MI-ESM approach mapsKquality measures to the averaged mutual information (AMI) quality measure.
AMI= 1
K K
k=1
I(γk). (3)
Then, the AMI is mapped to the BLER value under the assumption of AWGN propagation.
MI can be understood as a measure of the information shared by two random variables x and y. Their mutual dependence can be defined as
MI(x,y)=Ex,y log2
p(y|x) p(y)
,
where Ex,y(·) is the expectation over{x,y}, p(y|x) is the conditional probability density function (PDF) ofygiven
x, andp(y)is the marginal PDF ofy. The information gain increases with differentiation between p(y|x) and p(y). Depending on the choice of the variablesxandy, different MI-ESM methods can be built. Ifxis the transmitted com-plex quadrature amplitude modulation (QAM) symbol from a certain constellation andyis its realization at the receiver, distorted by a channel, the received mutual infor-mation rate (RMIR) ESM method can be established. This approach is invariable to different bit-to-symbol map-pings, as only symbol-to-symbol channels are considered. An alternative way is to define MI on the bit channels. This approach brings us to the mean mutual information per coded bit (MMIB) ESM. In literature, it is hard to find complete derivation of the MMIB algorithm presented in a single publication on link-to-system abstraction and since the MMIB is the main model used in this paper, we present its detailed derivation in the following subsection.
Mean mutual information per coded bit ESM model
In MMIB, the discrete random variablexis the transmit-ted bit. We consider different bit channelsx = xi, where indexistands for the bit position in the modulation sym-bol andxican take only two values: 0 or 1. Consequently,
MI(xi,y)=
xi=0,xi=1
p(xi)Ey|xi log2
p(y|xi) p(y)
,
whereyis the received QAM symbol.
Using the Bayes’ theorem, it can be shown that
p(y|xi) p(y) =
1
p(xi)
1+e−LLRxi(y)
where, by definition, the log-likelihood ratio (LLR) of a
Further on, it is necessary to calculate the mean value of the MI for all bits constituting the received symboly
MMIB(y)= 1
whereμis the number of bits per QAM symbol.
It is possible to continue further analytic derivations for the easiest case of binary phase shift key (BPSK) modu-lation withμ = 1. Therefore, we can drop the indexi
(xi = x) and considerxas the transmitted symbol that
Taking these results into account, the MI can be com-puted as:
Assuming that we transmit symbol x through the AWGN channel, a Gaussian random variable is received
y=x+n,
whereE[|n|2]=σn2= N0
2Es,
N0
2 is a noise variance per real dimension andEsis the energy per symbol. Consequently, the conditional PDF ofyis given by:
p(y|x)= √ 1
Then, from Equation 5, it follows that
LLRx=−1(y)= − 2
σ2 n y,
which is a linear function ofy, is normally distributed with varianceσ2= 4 Using similar derivations, we can get that:
LLRx=1(y)= 2
σ2 n y.
Finally, the expression for the MI can be simplified as follows:
The integral in the expression above can be calculated approximately as [26]:
In case of QPSK or 4 QAM modulations, conditional LLR distributions for bitsx1andx2will also be Gaussian, but with means±σ12
MMIB (Equation 4) can be calculated as
I4 QAM(γ)=J
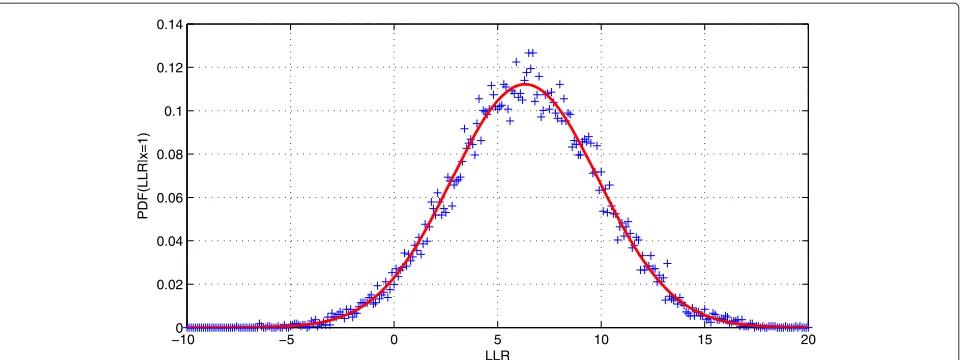
Figure 4 shows simulated conditional LLR PDF in 4 QAM case. Kolmogorov-Smirnov test confirms that it is Gaussian with 0.99 confidence level. Corresponding the-oretical Gaussian distribution is also included in Figure 4. It has a mean of σ12
n = 6.37 and a variance of
2 σ2
n = 12.65, given that SNR = 5 dB and channel is Gaussian. Other parameters used for simulations can be found in Table 1.
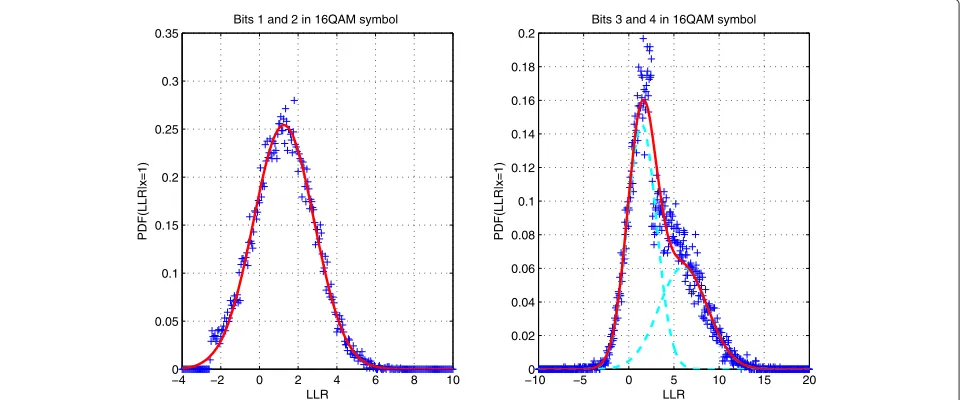
In the case of 16 QAM and 64 QAM modulations, not all conditional LLRs are Gaussians. However, they can be approximated by a mixture of normal distributions [29]. Consequently, the MMIBs for these modulations can be constructed as a linear combination of functionsJ(·)with coefficients found by numerical approximation:
I16 QAM(γ)=
−100 −5 0 5 10 15 20 0.02
0.04 0.06 0.08 0.1 0.12 0.14
LLR
PDF(LLR|x=1)
Figure 4Simulated (crosses) and theoretical Gaussian (curve) conditional LLR distributions for FBMC in 4 QAM case.The means and the variances are equal to 6.36 and 12.70 and 6.33 and 12.65, respectively. The first and the second transmitted bits of a symbol are equal to 1, SNR=5 dB, Gaussian channel.
16 QAM modulation obtained from the FBMC link level simulations in the AWGN channel. SNR of the channel is 5 dB and main parameters are shown in Table 1. It can be observed that for two bits of the 16 QAM symbol, con-ditional LLR PDFs are still Gaussian with 0.99 confidence level. However, conditional distributions for the other two
Table 1 Main parameter of link level simulator
Parameter description Parameter value
Coding Parallel concatenated channel turbo codec
Coding rate Variable, Table 7.2.3.-1 in [27]
Coding block size Variable from 40 to 6,144 bits, Table 5.1.3-3 in [28]
Waveform CP-OFDM (rectangular), PHYDYAS with
overlapping factor 4
Antenna 1 transmitting and 1 receiving (SISO)
Bandwidth 5 MHz
Sampling frequency 7.68 MHz
Sub-carriers number 512
Guard sub-carriers From 1 to 106 and from 407 to 512
Subframe length 1 ms, 14 (OFDM) and 15 (FBMC) MC symbols in time
PRB size 12 sub-carriers in frequency
Channel model AWGN, Ped-B, ETU, 3GPP-HT, etc.
Carrier frequency 422.5 MHz
Velocity 0 m/s, quasi-static channel
Channel estimation Ideal
Equalizer Zero forcing, 1 tap
Symbol demapping Soft, approximate LLR
Modulation 4 QAM, 16 QAM, or 64 QAM
bits can be approximated by a linear combination of two Gaussian distributions.
Next, received distributions for 4 QAM and 16 QAM are exactly the same, as reported in IEEE 802.16 specifications [30]. We expect that the same result is true for 64 QAM as well, because the LLR definition is kept without changes. MMIB functions are calculated from conditional LLR dis-tributions; therefore, we can conclude that they are the same for the FBMC transmission and for the OFDM trans-mission in the AWGN channel. Consequently, functions (Equations 6 to 8) are suitable to be a measure func-tion for the link abstracfunc-tion model for FBMC. Figure 6 presents the MMIB functions used in MI-ESM map-ping to calculate the mean MI quality measure. These MI functions can be utilized for both OFDM and FBMC transmission.
However, the link level performances for FBMC and OFDM transmission in fading channel differ due to an extra inter-symbol interference inherent to OFDM/OQAM based FBMC, as explained in the next section. This difference will require the modification in the channel quality measure, used as an input for the MI calculation in the MMIB link-to-system mapping algorithm.
FBMC technology and intrinsic interference
The transmitted discrete-time FBMC signal can be described as follows:
s[n]=
∞
l=−∞ M−1
m=0
dl,mgl,m[n] , (9)
−4 −2 0 2 4 6 8 10 0
0.05 0.1 0.15 0.2 0.25 0.3 0.35
Bits 1 and 2 in 16QAM symbol
LLR
PDF(LLR|x=1)
−100 −5 0 5 10 15 20 0.02
0.04 0.06 0.08 0.1 0.12 0.14 0.16 0.18 0.2
Bits 3 and 4 in 16QAM symbol
LLR
PDF(LLR|x=1)
Figure 5Simulated (dots) and approximated (curve) conditional LLR distributions for FBMC in 16 QAM case.Distributions for the first and second bits of a symbol on the left are Gaussian with a mean of 1.26 and a variance of 2.46. Distributions for the third and the fourth bits of a symbol on the right are approximated with mixture of two Gaussians: 0.59 G(1.45, 2.62)+0.41 G(6.04, 7.24), whereG(μ,σ2)is Gaussian distribution with meanμand varianceσ2. Transmitted bits are equal to 1, SNR=5 dB, Gaussian channel.
sampling rate MT, and T is the symbol duration. Real information symbols dl,m represent the real and imagi-nary parts of complex QAM symbols [31]. The impulse response of SFB sub-carrier m for each of these real modulation symbols is:
gl,m[n]=θl,m(−1)lmg n−l M
2
ej
2π
Mm
n−Lg−21
, (10)
where
• g[n]is the prototype filter impulse response,
• Lgis the prototype filter length,
• j=√−1,
• θl,m=jl+mis the phase mapping coefficient,
• m∈ {0, 1,· · ·,M−1}is the sub-carrier index,T1 is the sub-carrier spacing,
• lis the time index at FBMC real symbol rateT2.
−300 −20 −10 0 10 20 30 0.1
0.2 0.3 0.4 0.5 0.6 0.7 0.8 0.9 1
SNR, dB
MMIB
4QAM 16QAM 64QAM
Therefore, the FBMC signals[n] in Equation 9 is con-structed as a linear combination of functions with infor-mation symbolsdl,m, similarly to the OFDM principle. In order to have better sub-carrier localization in the fre-quency domain, the regular orthogonality between the SFB at the transmitter and the analysis filter bank (AFB) at the receiver is reduced to real orthogonality. In this paper, we consider the offset QAM (OQAM) case, where the AFB and SFB are basically the same. It is worth mention-ing, however, that in generic FBMC systems, this may not hold. Perfect reconstruction of real symbols after propa-gation through the distortion-free channel in OQAM is achieved with the real orthogonality condition
gl,m,gl0,m0=gl,m,gl0,m0R=
where ∗ denotes complex conjugation and δl,l0 is
Kro-necker’s delta symbol. For filter banks with nearly per-fect reconstruction, condition (Equation 11) is fulfilled approximately. Pulse shapes with even better frequency localization may be used if higher approximation is needed. Note that the imaginary part, gl,m,gl0,m0
, is not equal to zero but constitutes an extra interfer-ence after propagation through the channel with complex impulse response. For comparability purposes, an FBMC design should keep the same system characteristics as used in OFDM, such as number of carriers and sub-carrier bandwidth. However, to transmit real information symbols, the OQAM real symbol period should be taken as T2 to obtain the same data transmission rate as in OFDM. Finally, the prototype filter has lengthLg, which is usually taken as a multiple ofM. Filters are overlapping not only in the frequency domain, but also in the time domain. This means that time multiplexing is observed in FBMC systems and the CP cannot be utilized.
The transmitted FBMC signal is filtered by a time-varying channel with impulse response h(t,τ), with a maximum delay spread , and an additive noise η(t). The received discrete-time signalr[n] can be represented as a convolution ofs[n], with sampled channel impulse responseh[l,i] of finite lengthI(i= 0, 1,· · ·,I−1; =
(I−1)MT):
r[n]=h[l,i]s[n]+η[n] , (12)
where η[m] is complex AWGN, whose real and imag-inary parts are statistically independent. It is assumed to be zero-mean Gaussian with input noise power
E(η[n]η∗[n])=N0. Here, the operatorstands for con-volution. The channel is assumed to be static during an OQAM symbol periodT2.
The received signal can be evaluated as follows:
rwn[n]=h[l,i]s[n]
, and the noise component is omitted for the sake of clarity of presentation.
Next, we are going to present the received signal as an expansion with components, whose absolute values decay as a power ofM. This asymptotic approach shall permit the analytic calculation of the first-order approximation for the FBMC interference power.
Remember thatg[n] is constructed by sampling the con-tinuous prototype filter impulse responseg(t)at sampling frequency MT. Therefore,
g n−i−lM
Ther-th derivative of channel frequency responseHl(f) points outside the intervali∈[0,I−1]. Consequently, as far asM>I, we can take DFT of lengthMinstead ofIfor
This result can be used to rewrite the received signal (Equation 13) as follows:
rwn[n]≈ At the receiver, the AFB demodulates the signal. The real symboldl0,m0is detected from the received signal as
ˆ
We consider zero-forcing equalization of the received sig-nal by a filter that implements a direct channel inversion, i.e. the multiplication byH−1[l0,m0] in the latter equation. Ignoring the contribution of the AWGN, the estimated real symbol is given by
ˆ
is a complex valued term. It can be interpreted as an asymptotic approximation of the residual inter-symbol interference due to the channel spreading. In the case
of a quasi-static channel (H[l,m]= H[m]), the analytic expression of the residual error power (REP) is derived in [23]. At the output of them-th sub-carrier of the equal-izer, the first-order (r=1) approximation of the REP has the form as
2 is the power of the independently and identically distributed real and imaginary partsdl,mof the QAM sym-bols.Gis a constant determined by the shape of the pulse
g[n] and its first-order derivative. In case of the PHYDYAS pulse,G=1, 086.9.
Equation 15 shows that the distortion strongly depends on the channel impulse response variability, as illustrated in Figure 7, where channel frequency responses and values of distortion power are plotted for Pedestrian-A (Ped-A) and 3GPP Hilly Terrain (3GPP-HT) channel models. It can be easily noticed that higher variations in channel PSD cause an increase in REP. Figure 8 shows the PDFs of the distortion power for a bigger selection of commonly used channel models. Results confirm that higher frequency selectivity conditions result in higher residual per-symbol interference.
These findings should be taken into account when designing an accurate FBMC PHY performance model. In order to adjust the channel quality measure in case of FBMC transmission, the post-processed signal-to-noise-plus-distortion ratio (SNDR) should be used instead of the SNR. Consequently, the sub-carrier resource quality mea-sure valuesγk =γmfor Equation 3 should be calculated in the following way
γm=
Ps
Pn[m]+Pe(1)[m]
, (16)
where the noise powerPn[m]= |HN[m0]|2. The evaluation
of a link abstraction model for FBMC based on SNDR rather than on regular SNR can be done only through simulations. The next section is devoted to this topic.
Link abstraction model simulation results
We analyze the output of a MATLAB-based link level sim-ulator in order to evaluate the FBMC link performance model. The performances of both CP-OFDM and FBMC PHYs are compared and validated.
Simulation scenarios
Figure 7PSD and corresponding FBMC distortion power for Pedestrian-A and 3GPP Hilly Terrain channels.
−1000 −80 −60 −40 −20 0 20 0.01
0.02 0.03 0.04 0.05 0.06 0.07 0.08 0.09
Distortion power, dB
Ind−A Ind−B Ped−A Ped−B Veh−A Veh−AE EVeh−A EPed−A ETU 3GPP−TU 3GPP−RA 3GPP−HT
the time dedicated to the CP in OFDM can be dedicated to another MC symbol in FBMC. The minimum resource allocation in the frequency domain occupies 12 sub-carriers, like an LTE physical resource block (PRB). The bit error rate (BER) and BLER performances are measured on LTE physical downlink shared channel (PDSCH)-like allo-cations spanning over 11 (12 in FMBC case) of the 14 (15 in FMBC case) MC symbols, leaving three initial MC sym-bols for hypothetical control information. The simulation parameters are summarized in Table 1.
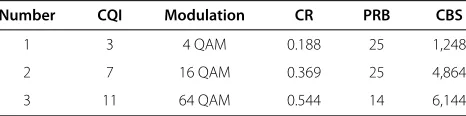
Each simulation scenario in our study is related to a certain modulation type and coding rate (CR). These two parameters, together with the number of PRBs and the frame structure, determine the coding block size (CBS). It is necessary to mention that we use the term CQI to specify the modulation and coding scheme (MCS), as it is explicitly defined in [27].
Additionally, the parameters of channel model and waveform determine the scenario. Channel impulse response and energy per bit to noise power spectral den-sity ratio (Eb/N0) are variable in order to show the BLER performance under different propagation conditions. To calculate the error rate, it is necessary to simulate suf-ficient number of coding blocks (CBs). Therefore, each BLER-Eb/Noor BLER-SNR point is estimated as a result of 10,000 independent drops, where each drop includes the following main steps:
1. Generation of random bit sequence in accordance with specified physical resources and coding rate. 2. Turbo encoding.
3. Mapping of encoded bits to QAM symbols. 4. Generation of MC signal depending on the selected
waveform (CP-OFDM or FBMC). This step includes the calculation and insertion of pilots and the addition of the CP to the OFDM symbol. 5. Estimation of the signal distorted by the channel. 6. MC demodulation of the received signal. 7. Signal equalization. Channel estimation and
synchronization from pilots are supported by the simulator, but are not utilized due to perfect channel knowledge assumption at the receiver.
8. Soft symbol to bit demapping. The LLR of every received bit is calculated.
9. Turbo decoding, where LLRs calculated at the previous step are used as an input.
10. Calculation of BER and decision if CB is received correctly.
Due to the large amount of independent drops, the sim-ulation of each scenario is rather time- and computa-tion power-consuming. For that reason, in this paper, we show the results for three main representative scenar-ios, with parameters summarized in Table 2. In the first
Table 2 Parameters for FBMC simulation scenarios
Number CQI Modulation CR PRB CBS
1 3 4 QAM 0.188 25 1,248
2 7 16 QAM 0.369 25 4,864
3 11 64 QAM 0.544 14 6,144
two scenarios, the whole subframe is used for data trans-mission limiting the CB sizes to 1,248 and 4,864 bits, respectively. In the third scenario, the number of PRBs is equal to 14, since the maximum CB size of 6,144 bits is achieved.
Validation of simulation results
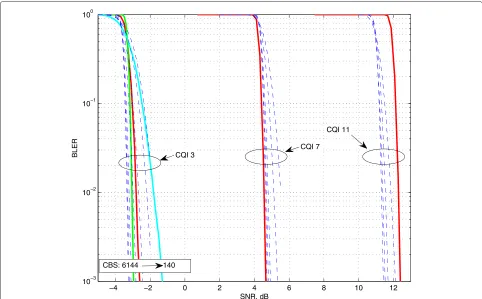
First, the results of the link level CP-OFDM PHY sim-ulations are validated via comparison of received BLER performance curves with their analogs produced by the Vienna LTE simulator [33]. The importance of such exam-ination is emphasized by the fact that AWGN BLER curves are the reference used for BLER estimation in fad-ing channels. In particular, they are utilized in the system level simulator for link level abstraction.
In our study, the simulations are performed for varying
Eb/No. The SNR is calculated in the following way
SNR[dB]= Eb
No
[dB] + 10 log10(μ)+10 log10(Ecp)
+ 10 log10(Eg), (17)
whereμis the number of bits per symbol (equals to 2 for 4 QAM, 4 for 16 QAM, and 6 for 64 QAM),Ecptakes into account the inefficiency of the CP, andEg is responsible for the guard sub-carriers as follows
Ecp=
transform size transform size+CP length,
Eg=
transform size
transform size+number of guard sub-carriers.
−4 −2 0 2 4 6 8 10 12 10−3
10−2 10−1 100
SNR, dB
BLER
CBS: 6144 140 CQI 3
CQI 7 CQI 11
Figure 9CP-OFDM BLER curves from Vienna (blue dashed curves) and our simulator (solid curves) are close enough.Red curves correspond to scenarios from Table 2, green line represents CQI 3 with CBS=4, 992 bits, and cyan - CQI 3 with CBS=152 bits.
−6 −4 −2 0 2 4 6 8
10−3 10−2 10−1 100
EbNo, dB
BLER
OFDM, normal CP FBMC OFDM, long CP
CQI 3 CQI 7 CQI 11
−15 −10 −5 0 5 10 15 10−4
10−3 10−2 10−1 100
BLER
SNR, dB CQI1
CQI2
CQI3
CQI4
CQI5
CQI6 CQI7 CQI8 CQI9
CQI10 CQI11
Figure 11The set of SNR-BLER curves.The set of SNR-BLER curves for different CQIs from [27] in the case of FBMC PHY for AWGN channel.
The next step of the verification consists of the com-parison of AWGN BLER performance curves produced by our link level simulator for CP-OFDM and FBMC PHY. The BLER versus Eb/N0 performance curves depicted in Figure 10 show the advantage of FBMC over the CP-OFDM system. First, it is achieved due to the absence
of CP as follows directly from Equation 17. Additionally, freed resources in time domain can be used to transmit one extra symbol per subframe in FBMC case. Therefore, longer CBS for given CR can be utilized. For scenarios from Table 2 presented in Figure 10, OFDM CBSs are 1,120; 4,416; and 5,568, correspondingly.
0.15 0.2 0.25 0.3 0.35 0.4 0.45 0.5 0.55 0.6 0.65 10−4
10−3 10−2 10−1 100
MMIB
BLER
Fitted curve Calculated BLER
CQI 3 CQI 7 CQI 11
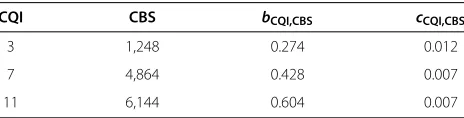
Table 3 Fitting parameter of MMIB-BLER curves in AWGN channel
CQI CBS bCQI,CBS cCQI,CBS
3 1,248 0.274 0.012
7 4,864 0.428 0.007
11 6,144 0.604 0.007
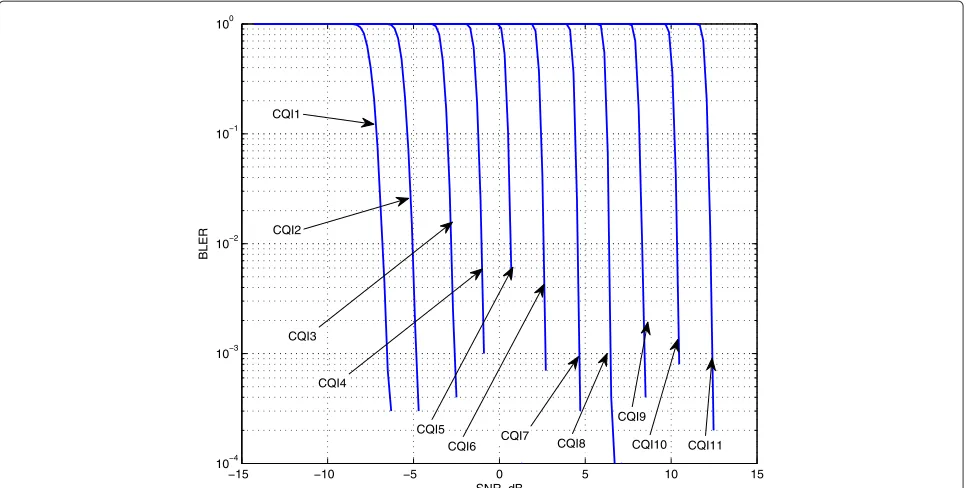
Finally, Figure 11 presents the full set of BLER perfor-mance curves for FBMC PHY, produced for the AWGN channel. Notice that the proposed link level abstraction model requires the use of BLER versus MMIB perfor-mance curves. The following accurate approximation can be used [29]
BLERCQI,CBS(MMIB)= 1 2
!
1−erf
MI√−bCQI,CBS 2cCQI,CBS
"
,
(18)
where constantsbCQI,CBSandcCQI,CBS are fitting param-eters determined for a given CQI and CBS, and erf(·) is the Gaussian error function. This approach facilitates the BLER calculation on the system level, since only two parameters for each curve are needed. Several examples of this fitting are presented on Figure 12. The values of the fitting parameters can be found in Table 3. In general, these parameters can be pre-calculated for each combination of CQI and CBS.
FBMC performance in fading channels
Up to this point, simulation results only consider an AWGN channel. However, it is also necessary to show how the proposed link level abstraction model works in fading channels. The behavior of the correspond-ing BLER curves can be observed in Figure 13, for the scenarios from Table 1. As expected, the PHY perfor-mance decreases in comparison to the AWGN channel. Moreover, for 64 QAM modulation, a floor is observed for 3GPP-HT channel, since a one-tap equalizer can-not cope with the channel distortion and the BLER does not decrease even at low noise levels. This fact confirms the dependence on the additional distortion intrinsic to the FBMC PHY, as discussed in the previous section. However, more advanced equalizers are capable to sup-press better the remaining interference, as shown in [37].
Furthermore, simulation results show that the quality of the FBMC PHY performance model strongly depends on the value of the distortion. To demonstrate this effect, we present the comparison of estimated and simulated BLERs in the case of 16 QAM and 64 QAM modula-tions for highly fading channels. In particular, in Figure 14, the results of BLER mapping for several realizations of 3GPP-HT channel are presented according to the ESM principle (Equation 1).
The average MMIB values (Equation 3) for the upper graph are calculated when the regular SNR is taken as channel quality measure γk. In the lower graph, SNDR
−10 −5 0 5 10 15 20 25 30 35 40 10−4
10−3 10−2 10−1 100
BLER
SNR, dB
3GPP−HT channel ETU channel Ped−B channel AWGN channel
CQI 3
CQI 7
CQI 11
0.4 0.41 0.42 0.43 0.44 0.45 0.46 0.47 0.48 0.49 10−4
10−3 10−2 10−1 100
SNR as channel quality measure
MMIB
BLER
0.4 0.41 0.42 0.43 0.44 0.45 0.46 0.47 0.48 0.49 10−4
10−3 10−2 10−1 100
SNDR as channel quality measure
MMIB
BLER
Sim. BLER, chan. 1 Est. BLER, chan. 1 Sim. BLER, chan. 2 Est. BLER, chan. 2 Est. BLER, chan. 3 Sim. BLER, chan. 3 Sim. BLER, chan. 4 Est. BLER, chan. 4 AWGN Channel
3GPP−HT channel realisations
Figure 14Difference between simulated and estimated BLERs for 16 QAM in 3GPP-HT channels.Difference between simulated and estimated BLERs for 16 QAM in 3GPP-HT channels is much bigger if FBMC distortion is not taken into account. Round dots correspond to the simulated BLER values. Asterisks dots correspond to the estimated BLER values, which are constructed via approximation (Equation 18) for CQI 7.
values (Equation 16) are used instead. Arrows in the upper graph show the difference between estimated and simu-lated BLER values. The link performance model error can be quantified, expressing it in terms of the mean square error (MSE):
MSE= 1
N N−1
n=0
|log10(BLERest,n)−log10(BLERsim,n)|2,
whereNis the total number of independent simulations. Figure 14 shows that the MSE considerably decreases from 4.74 (upper graph) to 0.14 (lower graph) due to the utilization of the SNDR as channel quality measure.
A similar trend can be observed in Figure 15, where simulated and estimated BLERs for CQI 11 over differ-ent ETU channel realizations are illustrated. From the upper graph, it can be clearly seen that traditional SNR quality measure cannot efficiently cope with the inter-ference. In this case, it makes no sense to calculate the MSE, because the errors are too high. However, if we account for distortion (Equation 15) in the lower graph, we get on average MMIB - BLER points much closer to
the desired AWGN BLER curve. The floor in the BLER curves, as already observed in Figure 13, can also be seen in Figure 15. This effect, which becomes visible for higher-order modulations, cannot be fully predicted by the reference AWGN BLER curve, because it assumes an infinite decrease of the BLER with increasing SNR. However, this problem can be addressed in practice by introducing a lower limit for the validity of the esti-mated BLER. For example, for 64 QAM, it could be set at 10−4.
MMIB link level abstraction of FBMC-based systems We summarize here the steps of the link abstraction algorithm as follows:
• The set of fitting coefficientsbCQI,CBSandcCQI,CBSfor
MMIB-BLER AWGN curves from Equation 18 (see Figure 12) are pre-calculated and stored (see Table 2).
• SNDR values (Equation 16) are used as channel
quality measures.γkare calculated for every resource
0.58 0.6 0.62 0.64 0.66 0.68 0.7
10−4
10−3
10−2
10−1
100
SNR as channel quality measure
MMIB
BLER
0.58 0.6 0.62 0.64 0.66 0.68 0.7
10−4
10−3
10−2
10−1
100
SNDR as channel quality measure
MMIB
BLER
Sim. BLER, chan. 1 Est. BLER, chan. 1 Sim. BLER, chan. 2 Est. BLER, chan. 2 Sim. BLER, chan. 3 Est. BLER, chan. 3 Est. BLER, chan. 4 Sim. BLER, chan. 4
ETU channels
AWGN estimation
Figure 15Difference between simulated and estimated BLERs for 64 QAM in ETU channels.Difference between simulated and estimated BLERs for 64 QAM in ETU channels is much bigger if FBMC distortion is not taken into account. Round dots correspond to the simulated BLER values. Asterisks dots correspond to the estimated BLER values, which are constructed via approximation (Equation 18) for CQI 7.
• MMIB values are calculated according to
Equations 6, 7, or 8 for eachγkdepending on the
modulation defined by the CQI (see Figure 6).
• MMIB values calculated in the previous step are
averaged according to Equation 3.
• The error rate of a given CB is calculated according to
Equation 18 with the average MMIB value as an input.
As a result of the research presented in this paper, it can be concluded that the signal-to-interference, noise and distortion ratio (SINDR) should be included into FBMC-based system level simulator as a part of the CB error estimation model. The ns-3 open source LTE (Long Term Evolution)-EPC (Evolved Packet Core) network simulator module LENA [38] can be consid-ered as a promising tool for future FBMC research. The MMIB-based link abstraction model for OFDM is already realized there [39]. Fast-fading samples for time-frequency instances are pre-calculated for the specific channel model, mobile velocity and carrier frequency.
With respect to the LTE implementation provided by ns-3, modifications are needed to extend the simulator’s
models to the PMR scenario. Regarding to the FBMC link performance model, the distortion samples have to be pre-calculated at RB resolution simultaneously with fast-fading samples. The constant SINDR value for each RB has to be evaluated according to Equation 16. Link level look-up tables for MI versus SINDR and for BLER values versus MMIB in AWGN channel, for the full set of modu-lation and coding schemes need to be available in correct format as a simulator input. Finally, the error model has to be adapted to utilize the MMIB link level performance model for the FBMC transmission.
Conclusions
in the link level abstraction model. As a result, the quality measure of the resource element that we propose to consider for the FBMC transmission is the received SNDR.
The mean MI model via the MMIB approach has been deeply analyzed for suitability to the FBMC transmission and verified by simulations. The simulation results have shown that conditional LLR distributions do not differ for CP-OFDM and FBMC transmission techniques in AWGN channel. Therefore, the same approximations of MMIB functions for 4 QAM, 16 QAM, and 64 QAM modulations can be utilized in the case of the FBMC transmission. The FBMC-related results of the link level simulations have been compared with the corresponding CP-OFDM per-formance. It has been confirmed that BLER performance curves for both technologies in AWGN channels are the same. Additionally, simulation results in CP-OFDM sce-narios have been validated, comparing them to publicly available reference results from the Vienna LTE simula-tor. FBMC BLER performance curves have been presented for several channel models, such as Ped-B, ETU, and 3GPP-HT.
Finally, we conclude that the traditional MMIB-based link abstraction model cannot be used in high fading channels for the FBMC transmissions, especially with higher-order modulations. The proposed model with dis-tortion correction is kept simple and is more accurate, and it can be efficiently used for link-to-system map-ping in the FBMC case. Future work will include studying the performance of the developed link abstraction model in cases of more advanced receivers, non-ideal channel estimation, and in the presence of interference. Addition-ally, system level simulations with the ns-3 simulator in a broadband PMR network scenario applying the pro-posed link quality estimation are also a topic for future research.
Competing interests
The authors declare that they have no competing interests.
Acknowledgements
The authors would like to thank the anonymous reviewers and the editors for their constructive comments and suggestions to improve the manuscript, both in presentation and contents. The authors acknowledge Dr. Xavier Mestre for help in calculation and evaluation of the distortion and Dr. Stephan Pfletschinger for fruitful discussion of MI-ESM approach and help in soft demapping for link level simulator. We also would like to thank professor Tapani Ristaniemi for valuable advice and professor Timo Hämäläinen for the technical support. The authors acknowledge the financial support by the European Union FP7-ICT project EMPhAtiC (http://www.ict-emphatic.eu) under grant agreement no. 318362.
Author details
1Magister Solutions Ltd., Sepänkatu 14 C, 40720 Jyväskylä, Finland.2Centre
Tecnològic Telecomunicacions Catalunya, Av. de Carl Friedrich Gauss,7, Parc Mediterrani de Catalunya, 08860 Castelldefels, Barcelona, Spain.
Received: 31 December 2013 Accepted: 7 November 2014 Published: 27 November 2014
References
1. Telecommunications and Information Exchange Between Systems - Local and Metropolitan Area Networks - Specific Requirements - Part 11: Wireless LAN Medium Access Control (MAC) and Physical Layer (PHY) Specifications.IEEE Standard for Information Technology. IEEE Std 802.11-2007 (Revision of IEEE Std 802.11-1999) (2007)
2. Part 16: Air interface for fixed and mobile broadband wireless access systems. Amendment 2 Physical and medium access control layers for combined fixed and mobile operation in licensed bands and corrigendum 1.IEEE Standard for Local and Metropolitan Area Networks. IEEE Std 802.16e-2005 and IEEE Std 802.16-2004/Cor 1-2005 (Amendment and Corrigendum to IEEE Std 802.16-2004) (2006)
3. WiMAX Forum, Mobile System Profile. Release 1.0 Approved Specification, Revision 1.5.0 (2007)
4. 3GPP TSG-RAN, TS 36.211 Physical channels and modulation. Release 8 (2009)
5. ETSI, TR 102 580 V1. 1.1 Terrestrial Trunked Radio (TETRA) (2007) 6. TETRAPOL Open, Digital, Purpose-built Professional Mobile Radio (PMR)
Technology. http://www.tetrapol.com
7. M Renfors, F Bader, L Baltar, D Le Ruyet, D Roviras, P Mege, M Haardt, TH Stitz, inProceedings of 77th Vehicular Technology Conference (VTC 2013),On the use of filter bank based multicarrier modulation for professional mobile radio, (Dresden, Germany, 2013)
8. A Sahin, H Arslan, Edge windowing for OFDM based systems. Commun. Lett. IEEE.15(11), 1208–1211 (2011)
9. Z Yuan, AM Wyglinski, On sidelobe suppression for multicarrier-based transmission in dynamic spectrum access networks. Vehic. Technol. IEEE Trans.59(4), 1998–2006 (2010)
10. H-M Chen, W-C Chen, C-D Chung, Spectrally precoded OFDM and OFDMA with cyclic prefix and unconstrained guard ratios. Wireless Commun. IEEE Trans.10(5), 1416–1427 (2011)
11. B Le Floch, M Alard, C Berrou, Coded orthogonal frequency division multiplex [TV broadcasting]. Proc. IEEE.83(6), 982–996 (1995) 12. Physical layer for dynamic spectrum access and cognitive radio
(PHYDYAS) project. http://www.ict-phydyas.org/
13. M Renfors, J Yli-Kaakinen, F Harris, Analysis and design of efficient and flexible fast-convolution based multirate filter banks. IEEE Trans. Signal Process.62(15), 3768–3783 (2014)
14. W Kozek, AF Molisch, Nonorthogonal pulseshapes for multicarrier communications in doubly dispersive channels, Select. Areas Commun. IEEE J,16(8), 1579–1589 (1998)
15. G Fettweis, M Krondorf, S Bittner, inVehicular Technology Conference, 2009. VTC Spring 2009. IEEE 69th. GFDM - generalized frequency division multiplexing, (IEEE Piscataway 2009), pp. 1–4
16. S Josilo, M Pejovic, S Nedic, inWireless Communication Systems (ISWCS 2013), Proceedings of the Tenth International Symposium On. Non-uniform FBMC - a pragmatic approach, (VDE Berlin, 2013), pp. 1–5
17. P Siohan, C Siclet, N Lacaille, Analysis and design of ofdm/oqam systems based on filterbank theory. Signal Process. IEEE Trans.50(5), 1170–1183 (2002)
18. TH Stitz, T Ihalainen, A Viholainen, M Renfor, Pilot-based synchronization and equalization in filter bank multicarrier communications. EURASIP J. Adv. Signal Process.2010(2010). doi:10.1155/2010/741429
19. H Zhang, D Le Ruyet, D Roviras, Y Medjahdi, H Sun, Spectral efficiency comparison of OFDM/FBMC for uplink cognitive radio networks. EURASIP J. Adv. Signal Process (2010). doi:10.1155/2010/621808
20. J Olmos, S Ruiz, M García-Lozano, D Martín-Sacristán, Link abstraction models based on mutual information for lte downlink. COST 2100 TD.10, 1–18 (2010)
21. D Petrov, P Gonchukov, TH Stitz, inWireless Communication Systems (ISWCS 2013), Proceedings of the Tenth International Symposium On. Link to system mapping for FBMC based systems in SISO case (VDE Berlin, 2013), pp. 1–5 22. A Oborina, C Ibars, L Giupponi, F Bader, Link performance model for
system level simulations of filter bank multicarrier-based systems in PMR networks. Wireless Communication Systems (ISWCS 2013), Proceedings of the Tenth International Symposium On, 1–5 (2013)
23. X Mestre, M Majoral, S Pfletschinger, An asymptotic approach to parallel equalization of filter bank based multicarrier signals. Signal Process. IEEE Trans.61(14), 3592–3606 (2013)
24. K Brüninghaus, D Astély, T Salzer, S Visuri, A Alexiou, S Karger, G Seraji, in
and Mobile Radio Communication: September 2005. Link performance models for system level simulations of broadband radio access systems, vol. 4 (Berlin, Germany, 2005), pp. 2306–2311
25. Ericsson, Effective SIR mapping for modeling frame error rates in multiple-state channels. Technical Report 3GPP2-C30-20030429-010, 3rd Generation Partnership Prohject2 3GPP2 (APR 2003). ftp://ftp.3gpp2.org/ 26. J Kim, A Ashikhmin, A van Wijngaarden, E Soljanin, N Gopalakrishnan,
Reverse link hybrid ARQ: link error prediction methodology based on convex metric. Lucent Technologies, 3GPP2 contribution, TSG-C WG3 (2003)
27. 3GPP TSG-RAN, TS 36.213 V9.2.0 Evolved Universal Terrestrial Radio Access (E-UTRA); Physical layer procedures. Release 9 (2010) 28. 3GPP TSG-RAN, TS 36.212 V11.2.0 Evolved Universal Terrestrial Radio
Access (E-UTRA); Multiplexing and channel coding. Release 11 (2013) 29. R Srinivasan, J Zhuang, L Jalloul, R Novak, J Park, IEEE 802.16 m evaluation
methodology document (emd). IEEE 802.16 Broadband Wireless Access Working Group (2008)
30. K Sayana, J Zhuang, K Stewart, Link performance abstraction based on mean mutual information per bit (MMIB) of the LLR channel. IEEE 802.16 Broadband Wireless Access Working Group (2007)
31. A Viholainen, M Bellanger, M Huchard, Prototype filter and structure optimization. Technical Report PHYDYAS 007 D5.1 PHYDYAS - PHYsical Layer for DYnamic AcesS and cognitive radio (JAN 2009). http://www.ict-phydyas.org/delivrables/PHYDYAS-D5-1.pdf
32. AV Oppenheim, RWS Schafer, Discrete-time signal processing. Prentice Hall (2009)
33. C Mehlführer, JCC Ikuno, M Šimko, S Schwarz, M Wrulich, M Rupp, The Vienna LTE simulators-enabling reproducibility in wireless
communications research. EURASIP J. Adv. Signal Process.2011(1), 1–14 (2011)
34. Vienna LTE Simulators LTE-A Link Level Simulator Documentation, V1.2. http://www.nt.tuwien.ac.at/fileadmin/topics/simulators/LTEAlinkDoc.pdf 35. ns-3 Mutual Information Error Model, Source Code. http://code.nsnam.
org/ns-3.19/file/4f364b42b8e3/src/lte/model/lte-mi-error-model.cc 36. ns-3 Discrete-event Network Simulator for Internet Systems. http://www.
nsnam.org/
37. T Ihalainen, T Hidalgo Stitz, M Rinne, M Renfors, Channel equalization in filter bank based multicarrier modulation for wireless communications. EURASIP J. Adv. Signal Process.2007(1), 1–18 (2007)
38. LTE EPC Network simulAtor (LENA), Ns-3 Module
39. G Piro, N Baldo, M Miozzo, An LTE module for the ns-3 network simulator. Proceedings of the 4th International ICST Conference on Simulation Tools and Techniques: March 2011, 415–422 (2011)
doi:10.1186/1687-6180-2014-169
Cite this article as:Petrovet al.:Link performance model for filter bank based multicarrier systems.EURASIP Journal on Advances in Signal Processing
20142014:169.
Submit your manuscript to a
journal and benefi t from:
7Convenient online submission 7Rigorous peer review
7Immediate publication on acceptance 7Open access: articles freely available online 7High visibility within the fi eld
7Retaining the copyright to your article