F U L L P A P E R
Open Access
Simultaneous ground-based optical and
SuperDARN observations of the shock
aurora at MLT noon
Jianjun Liu
1,2*, Hongqiao Hu
1, Desheng Han
1, Huigen Yang
1and Mark Lester
3Abstract
Using ground-based high temporal and spatial optical aurora observations, we investigated one fortuitous event to illustrate the direct responses of the fine structure auroral emission to interplanetary shock on 7 January 2005. During the shock impact to the magnetosphere, the Chinese Arctic Yellow River Station (YRS) equipped with all-sky imagers (ASIs) was situated at the magnetic local noon region (~1210 MLT) in the Northern Hemisphere, while the SuperDARN CUTLASS Finland HF radar covering the field of view (FOV) of the ASIs at YRS had fine ionospheric plasma convection measurement. We observed that an intensified red aurora manifesting as a discrete emission band at a higher latitude responds to the shock impact gradually, which results in a distinct broadening of the dayside auroral oval due to the equatorward shifting of its lower latitude boundary after the shock arrival. In contrast, the green diffuse aurora, manifesting as a relatively uniform luminosity structure, reacts immediately to the shock compression, displaying prompt appearance in the southern edge of the FOV and subsequent poleward propagation of its higher latitude boundary. Simultaneously, the CUTLASS Finland radar monitored enhanced backscatter echo power and increased echo number, which coincided with intensified discrete aurora in approximately the same latitudinal region. Doppler velocity measurement showed moving ionospheric irregularities with generally enhanced line-of-sight (LOS) speed, but with prominent sunward flow in the polar cap and antisunward flow in both the eastern and western regions. The SuperDARN global ionospheric convection pattern clearly presented a large-scale plasma flow divided in four circulation cells, with two reversed flow cells nested in the noon sector of the polar cap. These direct observations strongly suggest that the prompt shock compression intensified the wave-particle interaction in the inner magnetosphere and enhanced the lobe magnetic reconnection rate at magnetospheric high latitude.
Keywords:Interplanetary shock; Sudden impulse; Optical aurora; SuperDARN; Sunward flow
Background
The large-scale auroral feature associated with interplan-etary shock (i.e., shock aurora) has been investigated widely over the last two decades mainly using satellite onboard imager observations (Sibeck et al. 1999; Zhou and Tsurutani 1999; Zhou et al. 2003; Meurant et al. 2003; Meurant et al. 2005). It is well known that shock aurora imaged from satellites show that the general auroral emission brightens near local noon region at the time of the shock arrival to the magnetopause nose. The
initial brightening sector of shock aurora was usually limited to the ionospheric footprint of the magneto-spheric cusp with longitudinal width of a few magnetic local time (MLT) hours, and then propagates toward dawnside and duskside along the auroral oval flanks with high speed and terminates the midnight sector ultim-ately (Zhou and Tsurutani 1999; Tsurutani et al. 2001; Meurant et al. 2004). The magnetospheric cusp is a re-gion in which the magnetosheath plasma has direct access to the polar ionosphere, and is the first region to directly respond to IP shocks in geospace (Fuselier et al. 2000; Zhou et al. 2009). Therefore, detailed studies focusing on the shock-related phenomena in the cusp, especially around the MLT noon, are quite essential in revealing its early response.
* Correspondence:[email protected]
1
SOA Key Laboratory for Polar Science, Polar Research Institute of China, Shanghai 200136, China
2
State Key Laboratory of Space Weather, Chinese Academy of Science, Beijing 100080, China
Full list of author information is available at the end of the article
Previous studies on shock aurora were mainly con-centrated on the measurements of large-scale auroral emissions from satellite imager observations and char-acteristics of energetic particle precipitation, but with few works using ground-based medium and small-scale optical aurora and simultaneous related ionospheric plasma drift measurements (Zhou and Tsurutani 1999; Zhou et al. 2003; Meurant et al. 2003; Zhou et al. 2009; Motoba et al. 2009; Liu et al. 2011). It is known that large-scale auroral imaging benefits to reveal the over-all interaction process during this critical condition affected by the disturbed solar wind structure, but detailed ground-based measurement also plays an es-sential role in understanding the fine interaction in-side the compound coupling system. It is generalized that, however, overall features on the oval and some localized aurora beyond the oval were captured visually and analyzed with the aim to study how the solar wind affects the magnetosphere globally through changes in the Earth's aurora (Zhou et al. 2003; Hubert et al. 2003; Hubert et al. 2006; Frey 2007; Hubert et al. 2013).
Aurora responding to the IP shock compression or the sudden solar wind dynamic pressure enhancement from ground-based optical measurement revealed that the in-tensified diffuse and discrete aurora expanded equator-ward (Sandholt et al. 1994; Zhou et al. 2009). Based on simultaneous ground-satellite optical observations in the Southern Hemisphere, Motoba et al. (2009) revealed a two-step development of the postnoon shock aurora, which shows first diffuse aurora expanding duskward at the equatorward edge of the oval and subsequent newly formed discrete arcs in the middle of the oval. After-wards, Liu et al. (2011) reported a transient decrease of discrete aurora and simultaneous ionospheric plasma flow reversal for short period just after the shock arrival, i.e., during the preliminary impulse of a sudden com-mencement event. Intensified auroral arc with a lifetime of ~14 min and periodical oscillation in the ionospheric plasma flow were detected by ASI and SuperDARN caused by the shock impact (Liu et al. 2013). All of these works mentioned above demonstrated that more fea-tures of shock aurora and related ionospheric response have not been unveiled yet. Most studies associated with shock-related aurora specialized in research on vari-ation of the 630.0-nm red discrete aurora as a proxy for the open-close field line boundary (Sandholt et al. 1994; Blanchard et al. 1995; Blanchard et al. 1997), but they do not pay more attention to the detailed vari-ation of diffuse auroral emission around MLT noon. Therefore, a general direct relationship between day-side aurora and IP shock has been observed, but more exact response time and certain auroral forms have been elusive because of low temporal and spatial reso-lution observation.
It is well known that the interplanetary shock plays a key role on magnetospheric configuration (Boudouridis et al. 2003; Laundal and Østgaard 2008). It follows that such influence over the magnetospheric configuration will have a corresponding effect on the size and location of the auroral oval, polar cap, and the associated auroral intensity, field-aligned currents, and ionospheric convec-tion (Boudouridis et al. 2007). Coco et al. (2008) used SuperDARN, spacecraft and ground magnetometer data to study the magnetosphere compressed by an interplan-etary shock during an IMF By-dominated period, they
found that at very high latitudes above the northern cusp and in the morning sector, enhanced sunward con-vection fluxes appear with a signature typical for north-ward Bz-dominated lobe reconnection.
YRS produces high quality optical data and is ideally located to monitor the dayside aurora (Hu et al. 2009; Zhang et al. 2010). We checked one shock aurora event with high temporal and spatial resolution when YRS was located around MLT noon, which gives us an opportunity to make more detailed examination of the evolution of visible auroral emissions (green and red) during the disturbed magnetosphere caused by the external shock impact. Furthermore, the SuperDARN CUTLASS Finland radar, which is a stereo system with two experimental modes and scans over the YRS (Lester et al. 2004), has full ionospheric irregularity monitoring results. Those combined measurements enabled us to ex-tend our view to shock aurora fine structure and its re-lated ionospheric signature.
Methods Instrumentation
the all-sky cameras were set at 7 and 3 s, respectively. Thus, the time resolution of tahe optical aurora data is 10 s. Based on its superior geomagnetic location in the polar cusp region and multi-wavelength optical imaging in-struments, YRS is an ideal auroral observatory for con-tinuously monitoring dayside auroral emissions during the whole winter in the Northern Hemisphere, and can pro-vide plentiful source data for auroral investigations since its initial operation in late 2003 (Hu et al. 2009; Hu et al. 2010; Zhang et al. 2010; Hu et al. 2012).
To address how ionospheric convection responds to the shock compression, we checked the SuperDARN radar
observation in the Northern Hemisphere. CUTLASS (Co-operative UK Twin Located Auroral Sounding Sys-tem) Finland HF radar, located at Hankasalmi (62.3° N, 26.6° E) and operated since February 1995, is an essen-tial part of the SuperDARN radar network (Lester et al. 2004; Chisham et al. 2007). It has an array of 16 trans-mitting and receiving antennas. The radar can operate at frequencies between 8 and 20 MHz in the HF band, and each antenna array is phased relative to the others to form an antenna pattern with maximum gain in one of the 16 azimuthal pointing directions (so-called beams). The beam width is set to ~3.4°; thus the CUTLASS Finland
radar has roughly 54° azimuthal FOV coverage with its central beam scanning over zenith of YRS as shown by radial solid line in Fig. 1.
The coherent CUTLASS Finland radar measures iono-spheric backscatter echoes from field-aligned plasma ir-regularities in the high-latitude ionosphere (Lester et al. 2004). These backscatter Doppler echoes can be used to derive parameters of echo power, line-of-sight velocity, and spectral width. With regard to this study, the CUTLASS Finland radar was operating in a frequency of 11 MHz and scanned 16 beams with a dwell time of 7 s at each beam, giving a fan-shaped FOV scanning every 2 min. For each beam, a total of 75 range gates were sampled with a pulse length of 300 us, corre-sponding to a range gate length of 45 km. The time lag to the first gate was set at 1200 us, which means that the range was extended from 180 to 3555 km for one beam. Consequently, YRS at NYA formed a better place for investigating the auroral fine structure and simul-taneous ionospheric plasma convection.
Observations
Solar wind and geomagnetic field response
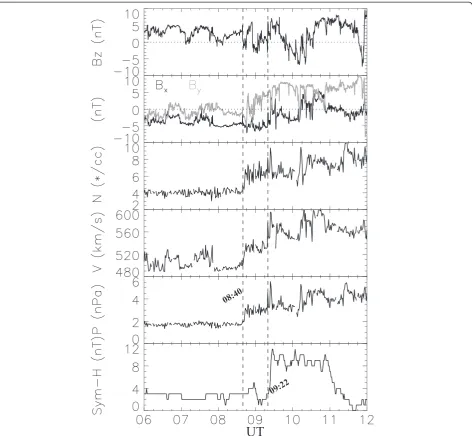
As shown in Fig. 2, an interplanetary fast-moving for-ward shock was observed at ~08:40 UT when the ACE spacecraft was at (229, −40, and 23 RE). At the shock,
the solar wind dynamic pressure increased suddenly from ~1.8 to 3.6 nPa due mainly to a clear increase in proton density and solar wind speed. Sibeck (1990) showed thatδp/p, notδp, is the main factor for decid-ing the effect of the transient magnetospheric responses to sudden solar wind dynamic pressure variations. For this event, the amplitude of the solar wind dynamic pressure pulse (δp/p) is about 1.0, which is large dramatic-ally as defined by Sibeck (1990), so we can expect clear compressional effects in the magnetosphere-ionosphere system and geomagnetic field. The IMF magnitude in-creased from 5.2 to 7.2 nT at the shock. The IMF Bz
com-ponent was positive (northward) in the shock upstream, and experienced brief excursion to negative (southward) just downstream of the shock, so it can be expected that the magnetosphere was not much loaded with open mag-netic flux. The IMF Bywas weakly negative near zero
up-stream and turned positive downup-stream of the shock. For this shock, magnetic coplanarity (MC), velocity copla-narity (VC), three mixed methods (MX1, MX2, MX3) (Schwartz 1998), and the Rankine-Hugoniot method were used to determine the shock normal, shock speed, and mach number (Berdichevsky et al. 2000). The cal-culated shock normal vector, which strongly influences the nature of the shock, is (−0.873, −0.445, 0.200) in GSM coordinates , and the shock Mach number is 1.62 with a shock speed of 522.5 km/s along the normal dir-ection (Wang et al. 2010). It is investigated that most of
the shock orientation are in the range 130–170°; an angle of 180° indicates the shock is antiparallel to the Sun-Earth line and thus hits the magnetosphere head-on (Wang et al. 2009). This shock frhead-ont is estimated to hit the magnetopause at a local time of ~1030 (shown in Fig. 1), and the auroral initial brightening was ex-pected to occur near local noon. The bottom panel of Fig. 2 shows the Sym-H index used to determine the responses of the geomagnetic field in the low-latitude region to the IP shock compression and related dy-namic process. Sudden featured increase in the Sym-H index at ~09:22 UT from a low stable value indicates that a geomagnetic sudden impulse (SI) was triggered by the shock compression. Indeed, such SI signature was shown to be a good indicator of IP shock arrival to the magnetosphere (Wang et al. 2010).
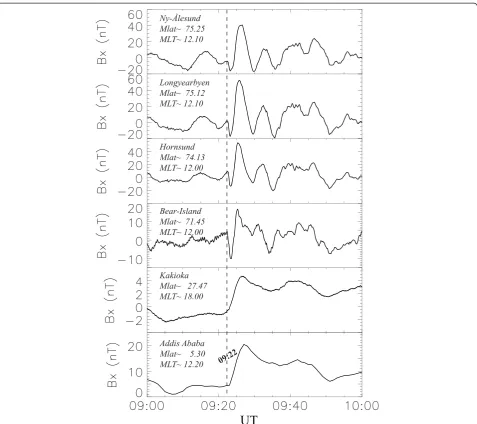
Figure 3 shows the geomagnetic field observations of the SI by fluxgate magnetometers distributed from low latitude to the polar region in the Northern Hemisphere. Geographical locations of these four polar observatories were indicated by solid black dots in Fig. 1. Besides Kakioka, which provides one second resolution data in East Asia, the other five magnetic observatories are roughly aligned along the same geographical meridian where YRS is located. It is indicated that the geomag-netic field was relatively stable before the shock arrival at 09:22 UT marked by the vertical dashed line in Fig. 3. The geomagnetic field variation associated with the SI in low-latitude stations such as Addis Ababa and Kakioka presents simple monotonic enhancement of its north-ward components. This apparent increase of the geo-magnetic field intensity in lower latitude region was produced mainly by enhanced eastward electric currents flowing on the magnetopause and a propagating com-pressional wave front associated with shock compression (Araki 1994). It should be noted that the simultaneous geomagnetic field response in the polar region was essentially different from those observed at lower lati-tude, which first showed a preliminary negative im-pulse followed by a main imim-pulse. Previous research revealed negative impulse was caused by the instant dusk-to-dawn electric field, which was transmitted to the polar ionosphere from the compressional wave front propagating in the dayside magnetosphere (Araki 1994; Han et al. 2010). Subsequent larger positive im-pulse in the main phase of the SI was associated with the enhanced large-scale dawn-to-dusk convection elec-tric field. In general, the shock impact triggered signifi-cant and direct electromagnetic environmental change in geospace.
Optical auroral data
polar region located at almost magnetic local noon (~1210 MLT) as well under the ionospheric footprint of the magnetospheric cusp region (Hu et al. 2009; Zhang et al. 2010). This superior geomagnetic position right beneath the dayside auroral oval with high quality optical auroral data provides a unique opportunity to study the dayside auroral fine structure in the context of the dynamic disturbed magnetosphere-ionosphere coupled system. Figure 4 shows the 30 s interval’s aur-oral image sequence in green line emissions performed at YRS during 09:20:00–09:30:30 UT (optical wave-length centered at 557.7 nm). Frames at 09:20:00 and
09:21:00 UT shortly before the shock arrival illustrate the in-situ background auroral emission in the cusp re-gion. The following 18 frames with 30-s time resolution show the aurora during the shock compression, identi-fying its detailed bright and motional evolution. The capture time is written at the top of each frame. The red dashed line between 100 and 110E° meridian line indicates the magnetic local noon, and NYA at Svalbard was marked at the center of each frame.
Before the SI onset at ~09:22 UT, Fig. 4 shows that the dim green aurora in ray or weak patchy structure can be seen in the northern portion of the FOV, which signifies
that the cusp auroral emission was steady before ~09:22 UT, namely intervals prior to the magnetospheric dis-turbance caused by the shock impact. It is worth noting that southern unstructured, quite low, intensity emis-sions at ~0.25 kR were detected by the ASI. This funda-mental optical signature in the southern portion of the FOV of the ASI signifying the wave-particle interaction did not show active in the inner magnetosphere as it can be expected from the low geomagnetic activity mani-festing as stable Sym-H index shown in Figs. 2 and 3 (Ni et al. 2008; Chen et al. 2012). Clear response of the green line emission to the shock prompt compression started instantly at the SI onset time of 09:22:00 UT, which was first illuminated diffuse aurora with fairly uniform luminosity in the southern sky, as shown in
Fig. 4 by an oblique downward black arrow. This arrow in the 09:22:00 UT frame of Fig. 4 points the prelimin-ary and instantaneous brightened diffuse aurora just after the SI onset. Shortly afterwards, it is shown that those intensified uniform diffuse aurora propagated to the high-latitude region expeditiously under continuous compression, and this noticeable brightened diffuse aurora was widespread over the entire sky at 09:23:40 UT (not shown). After reaching its maximum bright-ness at 09:24:30 UT, the diffuse aurora observed near the center of the FOV of the ASI shrank gradually back to the southern portion of the image and propagated eastward with decreasing brightness. This phenomenon evidently indicates that the unstructured diffuse pre-cipitation associated with the inner magnetospheric
wave-particle interaction processes first occurred at lower latitude caused by the shock prompt compres-sion. Thereafter, the poleward boundary of diffuse aur-ora spreads to the higher latitude within very short time period as shown in Fig. 4. Here we used the high photosensitive and spatiotemporal resolution images to detect the diffuse auroral emissions during the shock compression. As a consequence, the response time of the diffuse aurora inferred from those corresponding auroral images is known with an accuracy of ~10 s, i.e., the time resolution that stems from the imaging cadence.
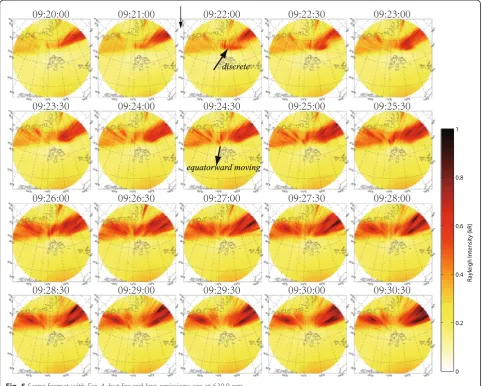
Figure 5 presents the red auroral line emissions at 630.0 nm in the same format as Fig. 4. Before the SI onset marked by the downward black arrow, the aur-oral images display the discrete type aurora in dayside corona elongated in the east-west direction at near the northernmost portion of the FOV, which is the luminous
band and stable structured auroral emission intersect-ing with minor beams of auroral electrons at the edge of the FOV. Compared with sudden brightening and expanding of diffuse aurora to the shock impact shown in Fig. 4, dayside discrete corona’s responding is not so quick and obvious at the preliminary stage of the SI. Initial typical enhancement of auroral luminosity can be seen mainly in the northeast part of the emission band. The gradual variation of the dayside discrete aur-ora was indicated by the oblique black arrow in the third frame of Fig. 5. Actually, the dayside corona of aurora remained a relatively steady narrow luminous band shape during the first two minutes after the SI on-set, apparent variation began at 09:23:50 UT with an auroral form gradually moving equatorward (i.e., sun-ward) from the middle portion of the band (shown by the black arrow) and prominent increased intensity within the FOV. That is to say, two minutes after the SI
onset, the discrete red aurora was intensified noticeably in the ASI images, which leads to a broadening of the latitudinal width of the bright band. The gradual inten-sity increase and sunward expansion of the lower lati-tude boundary of the discrete aurora are significantly different from the abrupt reaction and fast poleward motion of the diffuse aurora at 557.7 nm described above. On the other hand, the brightened structure was also characterized by eastward propagation, especially for the central beam structures of the emission band, meaning the discrete aurora also moved toward the afternoon sector along the auroral oval following its first brightening in the midday sector.
The auroral keogram for the green and red lines, which were created by extracting the pixel column along the geomagnetic north-south meridian from individual all-sky images with 10-s resolution obtained by ASIs at YRS and putting these columns side by side are shown in Fig. 6. The horizontal and vertical axes are universal
time and zenith angle, respectively. Figure 6a shows that the diffuse aurora in the southern sky responds promptly to the shock sudden compression as occurring almost simultaneously with the SI onset at 09:22 UT marked by the red dashed vertical line. The diffuse aurora, mani-festing as a uniform structure, featured instant brighten-ing and subsequent poleward motion marked by the white arrow in Fig. 6a. It is shown that this type of aur-ora soared up a higher latitude within an extremely short time period. By contrast, the dayside band shaped discrete aurora in the higher latitude region shown in Fig. 6b presented an equatorward moving of its lower latitude boundary, which accordingly results in a broad-ening of the auroral oval in the local noon sector. In particular, the poleward boundary of the dayside corona of aurora was almost stable before and after the SI. Overall, the discrete auroral intensity increased during magnetospheric compression, especially in the lower latitude portion close to right zenith of the ASI.
SuperDARN radar observation
The SuperDARN CUTLASS Finland radar at Hankasalmi (63.32° N, 26.61° E), which has good scanning coverage of the ASIs at YRS as shown in Fig. 1, observed the iono-spheric plasma irregularities and associated plasma flow during the shock compression in the midday sector. Figure 7 presents a sequence of three scans from the radar measurements before and after the SI showing, from top to bottom, the backscatter power, the line-of-sight (LOS) velocity and the spectral width. The radar data of the backscatter power are characterized by a loose band of power echoes elongated approximately at geomagnetic lat-itudes of ~78°–83° before the shock arrival; some power echoes on the near range gates were calculated as mainly ground backscatter echoes marked by shaded squares in LOS data. After the SI onset at 09:22:00 UT, the backscat-ter power was obviously enhanced and the echo band was broadened due to more detected wide echoes, especially in the eastern portion of the radar FOV, which roughly
corresponds to the discrete auroral bright spot situated longitudes range from ~120 to ~150 E° at 09:23:00 UT in Fig. 5. It is worth noting that the sharp equatorward edge of the backscatter band moved southward, namely closer to the north of Svalbard. Two minutes later (09:25:00 UT), the intensified echo power in the band spread azi-muthally aligned in the east-west direction. Compared with the power echo data before 09:22:00 UT, the typical eastward plasma irregularities were impressive after the SI onset. Milan et al. (1997) did backscatter occurrence sta-tistics from the CUTLASS radars, they determined that ionospheric backscatter is observed at far ranges during the local day in winter months. Concerning to the present event, the regional distribution of ionospheric backscatter echoes in the cusp region were approximately correlated with the occurrence region of the dayside discrete aurora shown both in Figs. 5 and 6.
In the middle plots of Fig. 7, reddish color represents the plasma flow of ionospheric irregularities away from
a
b
the radar, and the flow toward the radar was denoted by greenish color. The figure at 09:20:00 UT shows that LOS velocity has a sunward component less than 200 m/s in the west part of the FOV and presents weak antisunward flow in the center of the echo band (across the polar cap). After the SI onset, the LOS vel-ocity shows plasma flow with dominantly higher speed \away from the radar (antisunward) in the eastern region, whereas toward the radar (sunward) in the west region. A striking feature of the ionospheric plasma convection in the local noon sector is the enhanced sunward flow just after the shock impact on the terrestrial magnetosphere.
Furthermore, it is indicated that ionospheric plasma irregularity structure propagated eastward under close scrutiny after comparison between scans before and after the SI. At 09:25:00 UT, Fig. 7 shows that the plasma flows were away from the radar both in the eastern and western portion but with noticeable sun-ward flows in center beams.
The Doppler spectral width shown in the bottom panels of Fig. 7 was narrow (<200 m/s) and backscat-ter coverage was poor before the shock arrival, but it became wider (>250 m/s) and extended in latitudinal after the SI onset was triggered by the shock. Figure 7
shows that the latitudinal profiles of Doppler spectral width displays a typical pattern of high spectral widths at high latitudes and low spectral widths at low latitudes. Actually, multi-instrumentation observations showed that the equatorward boundary of the high latitude Doppler spectral width can be interpreted as co-locating with the open-/closed-field line boundary (Milan et al. 1999). Concerning the present SuperDARN observations, the spectral width boundary around ~77°, MLAT is a good proxy for the open/closed-field line boundary, espe-cially when the SuperDARN radar is located around the geomagnetic local noon sector (Chisham et al. 2007). Both enhanced spectral width and its equatorward moving signify that the footprint of the equatorward
boundary of the cusp propagated southward after the sudden shock compression.
Figure 8 presents radar magnetic latitude time plots of backscatter echo power and LOS velocity parameters between 09:00 and 10:00 UT by beams 6 and 11, re-spectively. Before the IP shock arrival to the Earth space, ionospheric backscatter echoes were mainly cor-responding to a narrow latitudinal region between ~78° and ~80° MLAT, while the LOS velocity measurements show weak sunward (antisunward) flow in the western (eastern) portion. Both beam’s observation measured dramatically increased backscatter echoes and power after the SI onset illustrated by the vertical dashed red line. The interesting feature after the shock initial compression is
the sudden appearance of ionospheric plasma irregular-ities from the higher latitude ionosphere, especially typical in observations by beam 11. In addition, the ionospheric plasma convection in the polar cap region presents a high speed flow toward the radar site (circled by the black ellipse), namely sunward flow. This signature of sunward ionospheric convection in the polar cap region is not very common as it departs from the usual dominant flow pattern presenting two convection cells forming an antisunward flow in the polar cap and a return flow at lower latitude.
Results and discussion
The fine structure dayside aurora response to prompt IP shock compression has recently been investigated by, for instance, by Zhou et al. (2009) and Motoba et al. (2014). The auroral response near local noon has been reported using meridian scanning photometer and 30-s ASIs data. Sandholt et al. (1994) firstly revealed that strong and iso-lated enhancements in solar wind dynamic pressure gave rise to equatorward shifts of the cusp/cleft aurora, characteristic auroral transients, and distinct ground magnetic signatures of enhanced ionospheric plasma convection at cusp latitudes. Zhou et al. (2009) studied dayside shock auroral forms and their variations when Svalbard was at ~1120 MLT, and they found that both green and red auroral emissions intensified by a factor larger than 2 within 5 min after the shock arrival to the magnetosphere, equatorward and eastward expanding dif-fuse aurora on closed-field lines and doubled the cusp me-ridional width due to equatorward motion of the low latitude boundary of the cusp.
In the present event, we concentrate on the detailed evolution of the diffuse and discrete aurora by using high temporal and spatial ground-based optical observation and simultaneous ionospheric plasma drift determined with the SuperDARN radar located at Hankasalmi dur-ing the interval followdur-ing the IP shock compression of the magnetosphere. Here we note that ground-based optical aurora and simultaneous ionospheric convection observed during the shock compression under weakly northward IMF conditions differ from previous obser-vational results. Just after the SI onset triggered by the impinging IP shock, fainter and fairly uniform luminos-ity structure of diffuse-type aurora first appeared in the southern sky of the FOV of the ASI. Subsequently, the intensified diffuse aurora propagated poleward exped-itiously, as illustrated in Fig. 4. This instant response of diffuse-type aurora to the impinging IP shock is simi-lar with the immediate geomagnetic field variation shown in Fig. 3. To our knowledge, this southward ini-tial appearance and extreme fast poleward-moving medium-diffuse aurora subsequently in the midday sector associated with shock compression or increased
solar wind dynamic pressure was rarely noticed in re-lated literature, except for the studies of Shi et al. (2012) and (Chen et al. 2012). Moreover, it is found that those diffuse auroras spread across the full FOV of the ASI in a very short time period (~2 min). In addition, concurrent gradual equatorward moving of lower lati-tude boundary of discrete auroral band brightened in the higher latitude region and typical bursts reversed convection in local noon polar cap are another signifi-cant ionospheric dynamical phenomenon within com-pressed magnetosphere.
Diffuse aurora is primarily caused by the precipita-tion of energetic electrons (0.1–30 keV) in the atmos-phere along the magnetic field lines, and occurs over a broad latitude range (Ni et al. 2008; Thorne et al. 2010). Although generally not visible by naked eyes, the diffuse auroral precipitation provides the main en-ergy source for the high-latitude upper atmosphere (Newell et al. 2009). Concerning the present event, the IMF Bz was primarily dominated by positive value
(northward orientation), and the solar wind condition was relatively quiet before the sudden enhancement of the solar wind dynamic pressure indicated in Fig. 2, thus the magnetosphere was nearly undisturbed before the SI onset due to the inefficiency of energy loading from the solar wind to the magnetosphere by compo-nent magnetic reconnection in the low-latitude mag-netopause (Fuselier and Lewis 2011). The extremely faint diffuse-type auroral structure flickering in the southern edge of the FOV of the ASI at YRS shown in Fig. 4 was also a good indicator for the quiet spheric circumstance. We note that when the magneto-sphere was impinged by the IP shock, the magnitude of the geomagnetic field clearly increased at lower latitude (Fig. 3). This can be understood in terms of an en-hancement of the magnetopause current flowing from dawnside to duskside as the compressional wave ap-proaches. It was previously shown that VLF chorus wave activity in the magnetospheric cavity can be trig-gered or see its intensity increased while the energetic electron precipitation is enhanced significantly and rap-idly as well, as a result of the sudden external compres-sion by the IP shock (Gail et al. 1990). Consequently, the wave-particle interaction properties are significantly affected by the magnetic perturbation and plasma varia-tions associated with a shock sudden impact.
cone instability will occur and subsequently result in plasma wave growth, such as whistler mode chorus waves mentioned above. It is known that the increasing instability of plasma wave is capable of causing pitch angle scattering and has the strongest growth at the equator plane (Zhou and Tsurutani 1999). Thus, the waves are the most intense near the equatorial plane. The instability grows after the SI onset and wave-particle interactions subsequently produce abundant electron precipitation. Those electrons entering the loss cone due to the adiabatic compression will pre-cipitate along the geomagnetic field lines into the polar atmosphere and uniformly distribute in large area (Tsurutani et al. 2001). The precipitating particles with enhanced energy flux collide with the atmospheric atoms and molecules, producing unstructured diffuse-type aurora with no sharp structure as shown in Fig. 4. We thus interpret the fast poleward-moving signature presented in Fig. 4 as the result of the onset of ener-getic electron-wide falling, rather than as a material motion.
Ground-based optical aurora observation showed that the interplanetary shock compression caused prominent diffuse aurora responding both in moving feature and increased intensity. The enhanced green aurora was mainly diffuse aurora in the southern sky. It is believed that the bounce periods for energetic electrons and ions of ~1–10 keV between Northern and Southern hemi-spheres at ~75°; MLAT are seconds and minutes, re-spectively (Tsurutani et al. 2001; Zhou et al. 2009). So after compression, preexisting particles should be lost after ~10 s or min (Tsurutani et al. 2001). Here, the op-tical aurora data with very high time resolution at 10 s per image is quite essential for determining the response time of shock aurora. By examining the diffuse auroral sequential images presented here, the response time of the green diffuse aurora at MLT noon to the sudden shock compression as deduced from our optical observa-tion is smaller than 10 s, which is greatly significant for understanding the solar wind-magnetosphere dynamical coupling process under extreme space environment.
The red line emission appearing as discrete elongated auroral band in Fig. 5 shows different spatial and tem-poral variations compared with simultaneous observa-tion of the diffuse-type aurora in green line emission. In this event, the IMF had predominantly a positive Bz
(northward IMF) and minor negative Bycomponent
be-fore the arrival of the shock disturbance structure to the ACE satellite shown in Fig. 2. This kind of IMF condi-tion was corresponding to the unusual optical auroral activity at the higher latitude region (referred as type 2 cusp aurora by (Øieroset et al. 1997)), such as the day-side corona of aurora shown in Fig. 5. Because of the quiet geomagnetic activity due to the smooth solar wind
parameters shown in Fig. 2 before the SI onset, day-side discrete aurora had continuous and steady weak emission over the magnetic latitudinal range from ~78.5° to ~79.8° for a long time, referred to as red aur-oral keogram in Fig. 6b. Just when the fast-moving for-ward shock front arrives, simultaneous IMF Bz had a
minor excursion for a very short interval preceding the following northward IMF. This solar wind disturb-ance propagated to Earth space and triggered clear and enhanced geomagnetic perturbation subsequently denoted by the prompt increased Sym-H index plotted in the bottom panel of Fig. 3.
Figure 5 illustrates that the response of the discrete aurora to the shock compression was a gradual process in either auroral form or emission intensity. From 09:22:00 to 09:23:40 UT, the discrete red aurora in the high-latitude region did not present evident spatial and temporal variation in the main auroral oval compared with the rapid poleward motion of the diffuse aurora in the southern sky just after the SI onset shown in Fig. 4. Just weak enhanced discrete auroral bifurcation formed at eastern part of the emission band during preliminary phase of the SI, which was marked by the black arrow in the frame at 09:22:00 UT. As time went by, noticeable features of the discrete aurora commenced at 09:23:50 UT (under detailed examination, but not shown here) in response to the shock squeezing of the magnetosphere, which was identified as the intruding optical filaments in the central portion of the FOV of the ASI with substan-tial equatorward displacement of the observed structures seen in the auroral 10 s sequential frames. Therefore, the lower latitude edge of the emission band shifted equatorward in the magnetic latitude range from ~78.5° to ~76.9° approximately around 09:30:00 UT. As a reli-able proxy for the polar cap boundary, the poleward boundary of the red emission band did not experience obvious spatial motion during the external compression (Blanchard et al. 1995; Lester et al. 2001). Clearly, the width of the emission band broadens certainly due to the equatorward expansion of the auroral structure ob-served in the lower latitude portion, which appears in Fig. 6b as a variation of the auroral width and an en-hancement of the intensity.
discrete aurora was also observed in the north zenith of the YRS and displayed as rayed sharp beam struc-tures as shown in Fig. 4. A precipitation model, which separately categorizes two types of discrete precipita-tion (monoenergetic and broadband spectra) and both electron and ion diffuse precipitation, was developed by Newell et al. (2009). It allowed a quantitative com-parison between four types of precipitation. The re-sults turn out that the diffuse aurora is surprisingly dominant, constituting 84 % of the energy flux into the ionosphere during conditions of low solar wind driving (63 % electrons, 21 % ions), and is more dynamic, ris-ing rapidly with increasris-ing solar wind drivris-ing. By usris-ing DMSP observation, Newell and Meng (1992) found that soft electron precipitation (0.1–1 keV) dominates discrete aurora, and spectral flux is higher in the closed-field line region. Moreover, it is known that en-hanced wave-particle interaction in equatorial mag-netosphere transiently responds to the external sudden compression (Gail et al. 1990; Shi et al. 2012). There-fore, diffuse aurora is more prominent than discrete aurora in 557.7 nm emission as shown in Fig. 4 just after the external sudden compression.
It is well known that the high-latitude discrete aurora is closely related with the physical processes occurring around the magnetopause where the IMF and terres-trial magnetic field line can reconnect under certain dynamical conditions (Sandholt et al. 1996; Øieroset et al. 1997). Here, a discrete aurora occurred as elon-gated emission band in the far poleward portion of the FOV of the ASI at YRS. Its location corresponds well to the ionospheric backscatter echoes monitored by the SuperDARN radar located at Hankasalmi. Based on the coordinated ground-based optical aurora data at 630.0 nm and equivalent convection maps deduced from magnetometer observations, Sandholt et al. (1996) suggested that the high-latitude discrete aurora situated at ~77°–78°, MLAT corresponds to injections of mag-netosheath plasma associated with magnetic reconnec-tion between the IMF and the lobe magnetic field tailward of the cusp in the high-latitude magnetopause. Concerning the present event, the equatorward-moving auroral filaments close to right zenith of YRS are marked by the oblique white arrow in Fig. 5 was a po-tential signature of lobe reconnection associated with sudden shock squeezing.
Under northward IMF condition, the interplanetary field lines drape over the magnetopause such that the orientation of the IMF is antiparallel to that of the open-lobe field lines tailward of the cusp. Magnetic reconnec-tion takes place between the interplanetary magnetic field line and the geomagnetic field line, and in most cases the result is a field line draped on the dayside magnetopause with one footprint in the Northern or
Southern hemisphere, and a detached field line on the nightside that is eventually carried away by the high speed solar wind stream. A combination of the magnetic tension force on the bent field line and the flow of the solar wind past the Earth results in the footprint of the field line being dragged initially sunward. Since it has remained open, it stays within the region of open field lines within the auroral oval, namely, the polar cap, and does not cross the open/closed-field line boundary (Imber et al. 2006). The field line then slips around the side of the magnetosphere and then is added to the mag-netotail lobe. Therefore, the ionospheric convection pat-tern under northward IMF condition becomes quite complex, consisting of either distorted two cells or mul-tiple cells rather than the common two-cell large-scale circulation pattern with dawn cells in counter-clockwise circulation and reverse polarity circulation in the dusk cell. In the case of a multicell pattern, the flows are ex-pected to form two “reverse” convection cells in the noon sector of the polar cap with clockwise circulation on the prenoon sector and counter-clockwise circulation on the postnoon region, respectively. Correspondingly, plasma that flows across the central polar cap are sun-ward instead of antisunsun-ward.
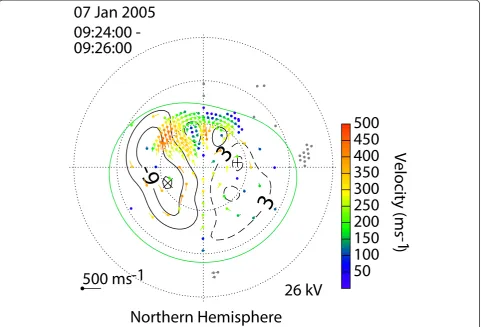
Here, intruding discrete auroral filaments observed after the shock squeezed the magnetosphere should be considered one possible ionospheric signature of the lobe reconnection associated with ionospheric convec-tion variaconvec-tion. Actually, the CUTLASS Finland radar scanning toward the polar cap in the local noon sector detected obvious sunward plasma flow in far range gates after the shock arrival, which was described above and also shown in both Fig. 7 and Fig. 8. Furthermore, much more ionospheric backscatter echoes reflected by plasma irregularities aligned along the geomagnetic field lines were monitored by this radar, and these echoes gradually moved equatorward as seen after a closer scrutiny. To verify whether or not lobe reconnection occurred dur-ing shock compression, we check the global iono-spheric convection pattern obtained from the observed LOS velocities and the component perpendicular to the LOS derived from the ionospheric potential model (Ruohoniemi and Baker 1998). As a powerful tool for monitoring the geospace environment, the SuperDARN radar network enables us to examine the global iono-spheric convection pattern relevant to the evolution of magnetic flux that couples the interplanetary space and the Earth’s magnetosphere-ionosphere system after magnetic reconnection (Chisham et al. 2007; Lester 2008, 2013).
Data are plotted in the altitude-adjusted corrected geo-magnetic (AACGM) coordinates from 60° to 90°MLAT with noon on the top and dawn on the right as viewed above the North Pole such that the Sun is on the top (Baker and Wing 1989). Note that the impressive sig-nature of the convection map consists of four convec-tion cells, with two localized reversed convecconvec-tion cells formed in the dayside polar cap region nested between two normal convection cells at lower latitudes on the dawnside and duskside, respectively. It is clear that the global convection map shows prominent and exact sunward plasma flows in the local noon sector after the shock arrival.
As described above, a two-cell circulation pattern with the dawn cell in counter-clockwise circulation and the dusk cell in clockwise circulation is usually observed by the SuperDARN on the orientation of southward IMF. This kind of ionospheric convection is driven by the dawn-dusk electric field, which is mapped from the mag-netopause and magnetotail into the high-latitude iono-sphere along the conducting and equipotential magnetic field lines. By measuring the motion of this ionospheric plasma, it is, therefore, possible to infer a great deal
about the magnetospheric processes that are responsible for the convection. Concerning the present complex convection pattern with small reversed sub-cells in the cusp region, both the northward IMF and shock disturb-ance are responsible for the formation of the ionospheric convection pattern.
Using global geomagnetic field measurements and real event parametric simulation results, Han et al. (2010) revealed that high-latitude magnetopause re-connection was really triggered by the sudden shock compression, and certainly the reconnection rate was enhanced by the shock compression accordingly. Cor-responding disturbed reconnection electric fields at a higher latitude magnetopause mapped along the geo-magnetic field lines into the polar ionosphere, driving the small sub-cells circulation nested in the cusp. Al-though the IMF component was dominated positive before the shock arrival, the ionospheric convection was relatively stable as well as displayed in Fig. 7. Therefore, the presence of a four convection cells pat-tern in this event is a strong consistent evidence for the occurrence of lobe reconnection along the high-latitude magnetopause tailward of the cusp after the
shock arrival (Crooker 1992; Hu et al. 2006; Lu et al. 2011). In other words, the intensified and equatorward-moving discrete auroral filaments that we observe are the typical optical feature that can be attributed to lobe reconnection occurring along the high-latitude mag-netopause during shock compression. Furthermore, the polar cap size does not change noticeably during the shock compression induced from the stable poleward boundary of discrete red emission band, which is another evidence of lobe reconnection (Cowley and Lockwood 1992; Milan et al. 2003). Hubert et al. (2006) also obtained that the accumulated open flux is closed by intense magnetotail reconnection under strong shock compression, but little flux was closed by these shocks under mostly northward IMF lasting several hours.
Conclusions
A favorable conjunction of the all-sky imager and SuperDARN radar allows us to study the simultaneous aurora and ionospheric response to an interplanetary shock occurring under northward IMF conditions. The specific signature of the diffuse aurora appearing as a uniform structure in the lower latitude region respond-ing to the shock compression is an immediate pole-ward motion just after the SI onset. Nevertheless, the discrete aurora is characterized by a gradual increase of the auroral intensity and a widening of the auroral oval as the magnetosphere is disturbed.
From this special event study, we conclude that: (1 More accurate response time of diffuse aurora to sud-den shock impact was confined within 10 s; (2 Loss cone instability triggered by sudden shock compression and subsequent enhanced wave-particle interaction were responsible for the occurrence and associated evo-lution of diffuse aurora; (3 By coordinated SuperDARN radar measurements, it is confirmed that the intensifi-cation and the equatorward motion of filaments of the discrete aurora was caused by lobe reconnection occur-ring along at a high latitude along the magnetopause during the shock compression; (4 Based on high tem-poral and spatial resolution ground-based imaging data, it is ascertained that the shock-induced aurora is a diffuse-type emission at the lower latitudes of the day-side auroral oval and discrete aurora on the oval with an overlap of the two types of aurora across a few de-grees of latitude.
Competing interests
The authors declare that they have no competing interests.
Authors’contributions
JJL carried out the data presentation for the event and wrote the manuscript. HHQ helped in planning for the design of the study and initial interpretation of the data measurements. DSH made a revision for grammatical written English and gave very a helpful discussion. HGY is the PI
for the all-sky imager system in the Chinese Yellow River Station, providing optical aurora data in this study. ML, who is the PI for CUTLASS Finland radar and the chairman for SuperDARN network, authorized use of HF radar data. All authors read and approved the final manuscript.
Acknowledgements
The authors are grateful to SuperDARN PIs for sharing their data. SuperDARN is a collection of radars funded by national scientific funding agencies of Australia, Canada, China, France, Japan, South Africa, the UK, and the USA. We would like to thank Xiangcai Chen who implemented optical aurora mapping to the MLAT-MLT coordinate system developed from UiO techniques and gave a very helpful discussion. The ACE IMF and solar wind data were provided by CDAWeb service (http://cdaweb.gsfc.nasa.gov). The IMAGE chain magnetometer data were downloaded from the following website: www.ava.fmi.fi/image/, and lower latitude geomagnetic data were obtained from WDC at Kyoto and INTERMAGNET. This work is supported by the National Natural Science Foundation of China (41431072, 41304149, and 41374161), the Polar Environment Comprehensive Investigation and Assessment Programs (CHINARE 2014-02-03), the International Collaboration Supporting Project, Chinese Arctic and Antarctic Administration (IC201303), the Pudong development of scientific and technology program (PKC2013-207), and the project is supported by the Specialized Research Fund for State Key Laboratories. Zhongshan HF radar as a member of SuperDARN is funded by Chinese Meridian Project.
Author details
1
SOA Key Laboratory for Polar Science, Polar Research Institute of China, Shanghai 200136, China.2State Key Laboratory of Space Weather, Chinese
Academy of Science, Beijing 100080, China.3Department of Physics and Astronomy, University of Leicester, Leicester LE1 7RH, UK.
Received: 21 December 2014 Accepted: 8 July 2015
References
Araki T (1994) A physical model of the geomagnetic sudden commencement. in solar wind sources of magnetospheric ultra-low-frequency waves. Geophys Monogr Ser 81:183–200
Baker KB, Wing S (1989) A new magnetic coordinate system for conjugate studies at high latitudes. J Geophys Res 94(A7):9139–9143. doi:10.1029/JA094iA07p09139
Berdichevsky DB, Szabo A, Lepping RP, Viñas AF, Mariani F (2000) Interplanetary fast shocks and associated drivers observed through the 23rd solar minimum by wind over its first 2.5 years. J Geophys Res 105(A12):27289–27314. doi:10.1029/1999JA000367
Blanchard GT, Lyons LR, Samson JC, Rich FJ (1995) Locating the polar cap boundary from observations of 6300 Å auroral emission. J Geophys Res 100(A5):7855–7862. doi:10.1029/94JA02631
Blanchard GT, Lyons LR, Samson JC (1997) Accuracy of using 6300 Å auroral emission to identify the magnetic separatrix on the nightside of Earth. J Geophys Res 102(A5):9697–9703. doi:10.1029/96JA04000
Boudouridis A, Zesta E, Lyons LR, Anderson PC, Lummerzheim D (2003) Effect of solar wind pressure pulses on the size and strength of the auroral oval. J Geophys Res 108(A4):8012. doi:10.1029/2002JA009373
Boudouridis A, Lyons LR, Zesta E, Ruohoniemi JM (2007) Dayside reconnection enhancement resulting from a solar wind dynamic pressure increase. J Geophys Res 112: (A06201). doi:10.1029/2006JA012141
Carlson HC, Egeland A (1995) The aurora and the auroral ionosphere. In: Kivelson MG, Russell CT (eds) Introduction to Space Physics. Cambridge University Press. The Pitt Building, Trumpington Street, Cambridge CB2 1RP Chen X, Han D, Hu Z, Liu J, Hu H, Xing Z, Liu J, Liu R (2012) Dayside diffuse
aurora response to an increase solar wind dynamic pressure. Chin J Polar Res 24(3)
Chisham G, Lester M, Milan SE, Freeman MP, Bristow WA, Grocott A, McWilliams KA, Ruohoniemi JM, Yeoman TK, Dyson PL, Greenwald RA, Kikuchi T, Pinnock M, Rash JPS, Sato N, Sofko GJ, Villain J-P, Walker ADM (2007) A decade of the Super Dual Auroral Radar Network (SuperDARN): scientific achievements, new techniques and future directions. Surv Geophys 28(1):33–109. doi:10.1007/s10712-007-9017-8
26(9):2937–2951. doi:10.5194/angeo-26-2937-2008
Cowley SWH, Lockwood M (1992) Excitation and decay of solar wind-driven flows in the magnetosphere-ionosphere system. Ann Geophys 10:103–115 Crooker NU (1992) Reverse convection. J Geophys Res 97(A12):19363–19372.
doi:10.1029/92JA01532
Frey HU (2007) Localized aurora beyond the auroral oval. Rev Geophys 45: (RG1003). doi:10.1029/2005RG000174
Fuselier SA, Lewis WS (2011) Properties of near-Earth magnetic reconnection from in-situ observations. Space Sci Rev 160(1–4):95–121.
doi:10.1007/s11214-011-9820-x
Fuselier SA, Trattner KJ, Petrinec SM (2000) Cusp observations of high- and low-latitude reconnection for northward interplanetary magnetic field. J Geophys Res 105(A1):253. doi:10.1029/1999ja900422
Gail WB, Inan US, Helliwell RA, Carpenter DL (1990) Characteristics of wave-particle interactions during sudden commencements 1. Ground-based observation. J Geophys Res 95(A1):119–137
Han DS, Yang HG, Liang J, Iyemori T, Cowley SWH, Araki T (2010) High-latitude reconnection effect observed at the dayside dip equator as a precursor of a sudden impulse. J Geophys Res 115(A8), A08214.
doi:10.1029/2009JA014787
Hu H, Yeoman TK, Lester M, Liu R, Yang H, Grocott A (2006) Dayside flow bursts and high-latitude reconnection when the IMF is strongly northward. Ann Geophys 24:2227–2242
Hu ZJ, Yang H, Huang D, Araki T, Sato N, Taguchi M, Seran E, Hu H, Liu R, Zhang B, Han D, Chen Z, Zhang Q, Liang J, Liu S (2009) Synoptic distribution of dayside aurora: multiple-wavelength all-sky observation at Yellow River Station in Ny-Ålesund, Svalbard. J Atmos and Solar Terr Phys 71(8–9):794–804. doi:10.1016/j.jastp.2009.02.010
Hu Z-J, Yang H, Liang J, Han D, Huang D, Hu H, Zhang B, Liu R, Chen Z (2010) The 4-emission-core structure of dayside aurora oval observed by all-sky imager at 557.7 nm in Ny-Ålesund, Svalbard. J Atmos and Solar Terr Phys 72(7–8):638–642. doi:10.1016/j.jastp.2010.03.005
Hu Z-J, Yang H-G, Han D-S, Huang D-H, Zhang B-C, Hu H-Q, Liu R-Y (2012) Dayside auroral emissions controlled by IMF: A survey for dayside auroral excitation at 557.7 and 630.0 nm in Ny-Ålesund, Svalbard.
J Geophys Res 117: (A2). doi:10.1029/2011ja017188
Hubert B, Gérard JC, Fuselier SA, Mende SB (2003) Observation of dayside subauroral proton flashes with the IMAGE-FUV imagers. Geophys Res Lett 30(3):1145. doi:10.1029/2002GL016464
Hubert B, Palmroth M, Laitinen TV, Janhunen P, Milan SE, Grocott A, Cowley SWH, Pulkkinen T, Gérard JC (2006) Compression of the Earth's magnetotail by interplanetary shocks directly drives transient magnetic flux closure. Geophys Res Lett 33(10), L10105. doi:10.1029/2006GL026008
Hubert B, Gérard J-C, Mende SB, Fuselier SA (2013) Statistical properties of dayside subauroral proton flashes observed with IMAGE-FUV. In: Inner Magnetosphere Interactions: New Perspectives from Imaging. American Geophysical Union, pp 195–205. doi:10.1029/159GM15
Imber SM, Milan SE, Hubert B (2006) The auroral and ionospheric flow signatures of dual lobe reconnection. Ann Geophys 24(11):3115–3129.
doi:10.5194/angeo-24-3115-2006
Laundal KM, Østgaard N (2008) Persistent global proton aurora caused by high solar wind dynamic pressure. J Geophys Res 113: (A08231).
doi:10.1029/2008JA013147
Lester M (2008) SuperDARN: an example of a network approach to geospace science in the twenty-first century. J Atmos and Solar Terr Phys 70(18):2309–2323. doi:10.1016/j.jastp.2008.08.003
Lester M (2013) The Super Dual Auroral Radar Network (SuperDARN): an overview of its development and science. Advances in Polar Science 24(1):11. doi:10.3724/sp.j.1085.2013.00001
Lester M, Milan SE, Besser V, Smith R (2001) A case study of HF radar spectra and 630.0 nm auroral emission in the pre-midnight sector. Ann Geophys 19(3):327–339. doi:10.5194/angeo-19-327-2001
Lester M, Chapman PJ, Cowley SWH, Crooks SJ, Davies JA, Hamadyk P, McWilliams KA, Milan SE, Parsons MJ, Payne DB, Thomas EC, Thornhill JD, Wade NM, Yeoman TK, Barnes RJ (2004) Stereo CUTLASS—a new capability for the SuperDARN HF radars. Ann Geophys 22(2):459–473.
doi:10.5194/angeo-22-459-2004
Liu JJ, Hu HQ, Han DS, Araki T, Hu ZJ, Zhang QH, Yang HG, Sato N, Yukimatu AS, Ebihara Y (2011) Decrease of auroral intensity associated with reversal of plasma convection in response to an interplanetary shock as observed over
doi:10.1029/2010JA016156
Liu J, Hu H, Han D, Liu Y, Zhang Q, Yukimatu AS (2013) Optical and SuperDARN radar observations of duskside shock aurora over Zhongshan Station. Adv Polar Sci 24(1):9. doi:10.3724/sp.j.1085.2013.00060
Lu G, Li WH, Raeder J, Deng Y, Rich F, Ober D, Zhang YL, Paxton L, Ruohoniemi JM, Hairston M, Newell P (2011) Reversed two-cell convection in the Northern and Southern hemispheres during northward interplanetary magnetic field. J Geophys Res 116(A12), A12237. doi:10.1029/2011JA017043 Meurant M, Gérard JC, Hubert B, Coumans V, Blockx C, Østgaard N, Mende SB
(2003) Dynamics of global scale electron and proton precipitation induced by a solar wind pressure pulse. Geophys Res Lett 30(20):2032.
doi:10.1029/2003GL018017
Meurant M, Gérard JC, Blockx C, Hubert B, Coumans V (2004) Propagation of electron and proton shock-induced aurora and the role of the interplanetary magnetic field and solar wind. J Geophys Res 109(A10), A10210.
doi:10.1029/2004JA010453
Meurant M, Gérard JC, Blockx C, Coumans V, Hubert B, Connors M, Lyons LR, Donovan E (2005) Comparison of intense nightside shock-induced precipitation and substorm activity. J Geophys Res 110(A7), A07228. doi:10.1029/2004JA010916
Milan SE, Yeoman TK, Lester M, Thomas EC, Jones TB (1997) Initial backscatter occurrence statistics from the CUTLASS HF radars. Ann Geophys 15(6):703–718. doi:10.1007/s00585-997-0703-0
Milan SE, Lester M, Cowley SWH, Moen J, Sandholt PE, Owen CJ (1999) Meridian-scanning photometer, coherent HF radar, and magnetometer observations of the cusp: a case study. Ann Geophys 17(2):159–172.
doi:10.1007/s00585-999-0159-5
Milan SE, Lester M, Cowley SWH, Oksavik K, Brittnacher M, Greenwald RA, Sofko G, Villain J-P (2003) Variations in the polar cap area during two substorm cycles. Ann Geophys 21:1121–1140
Motoba T, Kadokura A, Ebihara Y, Frey HU, Weatherwax AT, Sato N (2009) Simultaneous ground-satellite optical observations of postnoon shock aurora in the Southern Hemisphere. J Geophys Res 114(A7), A07209.
doi:10.1029/2008JA014007
Motoba T, Ebihara Y, Kadokura A, Weatherwax AT (2014) Fine-scale transient arcs seen in a shock aurora. J Geophys Res. doi:10.1002/2014ja020229 Newell PT, Meng C-I (1992) Mapping the dayside ionosphere to the
magnetosphere according to particle precipitation characteristics. Geophys Res Lett 19(6):609–612. doi:10.1029/92GL00404
Newell PT, Sotirelis T, Wing S (2009) Diffuse, monoenergetic, and broadband aurora: the global precipitation budget. J Geophys Res 114(A9), A09207. doi:10.1029/2009JA014326
Ni B, Thorne RM, Shprits YY, Bortnik J (2008) Resonant scattering of plasma sheet electrons by whistler-mode chorus: contribution to diffuse auroral precipitation. Geophys Res Lett 35(11), L11106. doi:10.1029/2008GL034032 Øieroset M, Sandholt PE, Denig WF, Cowley SWH (1997) Northward
interplanetary magnetic field cusp aurora and high-latitude magnetopause reconnection. J Geophys Res 102(A6):11349–11362. doi:10.1029/97JA00559 Ruohoniemi JM, Baker KB (1998) Large-scale imaging of high-latitude convection
with Super Dual Auroral Radar Network HF radar observations. J Geophys Res 103(A9):20797–20811. doi:10.1029/98JA01288
Sandholt PE, Farrugia CJ, Burlaga LF, Holtet JA, Moen J, Lybekk B, Jacobsen B, Opsvik D, Egeland A, Lepping R, Lazarus AJ, Hansen T, Brekke A, Friis-Christensen E (1994) Cusp/cleft auroral activity in relation to solar wind dynamic pressure, interplanetary magnetic field Bz and By. J Geophys Res 99(A9):17323–17342. doi:10.1029/94JA00679
Sandholt PE, Farrugia CJ, Øieroset M, Stauning P, Cowley SWH (1996) Auroral signature of lobe reconnection. Geophys Res Lett 23(14):1725–1728. doi:10.1029/96GL01846
Schwartz SJ (1998) Shock and discontinuity normals, mach numbers, and related parameters. In: Paschmann G, Daly PW (eds) Analysis Methods for Multi-Spacecraft Data. ESA Publications Division Keplerlaan 1, 2200 AG Noordwijk, The Netherlands, pp 249–270
Shi R, Han D, Ni B, Hu ZJ, Zhou C, Gu X (2012) Intensification of dayside diffuse auroral precipitation: contribution of dayside Whistler-mode chorus waves in realistic magnetic fields. Ann Geophys 30(9):1297–1307.
doi:10.5194/angeo-30-1297-2012
Sibeck DG, Borodkova NL, Schwartz SJ, Owen CJ, Kessel R, Kokubun S, Lepping RP, Lin R, Liou K, Luhr H, McEntire RW, Meng C-I, Mukai T, Nemecek Z, Parks G, Phan TD, Romanov SA, Safrankova J, Sauvaud J-A, Singer HJ, Solovyev SI, Szabo A, Takahashi K, Williams DJ, Yumoto K, Zastenker GN (1999) Comprehensive study of the magnetospheric response to a hot flow anomaly. J Geophys Res 104(A3):4577–4593. doi:10.1029/1998ja900021 Thorne RM, Ni B, Tao X, Horne RB, Meredith NP (2010) Scattering by chorus
waves as the dominant cause of diffuse auroral precipitation. Nature 467 (943). doi:10.1038/nature09467
Tsurutani BT, Zhou XY, Arballo JK, Gonzalez WD, Lakhina GS, Vasyliunas V, Pickett JS, Araki T, Yang H, Rostoker G, Hughes TJ, Lepping RP, Berdichevsky D (2001) Auroral zone dayside precipitation during magnetic storm initial phases. J Atmos and Solar Terr Phys 63(5):513–522.
doi:10.1016/S1364-6826(00)00161-9
Wang C, Liu JB, Li H, Huang ZH, Richardson JD, Kan JR (2009) Geospace magnetic field responses to interplanetary shocks. J Geophys Res 114(A5), A05211. doi:10.1029/2008JA013794
Wang C, Li H, Richardson JD, Kan JR (2010) Interplanetary shock characteristics and associated geosynchronous magnetic field variations estimated from sudden impulses observed on the ground. J Geophys Res 115(A9), A09215. doi:10.1029/2009JA014833
Zhang QH, Dunlop MW, Lockwood M, Liu RY, Hu HQ, Yang HG, Hu ZJ, Bogdanova YV, Shen C, Zhang BC, Han DS, Liu SL, McCrea IW, Lester M (2010) Simultaneous observations of reconnection pulses at cluster and their effects on the cusp aurora observed at the Chinese Yellow River Station. J Geophys Res 115(A10), A10237. doi:10.1029/2010JA015526
Zhou X, Tsurutani BT (1999) Rapid intensification and propagation of the dayside aurora: large scale interplanetary pressure pulses (fast shocks).
Geophys Res Lett 26(8):1097–1100. doi:10.1029/1999GL900173 Zhou X-Y, Strangeway RJ, Anderson PC, Sibeck DG, Tsurutani BT, Haerendel G,
Frey HU, Arballo JK (2003) Shock aurora: FAST and DMSP observations. J Geophys Res 108(A4):2156–2202. doi:10.1029/2002JA009701 Zhou XY, Fukui K, Carlson HC, Moen JI, Strangeway RJ (2009) Shock aurora:
ground-based imager observations. J Geophys Res 114(A12), A12216. doi:10.1029/2009JA014186
Submit your manuscript to a
journal and benefi t from:
7 Convenient online submission 7 Rigorous peer review
7 Immediate publication on acceptance 7 Open access: articles freely available online 7 High visibility within the fi eld
7 Retaining the copyright to your article