R E S E A R C H A R T I C L E
Open Access
Costs of vaginal delivery and Caesarean section
at a tertiary level public hospital in Islamabad,
Pakistan
Attia Khan
1*, Shakila Zaman
1,2Abstract
Background:Public hospitals in developing countries, rather than the preventive and primary healthcare sectors, are the major consumers of healthcare resources. Imbalances in rational, equitable and efficient allocation of scarce resources lie in the scarcity of research & information on economic aspects of health care. The objective of this study was to determine the average cost of a spontaneous vaginal delivery and Caesarean section in a tertiary level government hospital in Islamabad, Pakistan and to estimate the out of pocket expenditures to households using these services.
Methods:This hospital based cost accounting cross sectional study determines the average cost of vaginal delivery and Caesarean section from two perspectives, the patient’s and the hospital. From the patient’s
perspective direct and indirect expenditures of 133 post-partum mothers (65 delivered by Caesarean section & 68 by spontaneous vaginal delivery) admitted in the maternity general ward were determined. From the hospital perspective the step down methodology was adopted, capital and recurrent costs were determined from inputs and cost centers.
Results:The average cost for a spontaneous vaginal delivery from the hospital’s side was 40 US$ (2688 rupees) and from the patient’s perspective was 79 US$ (5278 rupees). The average cost for a Caesarean section from the hospital side was 162 US$ (10868 rupees) and 204 US$ (13678 rupees) from the patient’s side. Average monthly household income was 141 ± 87 US$ for spontaneous vaginal delivery and 168 ± 97 US$ for Caesarean section. Three fourth (74%) of households had a monthly income of less than 149 US$ (10000 rupees).
Conclusion:The apparently “free”maternity care at government hospitals involves substantial hidden and
unpredicted costs. The anticipated fear of these unpredicted costs may be major factor for many poor households to seek cheaper alternate maternity healthcare.
Background
Pregnancy a normal, healthy state which most women aspire to at some point in their lives, carries with it ser-ious risks of death and disability [1]. Over half a million young women die every year as a result of complications arising from pregnancy and childbirth [2], most of these deaths occur in the developing world.
Reduction in maternal mortality rates as observed in most high-income countries was achieved by providing access of pregnant women to skilled care during preg-nancy and childbirth and to the guaranteed provision of
safe interventions such as assisted vaginal delivery and Caesarean section [3].
Pakistan with a maternal mortality ratio at 297/ 100,000 live births [4] has seen a slow rise in the pro-portion of pregnant women receiving prenatal care from a skilled health professional increasing from 43% in 2001/02 [5] to 50% in 2004/05 [6] and lately to 61% in 2006-2007 (78% urban and 54% rural women) [7]. But unfortunately 64% of pregnant women (74% rural and 43% urban) in Pakistan still deliver at home [4].
In developing countries public hospitals, rather than the preventive and primary healthcare sectors, are the major consumers of healthcare resources [8]. Local health plan-ners have inadequate knowledge of the costs of the * Correspondence: attiakhan66@gmail.com
1
Health services Academy, Chak Shahzad, Islamabad, Pakistan
healthcare services such as costs of running the in-patient hospital services they render [9,10]. Through technical and allocation efficiency and rational priority settings guided by a sound knowledge of the costs, scarce resources can be used efficiently. A report by Green and Ali [11] dis-cusses two costing studies undertaken in Balochistan (a province in Pakistan) by Ali et al and Ali and Naeem. According to the report, information on costs and expen-ditures of different health facilities and health services in Pakistan needed to base rational decisions on is almost non existent. The application of these research studies was to develop a decentralized budget.
In view of the importance of cost exercises in healthcare management many developing countries, undertook cost-ing studies. For example Vietnam [12] and Argentina [13] used costing studies to measure efficiency and wise alloca-tion of public funds. Costing studies are also useful for countries undergoing health reforms such as decentraliza-tion [14] and hospital autonomy. In India [15] and Kenya [16] cost analysis was an important element in decisions on setting levels of user fees. WHO collated data [17] on unit costs from many hospitals and countries, many coun-tries had absolutely no information on unit costs and stu-dies to determine the costs of maternal health services in developing countries [11,18] were scarce.
Public health environment in Pakistan challenges policy makers to increase the quantity and quality of health ser-vices, but the resources available to improve these services are by and large insufficient. The healthcare budget (0.5% of government expenditure) is far below the 5% recom-mended for developing countries by WHO and the annual incremental budget allocates resources that have little rela-tion with the healthcare needs of the popularela-tion or the requirements of the facility to function efficiently.
The objective of this study is to estimate the average cost of a spontaneous vaginal delivery and a Caesarean section delivery at a tertiary level government hospital. This will provide an insight to hidden and real costs involved in pro-vision of maternal health services by the government and to the households availing these services. Information gained from this study can be used to identify areas where costs could be reduced and where output or productivity could be increased. It may be used as a resource tool for financial management in hospitals and for suggesting mea-sures (example health insurance and premiums) in making maternal healthcare more affordable.
Methods
Study design
The study was a hospital based cost accounting cross sectional study estimating the average cost of sponta-neous vaginal delivery (SVD) and Caesarean section (CS) from the provider (hospital) perspective and the user (patient) perspective.
Duration of the study was from 1stApril 2008 to 30th June 2008
Study area
The study was carried out at a large government Mater-nity and Child Hospital (MCH) located in Islamabad, Pakistan. The hospital, a teaching and general referral hospital provides maternity services to women of the twin cities of Islamabad and Rawalpindi and also the districts of Attock and Nowshera (total population of over 6 million in 1998).
Patient perspective
Sampling technique and size
To estimate the out of pocket expenditure 133 postpartum mothers (68 delivered vaginally and 65 delivered by Cae-sarean section) all Pakistani Asian in origin were inter-viewed at the hospital between 10thApril and 10thMay 2008. Convenience sampling technique was used for selec-tion of interview candidates from the vast variety of obste-tric cases in the general ward as there was a high possibility of not acquiring the required sample within this short duration of the study. All new admissions and all cases to be discharged were identified after major ward rounds (two to three in 24 hours). From these all post par-tum mothers fulfilling the selection criteria (including uncomplicated SVD patients with very short hospital stay) were selected for interview. Patients with a CS or a com-plicated SVD were visited daily and all costs and expendi-tures till their discharge from the ward were noted.
To calculate the sample size the statistical formula to demonstrate a significant difference between two groups by comparing proportions was used [18] at a two sided a value of 0.05 (1.96) and confidence interval of 95% allowing the study power to be 90%. Caesarean section rate varies from 0-40% globally [19] and it was taken as 23% (CS rate was 23.2% in the U.S.A) [20]. Refusal rate very was low at 0.75%.
Sample recruitment
Inclusion criteria
•All post partum mothers delivering at term (36-42 weeks of gestation) either by spontaneous vaginal delivery or Caesarean section
Excluded were post partum mothers
•Admitted in private ward/rooms
•Delivered by instrumental (forceps) vaginal delivery •Exempted from hospital dues
•Not delivered at the hospital but admitted for post partum complications
therefore they were not included in the study. A small proportion of vaginal births/deliveries at the hospital were forceps vaginal deliveries which were excluded from the study as their process and outcome varied from that of spontaneous vaginal delivery.
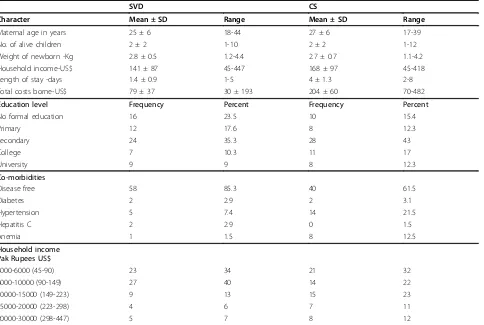
Risk profile of the study groups
There is evidence that a number of maternal, neonatal, clinical, socio-demographic, and economic risk factors are associated with Caesarean section delivery. We mea-sured some of these risk factors in the two study groups (CS and SVD). The variables measured were demo-graphic risk factors such as maternal age, education, parity; clinical risk factors such as maternal co-morbid-ities (diabetes, hypertension, hepatitis B, hepatitis C and anemia); neonatal risk factors such as sex of baby, birth weight of baby and economic risk factors such as socio-economic status of patient (total monthly income).
Cost factors
To estimate the total cost of a delivery (CS or SVD) to a household information on direct and indirect costs such as expenditure on food, transport, drugs, tests, blood transfusion, informal caregiver’s time cost (opportunity cost), hospital dues and informal payments (tips and bribes) was also obtained through interviews.
A pre-tested semi-structured questionnaire was used to interview post partum mothers in the ward. As majority of mothers were no able to provide sufficient details and lacked accuracy on costs and expenditures the help of their husband or a close relative was sought. All relevant expenses till discharge from the hospital were accounted for. Information on expenditures was usually supported with payment receipts provided by husbands and relatives.
Opportunity cost measures how much is“given up”in terms of real cost by carrying out an activity [21]. A more specific term“the informal caregiver’s time cost” used by Islam MK in a WHO publication [22] relates to the cost of time spent in informal care (not paid) by friends and family. Opportunity cost was determined after classifying the work status of the care givers and the patient as salaried work, unemployed or housework. Housework was given a monetary value of 45 US$ (3000 rupees per month) the minimum permissible salary in Pakistan. Unemployment was not given any monetary value. Intangible costs [23] which reflect the patient’s level of pain and suffering and the limitations it imposes on the quality of life are difficult to measure and were not measured in this study.
Provider (hospital) perspective
Three types of methodologies can be employed to calcu-late unit costs, the activity based approach, the top-down approach and the bottom-up approach [24]. To estimate the provider costs the top-down approach was
employed in this study. A tool was developed to gather data on capital and recurrent costs.
The top down approach begins at the top classifying costs as capital and recurrent costs. Capital cost is expenditure on goods which last longer than one year, such as investment in equipment and infrastructure [25]. Recurrent costs or operating costs are costs asso-ciated with the operation or maintenance of facilities or assets.
The main inputs of capital costs were land, building, equipment and vehicles. Data on capital costs was obtained from hospital records and by direct interview of personnel from various hospital departments of finance, administration, engineering works and transpor-tation. The useful life of buildings (70 years), equip-ments and vehicles (10 years) as documented in the hospital records as per government rule was utilized to determine depreciation with time of capital inputs. The average capital cost per SVD and CS was then deter-mined by; cost per bed per day × average length of stay.
Recurrent costs were categorized into three levels of cost centers. (Refer to table 1)
•Unit costs of overhead cost centers;shared services
such as drugs, laundry, administrative costs etc •Unit costs of intermediate cost centers; directly rendered servicessuch as blood bank, laboratory and diagnostics
•Unit costs of final cost centers;personnel services
such as staff salaries
Information on overhead and final cost centers was obtained from the annual budget and expenditure report from the hospital’s account section. Services that came under the intermediate cost centers such as blood bank, and laboratory were not covered by the MCH hospital budget. These services were shared with other depart-ments of the hospital. The information on these services was obtained from the relevant departments. The var-ious activities of doctors and nurses such as time spent in patient care, administrative work and personal time could not be analyzed due to un-willingness of staff to be monitored and the non availability of individualized salary information (Information on staff salaries was accessible only as bulk payments)
Data analysis
weight (1-2.5 kg, 2.6-3, 3.1-3.5, 3.6-4), household income, length of stay, number of living children, total cost of delivery, educational level of mother (no formal education, primary, secondary, college and university), co-morbidities (disease free, diabetes, hypertension, ane-mia, hepatitis C and others) and sex of baby (male vs. female). The number of cases with missing values was very small (1.5%) as compared to the sample size there-fore cases were dropped from analysis on SPSS by list-wise deletion.
Frequencies and descriptive analysis was performed for different variables. Both simple linear regression (SLR) and multiple linear regressions (MLR) were con-ducted using total cost of delivery as dependent variable and length of stay, household income, baby’s weight, age of mother and number of living children as independent variables.
Non parametric bootstrapping technique was applied to generate confidence intervals for cost data. We used the chi-square test to examine the existence of an asso-ciation between mode of delivery (vaginal vs. Caesarean) and educational level of mother, co-morbidities and sex of baby.
Ethical considerations
The study was approved by the ethical committee of Health Services Academy and the government hospital where the study was conducted. Informed verbal con-sent was taken from the mothers.
Results
Overview
The average cost from the hospital’s side for a sponta-neous vaginal delivery was 40 US$ (2688 rupees)and a Caesarean section was 162 US$(10868 rupees)(Refer to table 2). The average cost from the patient’s side of a spontaneous vaginal delivery was 79 US$ (5278 rupees)
and a Caesarean section was 204 US$ (13678 rupees). One US dollar [26] is equivalent to 67 Pakistani rupees (May 2008).
Average cost of delivery; the provider perspective
From January 2007 to January 2008, a total of 10001 births (all modes of deliveries) took place at the hospital. Of the total indoor admissions 80.6% were related to deliveries. During the same year the hospital Caesarean section rate was 25% (remained quite constant through-out the year) and bed occupancy rate was 90%. Accord-ing to hospital statistics average length of stay for a spontaneous vaginal delivery was one day while that of a Caesarean section was four days.
In our study recurrent costs comprised 84% of total costs while capital costs comprised 16% of total cost for both modes of delivery (refer to table 2). The two major inputs of capital costs were medical equipments and building contributing 48% and 45% respectively.
Personnel cost was the largest cost components of total cost and recurrent cost, contributing 35% to the former and 41% to the later. Transfer payments were mainly scholarships to house-officers and postgraduate trainees. On including them in personnel cost, staff sal-aries costs reached a 40% of total cost. Expenditure on drugs & supplies was 8.2% of total costs where as utili-ties (natural gas, electricity and water) took up 16% of total cost.
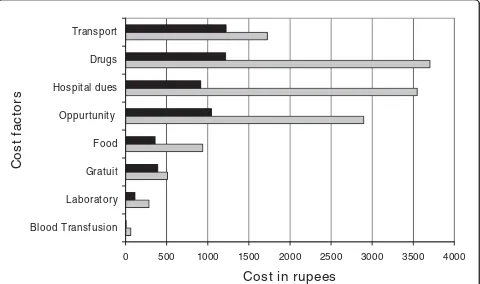
Average cost of delivery; the patient perspective
The two major cost components of spontaneous vaginal delivery were transportation and drugs, each contribut-ing 23% to total cost, whereas drugs (27%) and hospital fees (26%) were the largest cost components of Caesar-ean section. Refer to figure 1.
Profile of post partum mother
Major proportion of mothers (43% of SVD and 35% of CS) was educated up to secondary school level. Illiteracy on the other hand was not as high as expected, though it was comparatively higher in the SVD group at 23% vs.15% in CS group. Majority of mothers from the SVD group 85.3% and 60% of CS group had no associated disease. Hyperten-sion and anemia were the most frequently observed co morbidity in both groups. Hypertension (mostly pregnancy
Table 1 Break up of recurrent costs into cost centers
Overhead cost centers
Shared services
Intermediate cost centersDirectly rendered services Final cost center
Personnel services
Administrative costs Blood bank Officers salary
Transport & travel costs Laboratory Staff salary
Repair & maintenance Diagnostics
Linen, laundry & housekeeping Utilities (gas, electricity, water)
Communication (post, telephone & telegraph Occupancy costs (rent & taxes)
induced) was three times and anemia was eight times more prevalent in the CS group as compared to the SVD group. Refer to table 3.
Pearson chi-square analysis showed a significant asso-ciation of maternal age, co morbidity and number of liv-ing children (parity) with mode of delivery (CS vs. SVD). Strongest association was seen with length of stay (LOS) with P < 0.0001 which was quite obvious.
Simple linear regression analysis revealed that neither baby’s weight, nor maternal age or parity is a significant variable when assessed for total charges. These conclu-sions did not change after other factors were controlled in SLR and stepwise MLR. The final MLR model was significant (P< 0.000) and R2 was 0.681. Length of stay (LOS) and household income remained significantly associated with the final model. The results indicate that the bulk of the variation associated with the total cost of delivery is explained by length of stay in the ward in this model and household income.
Discussion
The average combined patient and provider cost on a SVD is 119 US$ (7966 rupees), 66% of this cost is borne by the patient, while the combined cost on a CS is 366
US$ (24546 rupees), 56% of this cost is borne by the patient.
Affordability
One third (33%) of households from both groups (SVD & CS) earned less than 90 US$ (6000 rupees) per month. Households earning less than 149 US$ (10000 rupees) per month consisted 74% of SVD and 54% of CS. With regard to household income, delivery costs are far beyond the limits of many poor families. To many households the fear of unforeseen expenditures, high direct and indirect payments for a facility based delivery may pose to be a barrier to the use of maternity ser-vices. A similar study by Nahar and Costello [27] esti-mated that 79% of households in Bangladesh did not have enough money to pay for delivery and they had to borrow from friends and relatives.
Imbalance in resource allocation
The major burden of drugs and transport was borne by households for a spontaneous vaginal delivery where as provision of drugs & supplies and paying the hospital dues for a Caesarean section was a challenge for poor households. Kowaleski’s study [28] on maternity services in rural Tanzania similarly reports admission charges, drugs and travel as major costs for households.
Table 2 Capital and recurrent costs
Costs converted to US$ Input cost as % of
Cost category Input cost Annual Hospital Per SVD Per CS Capital/recurr Total Cost
Capital Medical equipment 131411 3 13 48.4 8
Building & commodities 122939 3 119 45 7.4
Bank & consultancy 15308 0.4 1.5 5.7 0.057
Vehicles 1070 0.03 0.1 0.4 0.06
Land 110 0.003 0.01 0.04 0.0007
Total capital 270838 6.6 26.4 100 16.8
Recurrent Personnel 574845 14 56 41 35
Transfer payments 83261 206 8 6 5
Utilities 270561 7 27 19.5 16
Drugs 135284 3 13 9.7 8.2
Occupancy 103162 2.5 10 7.4 6.3
Administration 51162 1.3 5 3.7 3
Repair & maintenance 35051 0.9 3.4 2.5 2.1
Blood bank 180187 0.6 3.4 2.5 1.5-2.0
Plant purchases 30746 0.7 3 2.1 1.9
Communication 26442 0.6 2.6 1.8 1.6
Transport 14447 0.4 1.4 1 0.9
Laboratory 223881 0.3 1.5 1 0.6-0.9
Housekeeping etc 11930 0.3 1.2 0.9 0.7
Training 5780 0.1 0.6 0.4 0.3
Total recurrent 1341165 34 136 100 83.2
Recurrent costs were the major costs (84%) from the provider/hospital side. Of the total cost (capital and recur-rent) 40% was spent on staff salaries and a meager amount of 8.2% was spent on purchase of drugs & supplies (an imbalance in resource allocation is evident). Studies from India [8], Zimbabwe [14] (Plaetse) and Argentina [13] (Borghi) gave variable results, 54%, 61.48% and 88-90% of total cost was spent on staff salaries.
According to a World Bank [29] report the cost of a normal vaginal delivery at a hospital in poor countries of Africa and Latin America ranges from US$ 10-35 and a Caesarean or a complicated vaginal delivery can cost from US$ 50-100. The average cost of a SVD (40 US$ or 2688 rupees) and a CS (162 US$ or 10868 rupees) in our study was substantially higher than other poor countries of Africa and Latin America but more com-parable to results from regional studies from Bangladesh [27] (year 1995, SVD: US$ 31.9 and CS: 123 US$ from patient perspective) and India [15] (SVD; 8215 rupees and CS; 7012 rupees).
Higher costs in our study could be accounted for as a regional variation or due to rapidly rising cost of mater-nity healthcare over the years.
Risk profiles
Maternal age, higher education and co morbidity were directly associated with Caesarean section in this study.
In a study from Tabriz [30] higher level of education, maternal age and socioeconomic status were associated with Caesarean section. A cohort study from England [31] revealed that increasing maternal age, diabetes mel-litus, neonatal birth weight and head circumference were associated with an increased risk of a CS while increasing parity was associated with a decreased risk of CS. A cross sectional study from Beirut [32] identified gestational age, multiple gestations, number of previous deliveries, time and date of delivery and site of antenatal care (private vs. public) to be related to increase in CS rate.
Study limitations
Precise costing of time for activities (patient care, administrative work and personal time) of health care workers such as doctors and nurses in the hospital could not be performed due to unwillingness of staff to be monitored and due to non-availability of individua-lized salary data. There was some limitation of quality of the cost data on services that were shared amongst patients in MCH and patients from other departments of the main hospital. These shared services included the blood bank and laboratory (pathology, biochemistry etc). Record of budget and expenditure on these services was available but accurate data on number of maternity patients taking the tests and the number and kinds of
0 500 1000 1500 2000 2500 3000 3500 4000
Blood Transfusion Laboratory Gratuit Food Oppurtunity Hospital dues Drugs Transport
C
o
st fa
ctor
s
Cost in rupees
tests taken by each maternity patient was not documen-ted in a manner to fulfill the requirements of the study.
Another limitation of our study was the inability to interview a small number of patients arriving during the night for an uncomplicated vaginal delivery and leaving the hospital before the morning ward round (leave against medical advice). On examining such patient’s files the treatment provided to them was not any differ-ent from patidiffer-ents that stayed a few hours longer to be properly discharged after the morning ward round.
The costs of delivery in our study are representative of costs at tertiary level public hospitals but may not be representative of costs in rural or semi-urban settings, at primary & secondary healthcare level nor is it represen-tative of deliveries in the private sector.
There is a possibility that costs of Caesarean section may have been underestimated as some aspects such as peri-natal, natal and post natal risks and outcome, increased risk of placenta preavia and elective Caesarean section have not been covered. A study on a larger scale with a wider time zone is required to cover all aspects of Caesarean section and its associated costs.
Conclusion
Despite of the 10000 annual births, the 90% bed occu-pancy and the high bed turnover, costs of vaginal deliv-ery and Caesarean section in a tertiary level public hospital in Islamabad city are substantially higher than other studies in other developing countries. Regardless of maternity healthcare being subsidized by the govern-ment, the costs of a delivery whether be it a vaginal delivery or a Caesarean section is far beyond the limits of three fourth of households in Pakistan. Effective methods of health insurance tailored to the local needs should be introduced to make maternal healthcare more affordable to the poor and average households.
Abbreviations
CS: Caesarian section; SPSS: Statistical Program for Social Sciences; SVD: Spontaneous vaginal delivery; U.S.A: United States of America; W.H.O: World Health Organization; SLR: Simple linear regression; MLR: Multiple linear regression; LOS: Length of stay; MCH: Maternal and Child Health
Acknowledgements
We are indebted to the doctors and staff at Health Services Academy for their contribution and to Professor Dr Ghazala Mahmood, her obstetric team and the administrative staff for facilitating our study at the MCH Centre.
Table 3 Profile of study groups: SVD and CS
SVD CS
Character Mean ± SD Range Mean ± SD Range
Maternal age in years 25 ± 6 18-44 27 ± 6 17-39
No. of alive children 2 ± 2 1-10 2 ± 2 1-12
Weight of newborn -Kg 2.8 ± 0.5 1.2-4.4 2.7 ± 0.7 1.1-4.2
Household income-US$ 141 ± 87 45-447 168 ± 97 45-418
Length of stay -days 1.4 ± 0.9 1-5 4 ± 1.3 2-8
Total costs borne-US$ 79 ± 37 30 ± 193 204 ± 60 70-482
Education level Frequency Percent Frequency Percent
No formal education 16 23.5 10 15.4
Primary 12 17.6 8 12.3
Secondary 24 35.3 28 43
College 7 10.3 11 17
University 9 9 8 12.3
Co-morbidities
Disease free 58 85.3 40 61.5
Diabetes 2 2.9 2 3.1
Hypertension 5 7.4 14 21.5
Hepatitis C 2 2.9 0 1.5
Anemia 1 1.5 8 12.5
Household income Pak Rupees US$
3000-6000 (45-90) 23 34 21 32
6000-10000 (90-149) 27 40 14 22
10000-15000 (149-223) 9 13 15 23
15000-20000 (223-298) 4 6 7 11
This study was funded by United Nations Population Fund (UNFPA) provided by Health Services Academy.
Author details
1
Health services Academy, Chak Shahzad, Islamabad, Pakistan.2Institute of Public Health, Lahore, Pakistan.
Authors’contributions
AK proposed the study, contributed to acquisition, analyses and interpretation of data and drafted the manuscript. SZ supervised the study design, statistical analysis and critical review of important intellectual content of the manuscript. All authors read and approved the final manuscript.
Competing interests
The authors declare that they have no competing interests.
Received: 5 December 2008
Accepted: 20 January 2010 Published: 20 January 2010
References
1. Reduction of maternal mortality. WHO ReportA joint WHO/UNFPA/ UNICEF/World Bank Statement. Geneva, Switzerland 1999.
2. Maternal Mortality in 2000. Report, Estimates developed by WHO, UNICEF and UNFPA2004http://whqlibdoc.who.int/publications/2004/9241562706. pdf.
3. Loudon I:Childbirth.Western medicine: An illustrated historyOxford: Oxford University PressLoudon I 1997, 206-20.
4. Farid M, Jaferey AN, Ahsan A, Sheraz A:Adult and maternal mortality.
Pakistan Demographic and Health Survey 2006-2007NIPS, USAID. Islamabad (Pakistan): Crystal Printers 2008, 167-81.
5. Making Pregnancy Safer Statistics in the Eastern Mediterranean Region-2001. WHO-EMRO-Reproductive Health Research Network (RHRN)http:// www.emro.who.int/MPS/statistics_2001.htm.
6. Federal Bureau of Statistics:Pakistan Demographic Survey 2005http://www. statpak.gov.pk/depts/fbs/statistics/pds2005/pds2005report.pdf.
7. Zafar R, Cross A:Reproductive Health.Pakistan Demographic and Health Survey 2006-2007NIPS, USAID. Islamabad (Pakistan): Crystal Printers 2008, 101-22.
8. Tabish SA, Mustaffa A, Rangrez RA:Hospital Accounting Based Cost Studies: Indian Experience.J Academy of Hospital Administration2005, 13(1):1-6.
9. Olukoga A:Unit cost of inpatient days in district hospitals in South Africa.Singapore Medical Journal2007,48(2):143-7.
10. Oostenbrink JB, Woude Van der TB, van Agthoven M, Koopmanschap MA, Rutten FF:Unit costs of inpatient hospital days.Pharmacoeconomics2003, 21:263-71.
11. Green A, Naeem A, Vassall A:Using costing as a planning and management tool in Balochistan. Pakistan.Health policy and planning
2001,16(2):180-6.
12. Flessa S, Dung NT:Costing of services of Vietnamese hospitals: identifying costs in one central, two provincial and two district hospitals using a standard methodology.Int J Health Plan Manag2004,19(1):63-77. 13. Borghi J, Bastus S, Belizan M, Carroli G, Hutton G, Fox-Rushby J:Costs of
publicly provided maternity services in Rosario, Argentina.Salud pública Méx Cuernavaca2003,45(1).
14. Plaetse BV, Hlatiwayo G, Luk , Eygen VL, Meessen B, Criel B:Costs and revenue of health care in a rural Zimbabwean district.Health Policy Plan
2005,20(4):243-51.
15. Satapathy DM, Panda R, Das BC:Cost Factors Related with Normal Vaginal Delivery and Caesarean Section in Government and Non-Government Settings.Indian J Comm Med2005,30(2):66-7.
16. Hodgkin D:Household characteristics affecting where mothers deliver in rural Kenya.1996,5(4):333-40.
17. Adam T, Evans DB, Murray CJ:Econometric estimation of country-specific hospital costs.Cost Eff Resour Alloc2003,1(1):3.
18. Conteh L, Walker D:Cost and unit cost calculations using step-down accounting.Health Policy Plan2004,19:127-35.
19. Calculation of required sample size. Medical statisticsMassachusetts (U.S. A): Blackwell PublishingsKirkwood BR, Sterne JAC , 2 2003, 420-1.
20. Sufang G, Sabu S, Padmadas , Fengmin Z, Brown JJ, Stones RW:Delivery settings and caesarean section rates in China.Bulletin of the World Health Organization2007,85(10):733-820.
21. Jiang HJ, Elixhauser A, Nicholas J, Steiner C, Reyes C, Bierman AS:Care of women in U.S Hospitals 2000.A health care and utilization project Fact book no3Agency for Healthcare Research and Quality 2002, Pub No.02-0044.
22. Glossary of statistical terms. Out of pocket expenditure by households in healthOECDhttp://stats.oecd.org/glossary/detail.asp?ID=1967.
23. Islam MK, Gerdtham UG:The costs of maternal-newborn illness and mortality: Issues in the estimation of cost of illness.Maternal, newborn health and povertyWorld Health Organization 2006.
24. Mogyorosy Z, Smith P:The main methodological issues in costing health care services. A literature review.CHE Research Paper 7: Center of health economicsYork, U.K: University of York 2005http://www.york.ac.uk/inst/che/ pdf/rp7.pdf.
25. Witter S, Ensor T, Jowet M, Thompson R, editors:Glosssary of common health economic terms: Health economics for developing countries.A practical guideLondon Macmillan Education Ltd 2000, 268-88. 26. Forex rates in Pakistan:http://www.forex.pk/currency-converter.php. 27. Nahar S, Costello A:The hidden cost of‘free’maternity care in Dhaka,
Bangladesh.Health Policy Plan1998,13(4):417-22.
28. Kowalewski M, Mujinja P, Jahn A:Can mothers afford maternal health care costs? User costs of maternity services in rural Tanzania.Afr J Reprod Health2002,6(1):65-73.
29. Epp J:Cost of Maternal care.Open document: World Bank, wbln0018. worldbank.org/HDNet/hddocs.nsf/0/0f35c0011d0ce65785256a8d00625616? Open Document - 14k.
30. Mohammadpoorasla A, Rostami F, Torabi SS:Prevalance of Caesarean section and its demographic correlates in Tabriz.Med J of Tabriz university 2006,28(3), Autumn;.
31. Patel RP, Peters TJ, Murphy DJ:Prenatal risk factors for Caesarean section. Analyses of the ALSPAC cohort of 12 944 women in England.Int J Epp
2005,34(2):353-67.
32. Kassak KM, Mohammad A, Abdallah AM:Opting for a Caesarean: what determines the decision.Pub Admin & Manag13(3):100-22.
Pre-publication history
The pre-publication history for this paper can be accessed here:http://www. biomedcentral.com/1471-2393/10/2/prepub
doi:10.1186/1471-2393-10-2
Cite this article as:Khan and Zaman:Costs of vaginal delivery and
Caesarean section at a tertiary level public hospital in Islamabad, Pakistan.BMC Pregnancy and Childbirth201010:2.
Submit your next manuscript to BioMed Central and take full advantage of:
• Convenient online submission
• Thorough peer review
• No space constraints or color figure charges
• Immediate publication on acceptance
• Inclusion in PubMed, CAS, Scopus and Google Scholar
• Research which is freely available for redistribution