Open Access
Proceedings
Effects on linkage analyses of different Affymetrix expression
measures as quantitative trait phenotypes
Juan Manuel Peralta*
1,2and Laura Almasy
2Address: 1Centro de Investigación en Biología Celular y Molecular, Universidad de Costa Rica, Ciudad Universitaria Rodrigo Facio, 2060, San José,
Costa Rica and 2Department of Genetics, Southwest Foundation for Biomedical Research, P.O. Box 760549, San Antonio, Texas 78245-0549, USA
Email: Juan Manuel Peralta* - [email protected]; Laura Almasy - [email protected] * Corresponding author
Abstract
We compared results from linkage analyses of different phenotype measurements from the same gene expression traits and found that the strongest signals were detected by all expression measures that we considered. On average, that meant that the same quantitative trait loci (QTLs) were detected across methods, but the magnitude of the LOD score of each particular QTL and the false-positive ratio of QTL detection varied between the methods.
Background
The Affymetrix GeneChip® is a very popular microarray
system that is widely used by researchers in the biomedi-cal field. A variety of statistibiomedi-cal methods has been devel-oped to obtain gene expression data from it. Robust multiarray average (RMA) [1], GeneChip RMA (GCRMA) [2], Microarray Suite Analysis (MAS5) [3] and dChip [4] are four commonly used gene expression measures that differ in their approach to background correction, nor-malization, and summarization of probe intensity.
As a consequence of such diversity, researchers have sought the best method for a given application, often driven by the comparison of their performance under spe-cific conditions. Many studies have investigated the effects that different methods of obtaining expression values may have on the selection of differentially expressed genes or sequences from Affymetrix arrays. As noted by Irizarry et al. [5], conflicting results are often reported, making it
dif-ficult to identify the best expression measure for a given application. It would be logical to expect that regardless of the expression measure employed, the conclusions reached about the differential expression of the genes would be similar. Millenaar et al. [6] provided evidence showing that the reality is not quite so. They found less than 40% agreement in the selection of differentially expressed genes when comparing six different expression measures.
While Irrizry et al. and Millenaar et al. provide bench-marking and performance clues for several expression measures, both are focused on the use of expression val-ues to identify differentially expressed genes under exper-imental conditions. The recent works of Cheung et al. [7,8] and Morley et al. [9] have introduced a new applica-tion of gene expression arrays with the novel use of expression values as quantitative trait phenotypes. This raises concerns about the behavior and possible effects
from Genetic Analysis Workshop 15
St. Pete Beach, Florida, USA. 11–15 November 2006
Published: 18 December 2007
BMC Proceedings 2007, 1(Suppl 1):S158
<supplement> <title> <p>Genetic Analysis Workshop 15: Gene Expression Analysis and Approaches to Detecting Multiple Functional Loci</p> </title> <editor>Heather J Cordell, Mariza de Andrade, Marie-Claude Babron, Christopher W Bartlett, Joseph Beyene, Heike Bickeböller, Robert Culverhouse, Adrienne Cupples, E Warwick Daw, Josée Dupuis, Catherine T Falk, Saurabh Ghosh, Katrina A Goddard, Ellen L Goode, Elizabeth R Hauser, Lisa J Martin, Maria Martinez, Kari E North, Nancy L Saccone, Silke Schmidt, William Tapper, Duncan Thomas, David Tritchler, Veronica J Vieland, Ellen M Wijsman, Marsha A Wilcox, John S Witte, Qiong Yang, Andreas Ziegler, Laura Almasy and Jean W MacCluer</editor> <note>Proceedings</note> <url>http://www.biomedcentral.com/content/pdf/1753-6561-1-S1-info.pdf</url> </supplement>
This article is available from: http://www.biomedcentral.com/1753-6561/1/S1/S158
© 2007 Peralta and Almasy; licensee BioMed Central Ltd.
that the choice of a particular expression measure might have on downstream analyses such as heritability esti-mates and linkage. The data from Morley et al. [9] availa-ble in Proavaila-blem 1 of Genetic Analysis Workshop 15 (GAW15) provide a convenient way to explore some of those concerns.
We were particularly interested in knowing whether the linkage signals detected by using phenotypes derived from a particular expression measure would still be present if other expression measures were to be used. This can be approached in several ways [10]. In this work we took a results-oriented look at how well overall conclusions from linkage results derived from phenotypes calculated from one expression measure stand up when other expression measures are used. To that end, we compared the linkage results from an analysis of some of the phenotypes used by Morley et al., with the results derived from four com-monly used gene expression measures.
Methods
The GAW15 Problem 1 (P1) data set was used by this study [11]. Immortalized B cell gene expression data of 8793 probe sets (probes) from each of 276 GeneChip®
Human Genome Focus Arrays was available for 193 indi-viduals (56 founders) of 14 three-generation Centre d'Etude du Polymorphisme Humain families. Quantita-tive trait phenotypes derived from the 3554 probes with the most variable expression phenotypes identified by Morley et al. (P1QP) were also provided for 194 individ-uals.
RMA, GCRMA, MAS5, and two dChip gene expression val-ues (DCHIPPM: only perfect-match probe data from each array was used for background correction; DCHIPMM: mismatch probe data was subtracted from perfect-match data during background correction) were estimated and log2-transformed with Bioconductor [12]. The duplicate arrays that were available for some individuals (n = 82) were not used.
As described by McClintick et al. [13], three probes with very strong sex-specific expression were found: 214218_s_at (female), 205000_at and 206700_s_at (male). Their expression values were in disagreement with the specified genders of individuals 1421–8 (male) and 1421–14 (female). The arrays and P1QP of those two individuals were excluded from analyses.
Heritabilities of all P1QP traits were estimated with SOLAR [14], using the tdist adjustment, which allows for the robust estimation of the mean and variance from a trait when its distribution deviates from multivariate nor-mality. The significance of each heritability estimate was then subjected to the family-wise type I error rate (FWER)
adjustment of Sidak [15]. All probes from P1QP with her-itabilities ≥ 0.5 and a FWER p-value ≤ 0.05 were selected as the quantitative traits for linkage.
The expression values of the selected traits defined the RMAQP, GCRMAQP, MAS5QP, DCHIPPMQP, and DCHIPMMQP phenotype sets according to the expression measure from which they originated. The phenotypes of the selected traits from P1QP were used as a baseline for heritability and LOD score comparisons (REFQP). Note that REFQP and MAS5QP should be highly correlated because both were derived from MAS5 expression values.
In addition, a "false-positive set" of phenotypes was derived from the phenotype sets described above (the "real-linkage set"). In order to preserve the heritability structure of the real phenotype sets, and since Hinrichs et al. [16] found a high intraclass correlation between the sib phenotypes, phenotypes were randomly swapped between whole families by shuffling the family identifiers of each individual, keeping the same generational hierar-chy intact.
A genetic map for linkage analyses was derived from the P1 physical map using the single-nucleotide polymor-phism (SNP) Mapping web application at the University College of Dublin (UCD) Conway Institute of Biomolecu-lar and Biomedical Research [17]; eight markers not mapped by it were linearly interpolated. Mendelian inher-itance inconsistencies and double-recombinant geno-types were blanked from the P1 SNP genogeno-types according to mistyping probabilities from Simwalk [18]. Multipoint IBD matrices for all 2882 autosomal and X-linked SNP markers were constructed with Merlin [19] and Merlin's minx.
Heritability and linkage analyses of the selected quantita-tive traits and phenotypes of all 14 families were per-formed with SOLAR, using the tdist adjustment and sex as the only covariable. LOD scores were calculated at 5-cM intervals along the 22 autosomes and the X chromosome, and at 1-cM intervals around signals ≥ 2.
probe (regardless of the length of the region). For trans
linkages, the signals did not include the location of the trait's probe. Note that this is a different definition than the one used by Morley et al.
Results
Eighty-two probes with h2 ≥ 0.5 in P1QP were selected as
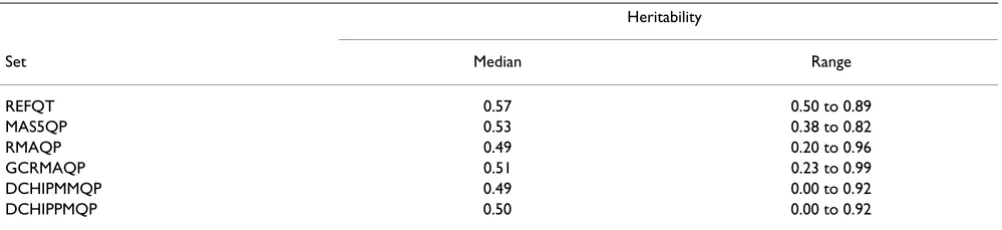
the quantitative traits analyzed by this study. There was good agreement between heritabilities of the real-linkage set and of the false-positive set, suggesting that the herita-bility structure was indeed preserved in the false-positive set. The median heritability estimates of the traits from all the phenotype sets were close to the selection threshold of 0.5 ≤h2 (Table 1). Phenotype sets derived from related
expression measures showed similar ranges of variation and were more correlated with each other (Pearson's
rREFQP-MAS5QP = 0.68, rRMAQP-GCRMAQP = 0.88, r DCHIPMM-DCHIPPM = 0.86) than with the other phenotype sets (data
not shown). While REFQP and MAS5QP are both MAS5 expression values, different procedures were used to gen-erate them, which explains the lower correlation between their heritabilities. For the same reason, MASQP was more correlated with RMAQP, GCRMAQP, DCHIPMM, and DCHIPPM than REFQP was (data not shown).
All false-positive linkages were trans linkages, regardless of the threshold used, with the exception of one cis linkage observed for a MAS5-derived phenotype (Table 2). The median number of false QTLs detected was 48 for LOD ≥ 3 and 1.5 for LOD ≥ 5. A very strong correlation between
the mean false-positive LOD and the number of false cis (r
= 0.986, p = 3 × 10⁻⁴) and trans (r = 0.956, p = 3 × 10⁻³)
QTLs was found. MAS5QP showed a considerable depar-ture from the median number of false QTLs because it gave higher false-positive LOD scores.
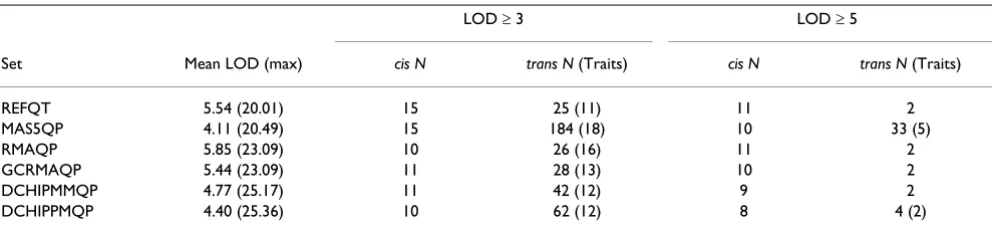
For the real-linkage set the number of observed trans QTLs was almost two times the number of cis QTLs, at a thresh-old of three (Table 3). There was no significant correlation between either the mean LOD and the number of cis (r = -0.214, p = 0.68), or the number of trans (r = -0.789, p = 0.06) QTLs. However, increasing the threshold to LOD ≥ 5 lead to the reverse situation, where cis QTLs were almost five times more frequent than trans QTLs. The correlation with the mean LOD remained non-significant for number of cis (r = -0.699, p = 0.12) and trans (r = -0.676, p = 0.14) QTLs. The maximum LOD score observed was similar between phenotypes from related expression measures (Table 3).
Each cis QTL detected in a phenotype set was from a dif-ferent trait at both thresholds, but more than one trans
QTL was detected for the same trait only at the lowest threshold (with the exception of MAS5QP and DCHIPPM). Almost all cis QTLs detected at LOD ≥ 3 had a LOD ≥ 5, while approximately a tenth of the trans QTLs did. Figure 1 gives a graphical representation of the con-cordance rates between the methods, and it can be seen that there is much better agreement between them at the higher threshold of LOD ≥ 5.
Table 2: Summary of false-positive cis/trans linkage results (N, number of QTLs)
LOD ≥ 2 LOD ≥ 3 LOD ≥ 4 LOD ≥ 5 LOD ≥ 6
Set Mean LOD (max) cis trans cis trans trans trans trans
REFQT 3.44 (5.91) 1 196(52) 44 (16) 2(2) 2 (2)
MAS5QP 3.74 (7.18) 3(2) 551(57) 1 215 (26) 110(3) 41 (2) 7(1)
RMAQP 3.46 (5.33) 1 223(59) 34 (20) 4(3) 1
GCRMAQP 3.45 (5.36) 1 183(54) 27 (13) 5(5) 1
DCHIPMMQP 3.51 (5.17) 214(53) 52 (17) 11(5) 1
DCHIPPMQP 3.55 (5.89) 302(51) 96 (17) 17(3) 6 (1)
Table 1: Distribution of the heritabilities
Heritability
Set Median Range
REFQT 0.57 0.50 to 0.89
MAS5QP 0.53 0.38 to 0.82
RMAQP 0.49 0.20 to 0.96
GCRMAQP 0.51 0.23 to 0.99
DCHIPMMQP 0.49 0.00 to 0.92
The magnitude of detected cis and trans QTLs from all phenotype sets is contrasted with their corresponding magnitude in the reference phenotype set, REFQP, in Fig-ure 2. While most of the cis QTLs are being detected in all the phenotype sets, their LOD score magnitude changes. Note, however, that cis QTLs from MAS5QP match closely the magnitude of those from REFQP. The situation is dif-ferent for trans QTLs because a large proportion (91%) of MAS5 trans QTLs were not detected in REFQP. A large number (84%) of REFQP trans QTLs were not detected by DCHIPPM. Conversely, few (3%) DCHIPPM trans QTLs were detected in REFQP.
Discussion
We performed linkage analyses with different phenotype measurements of the same group of expression traits and detected several QTLs. Because true QTLs are not known for any of the traits in the original data, we can not address certain issues that are of interest, such as how different expression measures affect the power to detect QTLs. However, we were able to gain some insight on other equally interesting effects that the differently pre-proc-essed expression phenotypes had.
For instance, we examined the false-positive rate of QTL detection, based on two LOD score magnitude thresholds, and found a large amount of variation between expression measures. GCRMA was the method that had fewest false positives; MAS5 had the most. Close examination of MAS5QP false positives showed that they were the result of the fluctuation of the LOD score curve – around the threshold used – over the span of many centimorgans. This tended to break related signals as separate QTLs. Examination of three additional thresholds (at LOD ≥ 2, 4 and 6, Table 2) seems to indicate that this phenomenon is not a threshold-induced artifact and suggests that it might be a consequence of the higher magnitude of MAS5QP false-positive LOD scores. However, REFQP – also MAS5 derived phenotypes – did not perform as poorly as MAS5QP, although their phenotypes were not exactly the same. It is likely that differences in the proce-dure used to construct them – use or not of duplicate arrays – and other quality control steps are the cause of
Venn diagrams [20] that show the intersections of the sets of QTLs detected by each expression measure for the LOD ≥ 3 (top, N = 306) and LOD ≥ 5 (bottom, N = 52) thresholds Figure 1
Venn diagrams [20] that show the intersections of the sets of QTLs detected by each expression meas-ure for the LOD ≥ 3 (top, N = 306) and LOD ≥ 5 (bot-tom, N = 52) thresholds. The size of each circle is proportional to the number of QTLs detected (but the two figures are not in the same scale). The area in yellow repre-sents the number of QTLs detected by all the six methods: 3% (n = 9) for LOD ≥ 3 and 10% (n = 5) for LOD ≥ 5.
Table 3: Summary of cis/trans real-linkage results (N, number of QTLs)
LOD ≥ 3 LOD ≥ 5
Set Mean LOD (max) cis N trans N (Traits) cis N trans N (Traits)
REFQT 5.54 (20.01) 15 25 (11) 11 2
MAS5QP 4.11 (20.49) 15 184 (18) 10 33 (5)
RMAQP 5.85 (23.09) 10 26 (16) 11 2
GCRMAQP 5.44 (23.09) 11 28 (13) 10 2
DCHIPMMQP 4.77 (25.17) 11 42 (12) 9 2
their different false-positive behavior. If that is the case, then it might mean that RMAQP, GCRMAQP, DCHIPMM, and DCHIPPM are more robust to the effects of random noise because they were subjected to exactly the same quality control and sampling as MAS5QP but gave considerably lower false positives.
Strong linkage signals appeared independently of the expression measure used to define the phenotype. That meant, on average, that the same QTLs tended to be detected by all measures (Figure 1). Yet, there were large – and apparently non-systematic – between-measure differ-ences in the magnitude of the LOD scores observed for any particular QTL. We do not have an explanation of this phenomenon. However, from a practical point of view, the variation in LOD score magnitude is less of a concern for the strongest signals because the QTLs associated with them are likely to be detected, regardless of the expression measure used, with a reasonable threshold.
There was greater agreement across expression measures for cis QTLs than for trans QTLs. Because it is likely that cis
QTLs are characterized by a stronger genetic effect, this is not a surprise [9]. On the other hand, trans QTLs were much more in disagreement across measures. They
showed a tendency to give weaker signals, possibly because of their smaller genetic effects or because they are more likely to be false positives. That mostly all false-pos-itives were trans QTLs would seem to support this notion.
Conclusion
Our results suggest that, for QTLs of large effect sizes, the choosing of one gene expression measure as a quantitative phenotype is not likely to have profound repercussions in the conclusions drawn from linkage analyses of a particu-lar expression trait, provided that false-positive ratios are taken into account, and reasonable QTL detection thresh-olds are set. However, large differences between the expression measures were observed in some cases, partic-ularly for weaker linkage signals that may be due to QTLs with smaller genetic effects.
Competing interests
The author(s) declare that they have no competing inter-ests.
Authors' contributions
JMP performed the statistical analyses and drafted the manuscript. LA coordinated the study and helped to write the manuscript.
Comparison of the LOD score magnitude of cis and trans QTLs from all five phenotype sets (where LOD ≥ 3) against QTLs detected in REFQP
Figure 2
Publish with BioMed Central and every scientist can read your work free of charge
"BioMed Central will be the most significant development for disseminating the results of biomedical researc h in our lifetime."
Sir Paul Nurse, Cancer Research UK
Your research papers will be:
available free of charge to the entire biomedical community
peer reviewed and published immediately upon acceptance
cited in PubMed and archived on PubMed Central
yours — you keep the copyright
Submit your manuscript here:
http://www.biomedcentral.com/info/publishing_adv.asp
BioMedcentral
Acknowledgements
This work was supported in part by National Institutes of Health grants MH59490, MH078111, and HL45522.
This article has been published as part of BMC Proceedings Volume 1 Sup-plement 1, 2007: Genetic Analysis Workshop 15: Gene Expression Analysis and Approaches to Detecting Multiple Functional Loci. The full contents of the supplement are available online at http://www.biomedcentral.com/ 1753-6561/1?issue=S1.
References
1. Irizarry RA, Hobbs B, Collin F, Barclay YDB, Antonellis KJ, Scherf U, Speed TP: Exploration, normalization, and summaries of high density oligonucleotide array probe level data. Biostatistics
2003, 4:249-264.
2. Wu Z, Irizarry RA, Gentleman R, Martinez Murillo F, Spencer F: A model-based background adjustment for oligonucleotide expression arrays. J Am Stat Assoc 2004, 99:909-917.
3. Statistical algorithms description document [http:// www.affymetrix.com/support/technical/whitepapers/
sadd_whitepaper.pdf]
4. Li C, Wong WH: Model-based analysis of oligonucleotide arrays: expression index computation and outlier detection. Proc Nat Acad Sci USA 2001, 98:31-36.
5. Irizarry RA, Wu Z, Jaffee HA: Comparison of Affymetrix Gene-Chip expression measures. Bioinformatics 2006, 22:789-794. 6. Millenaar FF, Okyere J, May ST, van Zanten M, Voesenek LACJ,
Peeters AJM: How to decide? Different methods of calculating gene expression from short oligonucleotide array data will give different results. BMC Bioinformatics 2006, 7:137.
7. Cheung VG, Conlin LK, Weber TM, Arcaro M, Jen K, Morley M, Spiel-man RS: Natural variation in human gene expression assessed in lymphoblastoid cells. Nat Genet 2003, 33:422-425.
8. Cheung VG, Spielman RS, Ewens KG, Weber TM, Morley M, Burdick JT: Mapping determinants of human gene expression by regional and genome-wide association. Nature 2005,
437:1365-1369.
9. Morley M, Molony CM, Weber TM, Devlin JL, Ewens KG, Spielman RS, Cheung VG: Genetic analysis of genome-wide variation in human gene expression. Nature 2004, 430:743-747.
10. Labbe A, McClintick J, Martinez M: Summary of Contributions to GAW Group 16: Processing/Normalization of Expression Traits. Genet Epidemiol 2007, 31(Suppl 1):S132-S138.
11. Cheung VG, Spielman RS: Data for Genetic Analysis Workshop (GAW) 15, Problem 1: Genetics of Gene Expression Varia-tion in Humans. BMC Proc 2007, 1(Suppl 1):S2.
12. Gentleman RC, Carey VJ, Bates DM, Bolstad B, Dettling M, Dudoit S, Ellis B, Gautier L, Ge Y, Gentry J, Hornik K, Hothorn T, Huber W, Iacus S, Irizarry R, Leisch F, Li C, Maechler M, Rossini AJ, Sawitzki G, Smith C, Smyth G, Tierney L, Yang JY, Zhang J: Bioconductor: open software development for computational biology and bioin-formatics. Genome Biol 2004, 5:R80.
13. McClintick JN, Liu Y, Edenberg HJ: Mapping of trans-acting regu-latory factors from microarray data. BMC Proc 2007, 1(Suppl 1):S155.
14. Almasy L, Blangero J: Multipoint quantitative-trait linkage anal-ysis in general pedigrees. Am J Hum Genet 1998, 62:1198-1211. 15. Sidak Z: Rectangular confidence regions for the means of
mul-tivariate normal distributions. J Am Stat Assoc 1967, 62:626-633. 16. Hinrichs AL, Culverhouse R, Jin CH, Suarez BK: Linkage and asso-ciation analysis of principal components in expression data. BMC Proc 2007, 1(Suppl 1):S46.
17. SNP Mapping Web Application [http://actin.ucd.ie/soft ware.html]
18. Sobel E, Papp JC, Lange K: Detection and integration of genotyp-ing errors in statistical genetics. Am J Hum Genet 2002,
70:496-508.
19. Abecasis GR, Cherny SS, Cookson W, Cardon LR: Merlin – rapid analysis of dense genetic maps using sparse gene flow trees. Nat Genet 2002, 30:97-101.