ABSTRACT
MEKEEL, CHRISTOPHER JAMES. Mitigation of Error and Bias in Standard Test Methodologies used to Evaluate the Resistance of Protective Clothing to Permeation by Hazardous Chemicals. (Under the direction of Dr. Roger Barker).
Resistance to permeation by chemical hazards is a pivotal characteristic of chemical protective equipment (CPE). The requirements surrounding chemical permeation resistance ultimately define the safety and functionality of CPE. The substantial emphasis placed on evaluating permeation resistance necessitates considering the quality of its data to be of the utmost importance. Within the scope of characterizing chemical resistance, sources of error which result in an overall lower quality of data, diminish the confidence associated with experimentally defined levels of performance.
Major sources of experimental error in measurements of permeation resistance were identified with the test apparatus, temperature, and permeant analysis technique. Their influence on the quality of resultant data were individually quantified. Biases were identified within contemporary permeation test cell designs. Additionally, substantial temperature-magnitude bias was found to exist as a result of inadequate specifications surrounding test temperature tolerance.
Mitigation of Error and Bias in Standard Test Methodologies used to Evaluate the Resistance of Protective Clothing to Permeation by Hazardous Chemicals
by
Christopher James Mekeel
A dissertation submitted to the Graduate Faculty of North Carolina State University
in partial fulfillment of the requirements for the degree of
Doctor of Philosophy
Fiber & Polymer Science
Raleigh, North Carolina 2019
APPROVED BY:
_______________________________ Roger Barker
Committee Chair
_______________________________ Ahmed El-Shafei
_______________________________ Stephen Michielsen
ii BIBLIOGRAPHY
iii ACKNOWLEDGMENTS
The following body of work would not have been possible if not for the faculty, staff, and students of the Textile Protection and Comfort Center (TPACC) within the College of Textiles of North Carolina State University.
iv TABLE OF CONTENTS
LIST OF TABLES ... viii
LIST OF FIGURES ... x
Chapter 1. Introduction ... 1
1.1. Purpose of Research ... 1
1.2. Research Objectives ... 2
1.2.1. Identification and Mitigation of Major Sources of Experimental Error ... 2
1.2.2. Reducing the Influence of Test Apparatus and Analysis Technique on Resulting Data ... 3
1.3. Research Approach ... 4
Chapter 2. Evaluations of Chemical Permeation Resistance ... 6
2.1. Molecular Transport Phenomena ... 6
2.2. Evaluating Chemical Protection ... 8
2.2.1. Indices ... 11
2.3. Standardized Permeation Resistance Test Methods ... 14
2.3.1. Infinite Exposure ... 15
2.3.2. Finite Exposure ... 17
2.4. Challenge Chemical Battery ... 18
Chapter 3. Identifying Sources of Error and Bias in Permeation Measurements... 21
3.1. Root Cause Analysis ... 21
3.2. Material Formulation and Construction ... 23
3.3. Permeant Analysis ... 26
3.5.1. Magnitude of Measurement ... 26
3.4. Test Apparatus ... 29
3.4.1. Swatch Orientation ... 29
3.4.2. Test Cell Geometry ... 32
3.4.3. Cell Diameter as a Function of Swatch Thickness ... 35
3.4.4. Collection Media Flow Path ... 36
3.4.5. Test Apparatus Influence ... 40
3.5. Conclusion ... 40
Chapter 4. The Design of Chemical Permeation Test Apparatus ... 42
4.1. Traditional Designs ... 42
4.1.1. Early Test Cells ... 42
4.1.2. ASTM F739 ... 43
4.1.3. ISO and EN Standard Designs ... 46
4.2. Military Test Cells ... 48
4.2.1. Penetration Cup ... 48
4.2.2. Liquid Challenge/Vapor Permeation Apparatus ... 49
4.3. Performance-based Designs ... 50
4.3.1. Radian Microcell... 51
v
4.3.3. EMCC Test Cell ... 55
Chapter 5. Assessing the Precision of Chemical Permeation Test Data ... 57
5.1. Introduction... 57
5.2. Statistical Evaluation of Data Quality ... 58
5.2.1. Precision and Bias ... 58
5.2.2. Population Distribution ... 59
5.2.3. Number of Replicate Measurements ... 60
5.2.4. Impact of Precision ... 64
5.3. Evaluating the Demonstrated Precision in Permeation Testing ... 65
5.3.1. Reported Precision of Standardized Test Methods ... 65
5.3.2. Data Collection ... 67
5.3.3. Down-selection of Data... 69
5.3.4. Results ... 70
5.3.5. Discussion ... 73
5.4. Conclusion ... 77
Chapter 6. Development and Validation of an Alternative Chemical Permeation Test Cell 78 6.1. Introduction... 78
6.2. New Permeation Cell ... 81
6.2.1. Design and Assembly ... 81
6.2.2. Collection Chamber Flow Path Comparison ... 85
6.2.3. Flow Path Visualization ... 88
6.2.4. Important Features ... 89
6.3. Experimental Design ... 90
6.3.1. F739 Comparison Experiment ... 91
6.3.2. LCVP Comparison Experiment ... 97
6.4. Results ... 100
6.4.1. F739 Comparison ... 100
6.4.2. LCVP Comparison ... 104
6.5. Discussion ... 107
6.5.1. F739 Validation ... 107
6.5.2. LCVP Validation ... 109
6.6. Conclusion ... 111
Chapter 7. Development of a Chemical Sensor Array for Dedicated Permeant Analysis ... 113
7.1. Introduction... 113
7.2. Sensor Array Design ... 114
7.2.1. Component Selection ... 114
7.2.2. Circuit Design ... 115
7.2.3. Signal Conversion ... 116
7.2.4. Data Acquisition Software ... 118
7.2.5. Exposure Cell ... 119
7.3. Calibration and Sensitivity Determination ... 122
7.3.1. Methods and Materials ... 122
7.3.2. Results and Discussion ... 126
vi
7.4.1. Methods and Materials ... 130
7.4.2. Results ... 136
7.4.3. Discussion ... 140
7.5. Conclusion ... 141
Chapter 8. Impact of Temperature Variability on the Quality of Resultant Data ... 143
8.1. Introduction... 143
8.2. Temperature Control and Measurement ... 143
8.2.1. Environmental Chamber ... 143
8.2.2. Measurement and Recording ... 144
8.3. Method of Challenge Chemical Introduction ... 145
8.4. Permeation Cell Temperature Control ... 147
8.4.1. Indirect ... 147
8.4.2. Direct ... 148
8.5. Temperature Control Comparison Study ... 149
8.5.1. Methods and Materials ... 149
8.5.2. Results ... 150
8.5.3. Discussion ... 151
8.6. Conclusion ... 153
Chapter 9. Characterizing the Effect of Temperature on Chemical Permeation ... 154
9.1. Introduction... 154
9.2. Arrhenius Relationship ... 155
9.2.1. Arrhenius Limitations ... 157
9.3. Methods and Materials ... 159
9.4. Results ... 159
9.4.1. Acetone Permeation Results ... 159
9.4.2. Acetone Arrhenius Plots ... 161
9.5. Discussion ... 161
9.5.1. Acetone Arrhenius Relationship ... 161
9.5.2. Effect of Temperature Tolerance on Permeation Measurement Precision ... 164
9.6. Conclusion ... 166
Chapter 10. Compensating for Temperature-Induced Error in Permeation Data ... 167
10.1 Introduction... 167
10.1.1. Illustrating the Significance of Temperature on Permeation Measurements ... 167
10.2. Temperature-induced Error Compensation Technique ... 169
10.2.1. Compensation Vector Calculation ... 170
10.2.2. Test Parameters and Initial Results ... 172
10.2.3. Compensation Results... 172
10.3. Implementation using Historical Dataset ... 173
10.3.1. Characterizing the Temperature-Permeation Relationship ... 174
10.3.2. Effect of Temperature Compensation ... 176
10.4. Discussion ... 177
10.4.1. Acetone-FEP Permeation ... 177
vii
10.5. Conclusion ... 178
Chapter 11. Research Summary and Conclusions ... 179
11.1 Summary ... 179
11.1.1. Demonstrated Precision in Permeation Testing ... 179
11.1.2. Alternative Permeation Test Cell Development and Validation ... 179
11.1.3. Permeant Analysis via Chemical Sensor Array ... 180
11.1.4. The Effect of Temperature on Permeation ... 181
11.2 Research Conclusions ... 182
11.2.1. The Influence of Temperature on Measurements of Permeation Resistance ... 182
11.2.2. Impact of Test Cell Design on Resultant Data ... 185
11.2.3. Use of a Chemical Sensor Array for Permeant Analysis ... 189
11.2.4. Overall Conclusions ... 193
11.3 Recommendations for Future Research ... 195
11.3.1. Positive Control Use in Permeation Measurements ... 195
11.3.2. Standardization of Permeation Test Apparatus and Analytical Techniques ... 196
11.3.3. Expanded Error Compensation Study ... 197
viii LIST OF TABLES
Table 1. Research Approach ... 5
Table 2. Contemporary challenge chemical batteries. ... 19
Table 3. SSPR variability in films vs. laminates ... 25
Table 4. Predicted precision of permeation rate measurements ... 28
Table 5. Comparison of SSPR for vertical and horizontal cell designs. ... 31
Table 6. Comparison of pooled CV between orientations. ... 32
Table 7. Comparison of BT between 2" and 1" F739 cells. ... 33
Table 8. Comparison of SSPR between 2" and 1" F739 Cells. ... 34
Table 9. Comparison of Pooled CV between F739 cell sizes. ... 34
Table 10. Comparison of pooled CV between permeation cell sizes. ... 35
Table 12. CP uncertainty as a function of number of replicates. ... 63
Table 13. Demonstrated precision for SSPR measurements. ... 65
Table 14. Demonstrated precision for BT measurements. ... 66
Table 15. Summary of inter-laboratory results ... 67
Table 16. Summary of test cell equivalency studies. ... 68
Table 17. Inter-laboratory studies data... 71
Table 18. Comparison studies data. ... 72
Table 19. Pooled permeability results. ... 72
Table 20. Summary of permeation results from F739 comparison experiment... 103
Table 21. Statistical comparison of permeation results from F739 comparison experiment. 104 Table 21. Summary of cumulative permeation results from LCVP comparison experiments. 105 Table 22. Statistical comparison of LCVP experiment results. ... 107
Table 23. Demonstrated variability within pooled data sets. ... 110
Table 25. Description of individual array elements. ... 115
Table 26. Description of chosen calibrants. ... 123
Table 27. Array sensitivity in terms of LOD and MDPR, per calibrant. ... 128
Table 28. Acetone discrete sampling comparison results... 137
Table 29. Toluene discrete sampling comparison results. ... 137
Table 30. Difference in SSPR and CP results observed between CSA and PID. ... 139
Table 31. Cumulative sampling technique permeation results. ... 139
Table 32. Comparison of permeant sampling and analysis techniques. ... 140
Table 33. Air-bath temperature tolerance based on challenge introduction method. ... 147
Table 34. Temperature control comparison results. ... 151
Table 35. Acetone Permeation results measured at 28 °C – 36 °C. ... 160
Table 36. Permeability coefficients for acetone in FEP. ... 162
Table 37. Activation energy of acetone permeation... 163
Table 38. Precision of permeation metrics associated with various temperature tolerances. 165 Table 39. Arrhenius parameters for acetone permeation through FEP. ... 170
Table 40. Initial acetone permeation results. ... 172
Table 41. Acetone permeation results compensated for actual test temperature. ... 173
x LIST OF FIGURES
Figure 1. Solution-Diffusion model. [2] ... 6
Figure 2. Open (a) and closed-loop (b) permeation test configurations. [1] ... 9
Figure 3. Cumulative and rate measurements of permeation. ... 11
Figure 4. Contemporary permeation test methodologies. ... 15
Figure 5. Examples of CBRN ensembles ... 16
Figure 6. Ishikawa diagram used to identify sources of error in permeation test methods. .... 22
Figure 7. Molecular Transport Through Monolithic (a) and Laminate (b) CPC Materials [51] . 24 Figure 8. Predicted CV as a function of analyte concentration. ... 27
Figure 9. Vertical (a) and horizontal (b) test cell orientation. ... 29
Figure 10. Mixed gas permeation cell. [5] ... 36
Figure 11. Collection media flow path of griffith MK2 cell. [36] ... 37
Figure 12. Regions of stagnant flow in F739 cell. [36] ... 38
Figure 13. Quantitative measurement of stagnant region in F739 cell. [36] ... 39
Figure 14. Sansone (a) and Weeks (b) permeation test cells. [23, 22] ... 42
Figure 15. Side (a) and top (b) views of F739 test cell. [1, 24] ... 43
Figure 16. Stainless steel F739 variant. [65] ... 44
Figure 17. AMK permeation cell. [59] ... 45
Figure 18. Original ISO 6529 test cell. [67] ... 46
Figure 19. EN 16523 test cell. [28] ... 47
Figure 20. US Military penetration cup. [70] ... 48
Figure 21. Liquid Challenge/Vapor Permeation cell. [34] ... 49
Figure 22. Radian Microcell. [61] ... 51
Figure 23. Griffith MK1 (a) and MK2 (b) test cells. [36]... 52
Figure 24. Griffith MK2 with intact CPC. [36] ... 53
Figure 25. Visualization of the collection media flow path in F739(a), Griffith MK1(b), and MK2(c) cells. [36] ... 54
Figure 26. Diagram of EMCC test cell. [66] ... 55
Figure 27. CFD simulations of F739, LCVP, and EMCC collection chambers. [74] ... 56
Figure 28. Probability of normally distributed population. ... 59
Figure 29. SSPR population distribution. [58]... 60
Figure 30. Impact of precision on population distribution. ... 64
Figure 31. Study population distribution as a function of SSPR (a) and permeability (b) ... 75
Figure 32. ASTM F1407:99a ILS SSPRs as a function of temperature. ... 76
Figure 33. New chemical permeation test cell assembly. ... 82
Figure 34. Dimensional drawings of MK3 permeation cell in mm. ... 84
Figure 35. Cross-sectional view of MK3 permeation cell. ... 86
Figure 36. Cross-sectional view of the LCVP cell collection chamber ... 87
Figure 37. Cross-sectional view of F739 cell collection chamber. ... 88
Figure 38. CFD model of flow within the collection chambers of contemporary cell designs. ... 89
Figure 39. Determination of lag time from cumulative permeation graph. ... 96
xi
Figure 41. Cumulative permeation of toluene though FEP film. ... 102
Figure 42. Box plots of cumulative permeation results from LCVP comparison experiments. 106 Figure 43. TO-39 MOS sensor package. ... 114
Figure 44. Linearization of sensor voltage divider output. ... 116
Figure 45. Sensor transient response to chemical exposure. ... 116
Figure 46. LabVIEW® GUI VI. ... 119
Figure 47. Initial exposure cell design. ... 120
Figure 48. Final exposure cell assembly. ... 121
Figure 49. Assembled exposure cell. ... 122
Figure 50. Exposure flow diagram (a) and vapor saturator (b). ... 124
Figure 51. Logarithmically transformed calibration data. ... 127
Figure 52. Comparison of predicted and actual vapor concentrations. ... 129
Figure 53. Permeant analysis flow diagram. ... 131
Figure 54. PID isobutylene mixture calibration. ... 132
Figure 55. Calibration of CSA for acetone and toluene vapors. ... 133
Figure 56. GC-FID acetone calibration. ... 135
Figure 57. GC-FID toluene calibration. ... 135
Figure 58. Rate of acetone permeation through FEP. ... 138
Figure 59. Rate of toluene permeation through FEP film. ... 138
Figure 60. Acrylic environmental chamber used for air-bath. ... 143
Figure 61. LabVIEW VI for temperature measurement recording. ... 145
Figure 62. Effect of challenge chemical introduction on average air-bath temperature. ... 146
Figure 63. Permeation cell modified for direct temperature control. ... 148
Figure 64. Temperature of cell bodies under indirect (a) and direct (b) control. ... 150
Figure 65. Arrhenius plot of NMP permeation through CP gloves. ... 157
Figure 66. Arrhenius plots of TCE (○), NE (□), and DCM (∆) permeability (source units: cm3(STP)·cm/cm2·cmHg·sec) through 2 mil FEP film. [100] ... 158
Figure 67. Arrhenius Plots of P (a), SSPR (b), CP20 (c), and LT (d). ... 161
Figure 68. SSPR population distribution as a function of test temperature tolerance. ... 165
Figure 69. Demonstrating the impact of temperature on permeation: Thermal expansion example. ... 168
Figure 70. Example compensation vectors directed toward 30 °C and 32 °C. ... 171
Figure 71. Arrhenius plots created from ASTM F1407 ILS data. ... 175
Figure 72. New permeation cell in gas and vapor, and liquid challenge arrangements. ... 187
1
Chapter 1. Introduction
1.1. Purpose of Research
Resistance to permeation by chemical hazards is a pivotal characteristic of chemical protective equipment (CPE). The requirements surrounding chemical permeation resistance ultimately define the safety and functionality of CPE. Arguably, no other specification or evaluation influences the materials and construction of CPE to the same extent. The substantial emphasis placed on evaluating permeation resistance necessitates considering the quality of its data to be of the utmost importance. Contemporarily defined in terms of precision and accuracy, permeation data quality may be impacted by the practiced testing methodologies, apparatus, and analytical techniques.
In any characterization program, data infidelity and variability—whether independent or collective—detract from its ensuing utility. As a component of measurement error, variability observed among replicates obscures the distinction between normally differentiated intervals. The consequences of which may be less obvious, though of equal importance, to obtaining an authentic representative value. Within the scope of characterizing chemical resistance, sources of error which result in an overall lower quality of data, diminish the confidence associated with experimentally defined levels of performance.
2 technological developments seen within the materials of which they are meant to assess. The evaluation of modern materials through the use of antiquated techniques may contribute to an overall reduction in the quality of resultant data.
Contemporary permeation test methods purposefully lack specificity in aspects of their methodology to ensure utility across a broad range chemical materials and challenge chemicals. While intended to provide the testing laboratory sufficient flexibility for conforming existing procedures and apparatus toward a given challenge chemical, these gaps in specificity may ultimately contribute to error within the reported results. A detailed investigation into sources of error inherent to the test apparatus and methodologies of permeation testing has yet to be performed.
The fundamental aim of this research was to advance the state of chemical permeation evaluations by improving the quality of permeation measurement data. More specifically, the following work aims to identify and mitigate intrinsic sources of error in order to reduce the influence permeation testing methodologies have on their resulting data.
1.2. Research Objectives
1.2.1. Identification and Mitigation of Major Sources of Experimental Error
3 permeation testing procedures and experimental design. As such, the consequences associated with specified test temperature tolerances on the fidelity of resultant data were examined. Additionally, the exact extent to which temperature influences the magnitude of permeation measurements was characterized. Lastly, an error compensation technique was investigated in an effort to eliminate error induced into data comparisons through subtle differences in temperature observed between replicate permeation measurements. The combined insight gained from these efforts provided empirical evidence in support of suggested procedural changes aimed at reducing variability and bias within permeation testing.
1.2.2. Reducing the Influence of Test Apparatus and Analysis Technique on Resulting Data
Numerous researchers have previously reported on the significant influence the permeation test apparatus has on results obtained through its use. As such, a second objective of this work focused on the development of a next-generation test cell; a single alternative design suitable for use with contemporary standardized test methods. The influence of its unique design attributes on resultant data were investigated.
4 protective clothing. The sensitivity and accuracy of the detector were evaluated to determine its suitability in permeant analysis.
1.3. Research Approach
5
Table 1. Research Approach
Objective Review State of the Art Investigate Demonstrated Precision Improve Test Apparatus Advancement of Techniques and Methodologies
Description Comprehensive review of available literature to investigate:
Evaluate precision demonstrated by
contemporary test methods. Develop and validate next-generation test apparatus.
Develop chemical sensor array for use in permeant analysis.
Reduce the impact of temperature variability on data quality.
Tasks
Factors known to impact
permeation data quality Assemble collection of similar data to analyze precision.
Test Apparatus Design Sensor Array Design Evaluate Temperature Variability Design updated test cell which
incorporates important features of previous designs. Finalize design with improvements identified through the work.
Select array components, design analog circuitry, develop data acquisition method, and design sensor housing.
Constantly monitor test cell temperature and evaluate fluctuation. Identify causes of temperature variability and determine impact on data quality.
Technical requirements required for evaluating modern CPC methods and materials
Evaluate repeatability and reproducibility determined through inter-laboratory studies.
Assess Design Improvement Calibration Precision Temperature Control Characterize permeant collection
efficiency using computational fluid dynamics analysis.
Calibrate array against common challenge chemical battery members.
Investigate the difference in data quality observed when test cell temperature was controlled directly.
Important features of
previous test cell designs Evaluate repeatability associated with test cell equivalency studies.
Infinite Exposure Validation Study Assess Sensitivity Temperature-Permeation Relationship Validate new design for use with
infinite exposure scenarios and determine equivalency with ASTM F739 test cell.
Determine limits of detection and minimum detectable permeation rates.
Characterize the relationship between temperature and permeation within 32 °C ± 4 °C for acetone-FEP
The impact of test cell
design on resultant data Analyze true precision indicative of a large population of pooled data.
Finite Exposure Validation Study Permeant Analysis Temperature-Induced Error Compensation
Validate new design for use with finite exposure scenarios and determine equivalency with LCVP test cell.
Evaluate array's performance as a dedicated permeant analysis system.
Use temperature-permeation relationship to develop an active method of error compensation. Demonstrate compensation using acetone-FEP.
Chapter(s) 2, 3, 4 5 6 7 8, 9, 10
6
Chapter 2. Evaluations of Chemical Permeation Resistance
2.1. Molecular Transport Phenomena
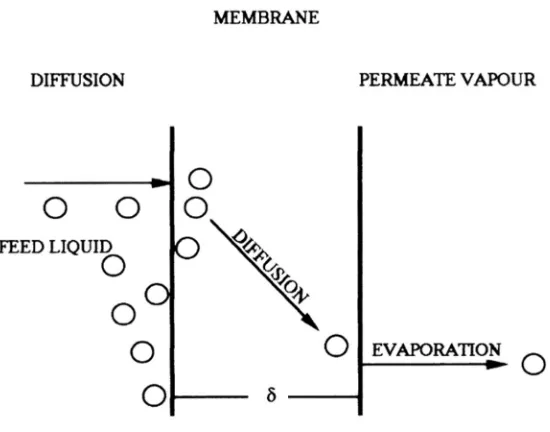
The permeation process begins with an initial absorption of chemical onto the exterior face of the chemical protective (CP) barrier material. Next, permeant molecules diffuse through the barrier matrix; occupying free voids between polymer chains. The process concludes with the desorption of the permeant from the interior surface. A diagram of the molecular transport phenomena may be seen in Figure 1.
7 George and Thomas describe the concentration gradient across the two faces as the driving force behind the transport process and governed by Fick’s laws of diffusion (Equation 1). In accordance to the solution diffusion model the steady state rate of permeation (SSPR) is the product of the diffusivity, D, and solubility, S, of the chemical within the polymer membrane divided by the membrane’s thickness, l (Equation 2).
Equation 1.
𝐽 = −𝐷𝛿𝑐 𝛿𝑥
Equation 2.
𝑆𝑆𝑃𝑅 =𝐷 ∙ 𝑆 𝑙
8
2.2. Evaluating Chemical Protection
9
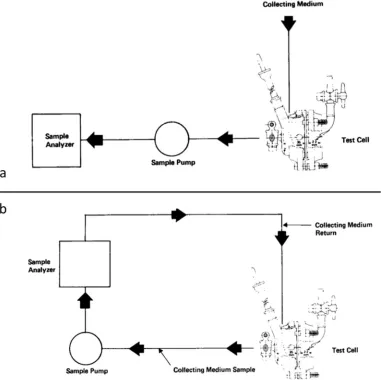
Figure 2. Open (a) and closed-loop (b) permeation test configurations.
11 2.2.1. Indices
Figure 3. Cumulative and rate measurements of permeation.
12
2.2.1.1. Rate Measurements
The most common permeation metric is permeation rate (PR); measured as the mass of challenge chemical permeating per unit surface area per unit of time. While often reported as μg/cm2/min, units of mg/cm2/s and mg/cm2/min have also been used. To compensate for
inconsistencies in thickness between replicate swatches, PR may be normalized by multiplying by the material’s thickness yielding permeability (μg/cm/min). Measurements of permeability are uncommon in CP evaluations although it has been shown to be less variable than other indices. Given an adequate test duration and mass of challenge chemical, transport across the CP material will eventually reach a steady state, referred to as the steady state permeation rate (SSPR). ASTM F2815:10, Standard Practice for Chemical Permeation through Protective Clothing Materials: Testing Data Analysis by Use of a Computer Program described the determination of (SSPR) by averaging three data points with the greatest permeant concentration located within the steady state region of the PR curve. Analysis of the steady state region may not always possible for every permeant-material pairing.
2.2.1.2. Time-based Indices
13 recorded. To compensate for differences in analytical sensitivity, an arbitrary point on the PR curve was chosen as a normalized BT value (nBT). At the time of this review, specified nBT values of 0.1 or 1.0 µg/cm2/min remain in most standardized permeation test methods.
Lag time (LT) is a time-based measurement commonly reported as an alternative to BT values. Described in more detail within Chapter 6, LT is directly related to the diffusion coefficient (D) and may be determined from permeation results as the intercept of the linear portion of the CP curve with the time axis. A period of approximately three LTs is required to ensure permeation has reached a steady state. LT was found to be less variable and therefore capable of differentiating between similar materials than measurements of nBT. Necessitating SSPR to have be met, derivations of LT from permeation results may not always feasible.
2.2.1.3. Cumulative Permeation
14
2.3. Standardized Permeation Resistance Test Methods
15
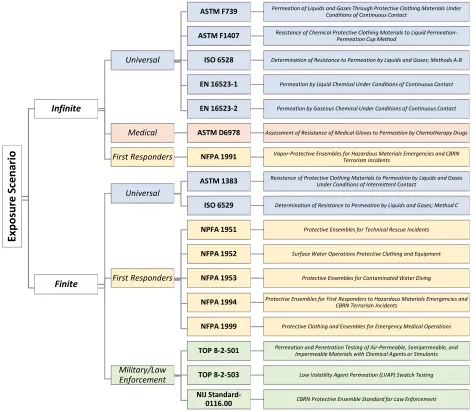
Figure 4. Contemporary permeation test methodologies.
2.3.1. Infinite Exposure
Test methods employing an infinite exposure scenario require the material to be fully exposed and in constant contact with the challenge chemical, regardless of whether the challenge chemical is in a gaseous or liquid state. Although the volume of challenge is limited to
Ex po su re S ce na rio Infinite Universal
ASTM F739 Permeation of Liquids and Gases Through Protective Clothing Materials Under Conditions of Continuous Contact
ASTM F1407 Resistance of Chemical Protective Clothing Materials to Liquid Permeation-Permeation Cup Method
ISO 6528 Determination of Resistance to Permeation by Liquids and Gases; Methods A-B
EN 16523-1 Permeation by Liquid Chemical Under Conditions of Continuous Contact
EN 16523-2 Permeation by Gaseous Chemical Under Conditions of Continuous Contact
Medical ASTM D6978 Assessment of Resistance of Medical Gloves to Permeation by Chemotherapy Drugs
First Responders NFPA 1991 Vapor-Protective Ensembles for Hazardous Materials Emergencies and CBRN Terrorism Incidents
Finite
Universal
ASTM 1383 Resistance of Protective Clothing Materials to Permeation by Liquids and Gases Under Conditions of Intermittent Contact
ISO 6529 Determination of Resistance to Permeation by Liquids and Gases; Method C
First Responders
NPFA 1951 Protective Ensembles for Technical Rescue Incidents
NFPA 1952 Surface Water Operations Protective Clothing and Equipment
NFPA 1953 Protective Ensembles for Contaminated Water Diving
NFPA 1994 Protective Ensembles for First Responders to Hazardous Materials Emergencies and CBRN Terrorism Incidents
NFPA 1999 Protective Clothing and Ensembles for Emergency Medical Operations
Military/Law Enforcement
TOP 8-2-501 Permeation and Penetration Testing of Air-Permeable, Semipermeable, and Impermeable Materials with Chemical Agents or Simulants
TOP 8-2-503 Low Volatility Agent Permeation (LVAP) Swatch Testing NIJ
16 that allowed by the cell design, a seemingly “infinite” mass of chemical is available for transport. When combined with adequate test durations, these methodologies allow for measurements of SSPR. Continuous exposure in this manner for extended periods of time is considered to be a worst case scenario for the end user. While the chances of a CP ensemble or material being held in constant contact with a hazardous chemical for the length of an entire work day is unlikely, these methods are intentionally severe in order to provide a conservative estimation of protection against an unknown or previously untested hazard. Infinite exposure evaluations most commonly report nBT as the main metric of performance. An example of a CBRN protective ensemble evaluated in this manner is depicted in Figure 5a.
Figure 5. Examples of CBRN ensembles (Kappler Protective Products(a) & Blauer
17 2.3.2. Finite Exposure
The extreme circumstances of infinite exposure methods have been determined to be unrealistic evaluation of CPC materials intended for use when: direct contact with chemical hazard is minimal, the identity of the chemical hazard is known—therefore a confident selection of CPC is possible—and the duration of exposure is limited. Examples of CBRN protective ensembles designed for this intent are shown in Figure 5b.
To simulate a finite exposure scenario, National Fire Protection Association, NFPA,
National Institute of Justice, NIJ, and US military test methods rely on the use of a challenge density or a mass of chemical per unit of surface area. Liquid chemicals are applied as discrete droplets in a uniform pattern across the material surface. To facilitate the application of challenge droplets, the permeation test apparatus is designed in such a manner that the entire surface area of the test specimen is accessible through the removal of a large threaded cap. When testing against a gaseous and vapor-producing chemical, a concentration consistent with a realistic exposure situation is specified. True representation of SSPR is unlikely to occur as the transport process is artificially influenced by the finite mass of permeant available and intestinally limited test duration. While BT was reported in early NFPA CBRN standards, the practice was changed in recent revisions to require the reporting of CP instead.
18 research concluding they provide inconsistent results due in part to difficulties in reproducing identical exposure intervals.
2.4. Challenge Chemical Battery
19
Table 2. Contemporary challenge chemical batteries.
20 Spence published a recommended list of challenge chemicals for comparing relative performance of CPC materials, stating that membership status should be based upon: a variety of different chemical functional groups, maximum potential for permeation, availability and ease of use, and amenability with currently testing techniques.
Members of the ASTM F1001 list were initially selected on the basis of their solubility and known interactions within common CPC materials at the time of the standards creation. This list serves as the foundation for the NFPA and subsequent NIJ batteries. Acrolein, acrylonitrile, and dimethyl sulfate were added to supplement the F1001 list for the NFPA 1991 battery. A subset of the NFPA 1991 battery was chosen for the individual classes of NFPA 1994. Suggested challenge chemicals in ISO 6529 and EN 16523-1 & 2 share similarities with the F1001 list. The battery comprised from both EN 16523 test methods represents the largest currently available.
21
Chapter 3. Identifying Sources of Error and Bias in Permeation Measurements
3.1. Root Cause Analysis
22
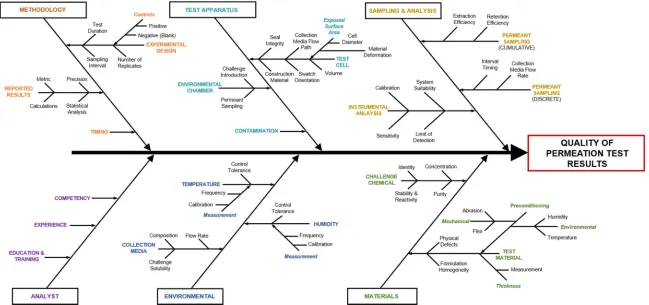
23 The Ishikawa diagram illustrated the complexity and interconnectivity of the numerous potential sources of error associated with permeation testing. Where applicable, a comprehensive review of available literature on the subjected of each is included within the introduction of each chapter. The following sections describe a number of root causes which are not incorporated into other chapters though required additional review throughout the course of this work.
3.2. Material Formulation and Construction
While many factors may affect permeation through the polymeric barrier layer of CPC, it is generally accepted that the nature of the polymer itself is the dominant factor. This is due to the strong influence properties such as free volume and chain mobility have on the transport process. Consequently, sample inhomogeneity has been found to have the greatest influence to the resulting precision of permeation test data. Differences in polymer formulations leading to disparities in cross link density, average molecular weight, crystallinity, and copolymer ratio, have been shown to directly impact transport phenomena. According to Phalen and Wong, variations in polymer composition and glove sample uniformity correlated with an increased variability in BT, SSPR, and CP values. Rivin et al, suggested differences in formulations of cross-linked polymers contributed to variability in the apparent permeability and diffusivity of CWA simulants.
24 against a greater variety of chemical species with a significant reduction in thickness in comparison to elastomeric materials. Although these materials offer definite advantages over their monolithic counterparts, their complexity may ultimately contribute to an increase in variability seen in permeation test results. Crank described the difficulties of modeling permeation through laminates due to convoluted multi-dimensional diffusion heavily influenced by complex interfacial relationships. This was supported by the work of Gårdebjer et al. where the presence of non-homogeneous crystallization at laminate interfaces was determined to cause localized variations in permeability. Additionally, the rate of permeation through laminate materials was found to be directionally dependent, adding to the complexity of describing the permeation process.
Figure 7. Molecular Transport Through Monolithic (a) and Laminate (b) CPC Materials
25 reaching steady state, the concentration of challenge chemical was nearly uniform across the thickness of a single layer of neoprene (Figure 7a). In comparison, the concentration profile within the viton-chlorobutyl composite material (Figure 7b) was found to diminish greatly after the first layer. The authors’ observations suggest that subtle differences in thickness or positioning of individual laminate layers, between replicate test specimens, may directly affect the precision of permeation results.
Table 3. SSPR variability in films vs. laminates
Mean SSPR
(µg/cm2/min) CV (%) Material
Films metallized LDPE LDPE 537 139 22 7
Laminates
LDPE/LDPE 88.5 17
LDPE/metallized LDPE 60.5 39
LDPE-metallized/metallized
LDPE 40 39
26 specimens. As material variability is likely impossible to avoid, it seems increasingly important that other sources of error within permeation testing are eliminated.
3.3. Permeant Analysis
3.5.1. Magnitude of Measurement
27
Figure 8. Predicted CV as a function of analyte concentration.
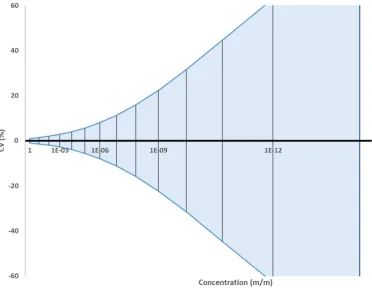
The Horwitz equation is commonly used to predict inter-laboratory precision (CVR) as a
function of analyte concentration (C). This correlation is a product of over 10,000 validation studies. With C expressed as a dimensionless mass fraction, CVR = 2C-0.15. Therefore, CVR is
expected to double for every two orders of magnitude reduction in concentration. Figure 8 depicts the predicted level of precision (PCVr), as function of concentration, using the estimation
28
Table 4. Predicted precision of permeation rate measurements
PR, µg/cm2/min PCVr, %
0.001 19
0.01 14
0.1 10
1.0 7
10.0 5
The Horwitz equation is only capable of predicting precision of “true measurements”, not those depending upon measurement technique or methodology. Therefore, it cannot be used to estimate variability within permeation testing directly. However, it is applicable for use in predicting potential variability directly related to the measurement of permeant concentration within the collection media. The predicted precision associated solely with the measurement of various permeation rates are shown in Table 4. Permeant concentration (µg/µg) was calculated from PR using 1” test cell, an open loop configuration, with a collection flow rate of 1 L/min. At a PR of 0.1 µg/cm2/min, the normalized BT value specified in ASTM F739:12, the Horwitz
29
3.4. Test Apparatus
The performance demonstrated through permeation testing is indicative to the level of protection afforded to the CPC end user. Therefore, any biases and variabilities introduced into permeation testing methods result in an inaccurate description of the CPC’s actual protection. The following section consists of an investigation into the potential impact the design of the testing apparatus may have on the quality of permeation results.
3.4.1. Swatch Orientation
Figure 9. Vertical (a) and horizontal (b) test cell orientation.
30 cover the exposure surface area of the test material. In comparison, the challenge chamber of a vertical cell must be entirely filled to ensure complete coverage. Multiple researchers have noted the need for a limited volume of potentially toxic challenge chemicals as practical benefit of horizontal swatch placement
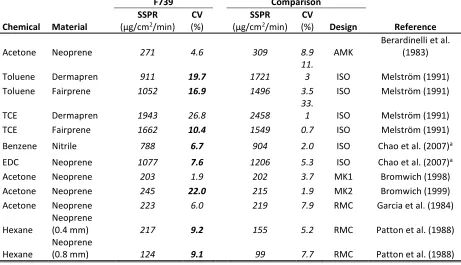
A review of relevant previous work indicated test cell orientation may have had an impact on resulting data. A collection of available data comparing SSPR values between vertical and horizontal oriented cells is shown in Table 5. For comparability, published data was converted to SSPR values with units of μg/cm2/min; wherever necessary. In approximately 70% of the
31
Table 5. Comparison of SSPR for vertical and horizontal cell designs.
F739 Comparison
Chemical Material
SSPR
(μg/cm2/min)
CV
(%)
SSPR
(μg/cm2/min)
CV
(%) Design Reference
Acetone Neoprene 271 4.6 309 8.9 AMK Berardinelli et al. (1983)
Toluene Dermapren 911 19.7 1721
11.
3 ISO Melström (1991)
Toluene Fairprene 1052 16.9 1496 3.5 ISO Melström (1991)
TCE Dermapren 1943 26.8 2458
33.
1 ISO Melström (1991)
TCE Fairprene 1662 10.4 1549 0.7 ISO Melström (1991)
Benzene Nitrile 788 6.7 904 2.0 ISO Chao et al. (2007)a
EDC Neoprene 1077 7.6 1206 5.3 ISO Chao et al. (2007)a
Acetone Neoprene 203 1.9 202 3.7 MK1 Bromwich (1998)
Acetone Neoprene 245 22.0 215 1.9 MK2 Bromwich (1999)
Acetone Neoprene 223 6.0 219 7.9 RMC Garcia et al. (1984)
Hexane Neoprene (0.4 mm) 217 9.2 155 5.2 RMC Patton et al. (1988)
Hexane Neoprene (0.8 mm) 124 9.1 99 7.7 RMC Patton et al. (1988)
EDC = 1,2-dichloroethane TCE = Tetrachloroethylene
a Estimated from Permeability Coefficient Data
To more appropriately gauge the impact of cell orientation had on precision, pooled CV values (CVp) were calculated and are shown in Table 6. Based on CVp, cell designs incorporating
32
Table 6. Comparison of pooled CV between orientations.
Orientation Vertical Horizontal
Metric CVp CVp
Steady State Permeation Rate 15.3 8.5
These results echo the findings of Chao et al., who explained the significant difference in permeability observed between the F739 and ISO cells as: “the gravity of permeant could have an effect on the permeation process for a vertical permeation cell used in the ISO 6529 method.”
3.4.2. Test Cell Geometry
33 Table 7. Comparison of BT between 2" and 1" F739 cells.
Breakthrough Time (min) 51 mm 25 mm
Chemical Material Mean (%)CV Mean (%)CV Reference
Toluene Neoprene 10 8.6 10 8.6 Vahdat (1988)
Methylene
Chloride PVC 9 18.0 11 10.0 Vahdat (1988)
Trichloroethane Neoprene 22 9.0 25 8.8 Vahdat (1988)
Perchloroethylene PVC 37 5.4 41 4.6 Vahdat (1988)
Trichloroethane Nitrile 108 6.7 116 7.8 Vahdat (1988) Trichloroethane Butyl 104 0.8 105 1.0 Vahdat (1988) Tetrahydrofuran Viton 18 15.1 18 41.3 Billing and Bentz (1988) Methylene
Chloride Viton 18 37.1 24 8.4 Billing and Bentz (1988) Ethyl Acetate Viton 11 82.1 25 1.6 Billing and Bentz (1988)
Acetone Neoprene 17 17.1 14 22.1 Henry (1988)a
Acetone Neoprene 18 20.6 17 9.4 Henry (1988)b
aOpen Loop
34 Table 8. Comparison of SSPR between 2" and 1" F739 Cells.
Permeation Rate (µg/cm2/min) 51 mm 25 mm
Chemical Material Mean CV (%) Mean CV (%) Reference
Toluene Neoprene 2388 9.7 2100 3.8 Vahdat (1988) Methylene Chloride PVC 7927 2.7 6587 7.9 Vahdat (1988) Trichloroethane Neoprene 2530 5.9 2240 4.8 Vahdat (1988) Perchloroethylene PVC 727 6.9 656 15.0 Vahdat (1988) Trichloroethane Nitrile 550 9.3 507 4.3 Vahdat (1988) Trichloroethane Butyl 138 8.2 128 9.2 Vahdat (1988)
Acetone Neoprene 239 6.5 253 20.0 Henry (1988)a
Acetone Neoprene 270 19.6 223 17.4 Henry (1988)b
aOpen Loop
bClosed Loop
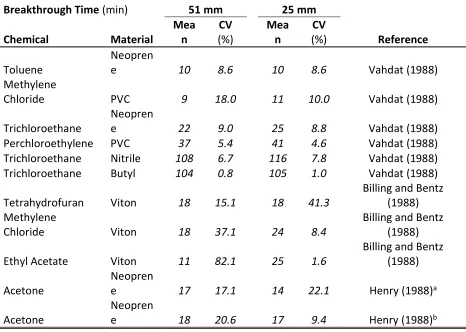
Pooled CV values for BT and SSPR are shown in Table 9. Overall, the 1” F739 demonstrated significantly less variability for the BT metric while slightly greater in SSPR.
Table 9. Comparison of Pooled CV between F739 cell sizes.
F739 Cell Size 51 mm 25 mm
Metric CVp(%) CVp(%)
Breakthrough Time 30.9 12.6
Steady State Permeation Rate 10.7 13.2
35 from open-loop permeation testing, using gaseous collection media, conducted at 21-25°C, and in accordance to ASTM F739 standard practice. Relevant data collected in Table 5 and Table 8 were combined with the results of Davis et al. along with an extensive study by Anna which evaluated four elastomeric materials against over 40 challenge chemicals; all using the 2” (51 mm) F739 cell. CVp values for the expanded data set indicate a slight increase in precision when
a smaller cell was used, as shown in Table 10.
Table 10. Comparison of pooled CV between permeation cell sizes.
Cell Size 51 mm ≤ 25 mm
Metric CVp(%) CVp(%)
Steady State Permeation Rate 11.9 9.8
3.4.3. Cell Diameter as a Function of Swatch Thickness
36 located at the face directed toward the collection media. Crank described the limit: l/a ≤ 0.2, where l is the sample thickness and a is the radius of a circular specimen. The error associated with edge effects remains negligible pending a test cell radius greater than five times the thickness of the material being evaluated. Bromwich incorporated this parameter into the design of a smaller variant of the Griffith cell intended for evaluating samples taken from glove fingertips. Rivin et al. theorized edge effects may have contributed up to 15% error in aspects of their measurements.
3.4.4. Collection Media Flow Path
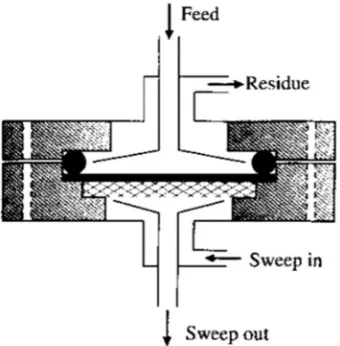
37 Figure 10 depicts a permeation cell used to conduct permeability testing employing mixed-gas measurement technique, as described by Czichos et al., in the Handbook of Measurements of Materials. The cell utilizes a radial flow path, similar to the Griffith MK2 cell (Figure 11), to eliminate “any trapped gas or dead zones”, which contribute to concentration variations across the film which result in measurement errors. While, this type of device was intended for evaluating gas permeability though thin film membranes for separation or pervaporative processes and not chemical permeation through CPC materials, the design highlights the importance of the collection media flow path (CMFP) on efficient permeant removal.
Figure 11. Collection media flow path of griffith MK2 cell.
38 reason for the cell’s proclivity to under estimate SSPR values. The authors conducted flow visualization experiments by introducing smoke into the collection media, up-stream from the cell’s inlet, and measured the time needed until smoke was no longer visible exiting the cell. The flow rate was then increased, leading to additional smoke clearing the cell, apparently trapped in stagnant regions within the chamber. Additionally, experimentally determined clearance times were approximately double of times calculated for ideal mixing.
Figure 12. Regions of stagnant flow in F739 cell.
39 rate was increased, suggesting the reintroduction of dye trapped in stagnant regions. These observations were quantitatively confirmed, by increasing the collection media flow rate and measuring the subsequent increase in permeation rate, as shown in Figure 13.
Figure 13. Quantitative measurement of stagnant region in F739 cell.
40 The concentration gradient of challenge chemical across the material is the main driving force behind the permeation process. Any permeant not removed from the collection surface of the test specimen decreases the magnitude of the gradient and may result in an overall reduction of permeation, thus an inaccurate depiction of protection. Additionally, any permeant that is not removed from the collection chamber is not made available analysis. Therefore, the loss of permeant into regions of stagnation combined with its delayed reintroduction into the collection medium stream may artificially influence the rate of permeation measured post-cell while simultaneously contributing to an increase in inter-replicate variability.
3.4.5. Test Apparatus Influence
The performance demonstrated through permeation testing indicates the level of protection afforded to the CPE end user. Therefore, any biases introduced into permeation testing methods result in an inaccurate description of the CPE’s actual protection. The design of a permeation test cell may have a significant impact on the quality of the results obtained with its use.
3.5. Conclusion
42
Chapter 4. The Design of Chemical Permeation Test Apparatus
4.1. Traditional Designs
4.1.1. Early Test Cells
Figure 14. Sansone (a) and Weeks (b) permeation test cells.
43 suitable for closed-loop test methods. The vertically oriented, glass design has evolved slightly into the standard test cell design today.
4.1.2. ASTM F739
Figure 15. Side (a) and top (b) views of F739 test cell.
A single design described by Henry and Schlatter in 1981, has become the internationally recognized standard with its inclusion in the ASTM F739-12e1 Standard Test Method for Permeation of Liquids and Gases through Protective Clothing Materials under Conditions of
44 Schlatter’s design, henceforth, the “F739 cell,” remains fundamentally unchanged from its original inception.
Figure 16. Stainless steel F739 variant.
45 was created to reduce the 50mL volume of challenge chemical required when using the original 2” version. Henry found the 1” cell produced BT and SSPR values that were not significant different than those associated with the 2” design, despite a four-fold increase in exposed surface area. Vahdat also determined equivalency in the smaller cell as the percent difference in permeation metrics were less than 12.5% for most permeant-material pairs tested. Additionally, Billing and Bentz found the smaller cell easier to seal. Berardinelli et al. determined a similar 1” glass cell (Figure 17), manufactured by AMK Glass Company, compared favorably to the 2” F739 cell, giving analogous BT and SSPR results. The AMK design has also been utilized in multiple studies out of the National Institute of Occupational Safety and Health (NIOSH).
46 Regardless of the specific incarnation of the basic F739 design, its legacy is undeniable. While discussing the history of permeation cell designs, Henry stated: “Perhaps no one will be able to show how many injuries, illnesses and deaths that have been prevented because of the data generated by the test cell and method, but it certainly has given valuable information to protect workers from dermal contact and exposure.”
4.1.3. ISO and EN Standard Designs
Figure 18. Original ISO 6529 test cell.
vertically-47 opposed challenge and collection chambers. Subsequently, the volume of challenge chemical required to ensure complete coverage of the surface area of a CPC swatch was limited to less than 10mL. Mellström complimented the ease of use of the ISO design thanks to this limited challenge volume and its sturdy construction. The ISO cell was found to be equivalent to the 1” F739 cell though shown to provide significantly different results to that of the 2” F739.
Figure 19. EN 16523 test cell.
48 4.2. Military Test Cells
Military CPC testing programs have historically differed from their civilian counter parts whose focus was primarily on protecting industrial workers against chronic hazardous exposure. A greater variety of potential hazards combined with a wide array of specialized equipment demanded unique test methods and apparatuses capable of high throughput testing environment.
4.2.1. Penetration Cup
49 Figure 20 depicts one of the earliest forms of military-specific permeation test cells. Constructed of stainless steel, the “penetration cup” evaluated 9.8cm sample discs and was described as, “…simple, easy to operate and was sufficiently flexible to accommodate the wide assortment of different chemicals”. The penetration cup would eventually give way to the contemporary standard design for military and CWA testing, the liquid challenge/vapor penetration (LCVP) cell.
4.2.2. Liquid Challenge/Vapor Permeation Apparatus
50 A 1984 report from the Chemical Research and Development Center, describes the earliest found reference to the LCVP cell. Aspects of the CRDC procedure were incorporated into the modern test operations procedure, TOP 8-2-501. The current LCVP cell (Figure 21) and test methodologies allow for its use in assessing the protection afforded by air-permeable and impermeable materials alike, through various changes in test cell configuration and swatch exposure techniques. A large threated cap was incorporated into the challenge chamber. With the cap removed, the entire exposed surface area of the swatch is accessible, allowing for easy application of challenge chemical droplets.
In addition to military test programs, the LCVP design has been specified for use in applicable NFPA HAZMAT testing and certification programs. Despite this growing acceptance, several researchers have criticized the LCVP as underestimating permeation results. Additionally, Verwolf et al. found issue with the large thermal mass of the LCVP stating that it required greater than two hours to reach test temperature after removal from the environmental chamber in order to load test swatches.
4.3. Performance-based Designs
51 specified use or acceptance, but rather the noteworthy technologies and techniques used in their development and evaluation.
4.3.1. Radian Microcell
Figure 22. Radian Microcell.
52 In an 1985 EPA report, the RMC exhibited a significant reduction in inter-replicate variability, in comparison to the F739 cell. The US Army Research Laboratory found the design sufficient for evaluating elastomeric materials against DMSO. Interestingly, while the patent claims equivalency to the F739 cell, Patton et al. published a number of difficulties in comparing the two designs. As in the EPA report, the Microcell demonstrated a propensity for increased precision, but the authors concluded that variation in permeation metrics were shown to be dependent with response to its mean and therefore the ASTM procedure could not be used to determine equivalency.
4.3.2. Griffith Test Cell
53 The Griffith permeation cells (Figure 23) were developed by Bromwich at Griffith University. The original Griffith cell design (Figure 23a) set out to improve upon the F739 cell through increased durability, functionality, and ease of use. The second generation (Figure 23b) incorporated a novel, radial collection media flow path (CMFP). Additionally, both iterations were capable of testing intact CPC materials, as seen in Figure 24. Both Griffith cells were found to be equivalent to the F739 2” cell and demonstrated a significant increase in precision.
54 When developing the MK2, particular attention was given to the CMFP in an effort to eliminate areas of stagnation and ensure the efficacy of permeant collection. Dye flow visualization experiments (Figure 25) identified areas of stagnant flow in the F739 and MK1 collection chambers and provided visual indication of the improvements associated the MK2 design.
55 Bromwich’s work is unequaled in the depth of its investigation into permeation test cell performance. Consequently, various aspects of the Griffith cell designs and evaluation techniques will be covered in more detail in following sections.
4.3.3. EMCC Test Cell
Figure 26. Diagram of EMCC test cell.
56 the thickness of boundary layer at the surface of the test swatch. Computational fluid dynamics (CFD) simulations were used to compare the CMFPs of the F739, LCVP, and EMCC prototype designs. The authors’ CFD simulations (Figure 27), depict the contours of velocity magnitude for each cell type. The publication describing the EMCC cell was the only work found to utilize CFD analysis for improving permeation cell design and performance.
Figure 27. CFD simulations of F739, LCVP, and EMCC collection chambers.
57
Chapter 5. Assessing the Precision of Chemical Permeation Test Data
5.1. Introduction
Inter-laboratory studies (ILS) are performed to demonstrate levels of performance and precision indicative of a standardized test method. The information gained through an ILS may be used to dictate the available precision afforded to product specifications when specifying minimal expectations of performance. Contemporary chemical permeation resistance standard test methods used in the evaluation of chemical protective clothing (CPC) methods suffer from significant inter-laboratory variability, as indicated by their ILS data. It is imperative that these methodologies provide high quality data to allow for the protection of CPC materials to be accurately defined.
58 5.2. Statistical Evaluation of Data Quality
An analytical study; the practice of using collected data to predict future performance, relies upon statistics to describe the characteristics of a large population through the evaluation of a limited sample set. Standardized permeation testing produces specific indices which may be used as metrics for determining minimum performance requirements of the materials tested. Uncertainty in permeation test results detracts from the accuracy of expected levels of afford protection.
5.2.1. Precision and Bias
Repeated, independent measurements of any phenomena or characteristic are unlikely to produce identical results due to inherent sources of error within the system. Variable deviation from previous and future values creates the breadth of the population distribution discussed below. In most systems, the complete absence of variability is improbable, necessitating methods of defining and evaluating its impact on decisions made using the chosen data set. Precision describes the extent of variability, or the “closeness of agreement between independent test results obtained under stipulated conditions.” Precision may be expressed as standard deviation (σ), variance (σ2), or as relative standard deviation (RSD), also referred to as
59 5.2.2. Population Distribution
Figure 28. Probability of normally distributed population.
60
Figure 29. SSPR population distribution.
Patton et al. suggested treating permeation results as parametrically distributed, based upon 490 observations (Figure 29). Contrary to this suggestion, nearly all publications on the topic of chemical permeation testing assume a normal population; based upon statistical and mathematical techniques employed. As an example, relative ASTM, ISO, and CEN standardized test methods incorporate precision specifications, calculated with the assumption of a normally distributed population. As a consequence—and for simplicity—the following section will conform with the popularity of this assumption.
5.2.3. Number of Replicate Measurements
61 sample mean (𝑥̅), consisting of n observations, will be approximately normal with the population mean (𝜇) and variance (σ2) of σ2/n, if n is large. In other words, as the size of n approaches the true size of the population (N), the distribution of sample means begins to replicate the true distribution of the population mean, making 𝑥̅ an estimator of 𝜇 with a bias of 𝑥̅ – 𝜇. This relationship allows for the standard error of the sampling distribution, 𝜎 ̅, to be determined from the standard deviation of the population, 𝜎, using Equation 3.
Equation 3.
𝜎 ̅ = 𝜎 √𝑛
As 𝜎 is often unknown, the sample standard deviation, s, may be substituted into Equation 3. Using the probability distribution shown in Figure 1, there is reason confidence that
𝜇 lies within two standard errors of the estimate; 𝜇 = 𝑥̅ ± 2𝜎̅. When σ2 is unknown, the confidence interval estimate (CI) may be calculated with a known confidence level using Equation 4.. The length of CI is a measure of the precision of 𝑥̅.
Equation 4.
𝐶𝐼 = 𝑡 ,
𝑠
62 The central limit theory relies upon the assumption that n is appropriately large. It is generally accepted that a sample size of 30-40 observations provides an adequate estimate of the true population. Alternatively, the requisite sample size may be calculated using Equation 5., where the sought-for uncertainty, e, is equal to 𝑥̅ – 𝜇.
Equation 5.
𝑛 = 𝑡𝑠 𝑒
63
Table 11. CP uncertainty as a function of number of replicates.
n eCP(µg/cm2)
2 9.0
3 1.8
5 1.2
10 0.7
30 0.4
50 0.3
The precision of the CP measurements effectively limits the precision of performance expectations. Consider a hypothetical CPC material with a mean CP of 5.0 µg/cm2. Using the
accepted precision of permeation results, CV = 20%, Table 11 displays CP uncertainty (ecp) at the
95% confidence level, as a function of the number of replicates. The uncertainty associated with three CP observations was calculated as 1.8 µg/cm2. Therefore, it would not possible to
64 5.2.4. Impact of Precision
Figure 30. Impact of precision on population distribution.
Figure 30 demonstrates the effect of precision on the width of a normally distributed population with x = 4. As CV increases, the width of the distribution increases proportionally. Typically, the precision of repeated measurements or repeatability (r), is considered to be adequate when CV ≤ 20%. Additionally, the precision of a data set effectively limits the ability to differentiate between populations with similar means due to an overlap in their probability distributions. Precision limits may be calculated as 2.77σ. According to ASTM E177-14, approximately 95% of successive measurements can be expected to differ by less than 𝑡 ∙ √2σ, where t = 1.96 for the 95% confidence interval. Subsequently, two populations: A and B, with means: xa and xb, would require a difference of 2.77(σa+ σb) to ensure a <5% chance of an overlap
65
5.3. Evaluating the Demonstrated Precision in Permeation Testing
5.3.1. Reported Precision of Standardized Test Methods
Contemporary standardized test methods for chemical permeation: ASTM F739, ISO 6529 and EN 16523-1, include precision and bias statements based off demonstrated precision between laboratories, commonly referred to as inter-laboratory studies. For harmonization between international standards and due to similarities between testing methodologies, the data from these studies is often shared between standard organizations. The demonstrated within-laboratory precision between (σr) for SSPR and BT measurements are shown in Table 12 and Table 13, respectively. For comparison purposes precision limits PLr were calculated from
published data as 2.77σ. Note: σr and PLr values have the same units as their respective
permeation index; μg/cm2/min for SSPR and minutes for BT.
Table 12. Demonstrated precision for SSPR measurements.
Chemical Material x σr PLr Reference
66
Table 13. Demonstrated precision for BT measurements.
Chemical Material Average σr PLr Reference
Acetone Butyl 198 56 155 ASTM F739:1999
Acetone Neoprene 7.2 0.83 2.3 ASTM F739:1999
Acetone Neoprene 8.7 0.8 2.2 ASTM F739:2012
Acetone Neoprene 6 3 8 ISO 6529:2001
Toluene Hypalon 161 10 28 EN 16523-1:2015a
Sulfuric Acid Polychloroprene 197 33 91 EN 16523-1:2015 a
Methanol Nitrile 51 9 25 EN 16523-1:2015 a
aShared with ISO 6529:2013
Analysis of the above data clarifies the effect of inter-replicate variability. Based upon the most precise data set, transcribed from ISO 6529:01, 95% of replicate SSPR measurements may be expected to fall between 1886-2290 μg/cm2/min or differ by less than 27%; in relative
terms. In comparison, based upon the data included in ASTM F739:99a, replicate SSPR measurements of acetone through neoprene would be expected to fall between 191-299 μg/cm2/min, or differ by less than 62%. In total, SSPR measurements demonstrated relative
precisions (CVr) between 10-45% and 6-50% for the BT metric. Five of seven BT data sets
obtained adequate precision, CVr ≤ 20%, in contrast to only two sets of SSPR data.
67 5.3.2. Data Collection
In order to assemble to the largest data possible data set, published or reported permeation data generated via constant contact test methods was collected. The largest sources of inherently related data came from inter-laboratory studies (ILS) and test cell equivalency studies (TCES).
5.3.2.1. Inter-laboratory Studies
Inter-laboratory studies are performed in order to report the precision and bias or expected performance of standardized test methodologies. ILS data was collected from available ASTM, ISO, and CEN constant contact permeation methods. Table 14 contains the ILS source, tested material, challenge chemical, and the reported metric.
Table 14. Summary of inter-laboratory results
Source Challenge Material Metric
ASTM F1407:1999 Acetone Neoprene SSPR, BT, CP
ASTM F739:1999 Acetone Butyl SSPR & BT
ASTM F739:1999 Acetone FEP SSPR
ASTM F739:1999 Acetone Neoprene SSPR & BT
ASTM F739:20071 Acetone Neoprene SSPR & BT
ISO 6529:2001 Acetone Neoprene SSPR & BT
CEN 16523-1:2015/ISO 6529:2013 Methanol Nitrile BT CEN 16523-1:2015/ISO 6529:2013 Sulfuric Acid Polychloroprene BT CEN 16523-1:2015/ISO 6529:2013 Toluene Hypalon BT
5.3.2.2. Test Cell Equivalency Studies