Inferences About Human Demography Based on Multilocus Analyses
of Noncoding Sequences
Anna Pluzhnikov,* Anna Di Rienzo* and Richard R. Hudson
†,1*Department of Human Genetics and†Department of Ecology and Evolution, University of Chicago, Chicago, Illinois 60637
Manuscript received December 27, 2001 Accepted for publication March 19, 2002
ABSTRACT
Data from 10 unlinked autosomal noncoding regions, resequenced in 15 individuals from each of three populations, were used in a multilocus analysis to test models of human demography. Each of the 10 regions consisted ofⵑ2500 bp. The multilocus analysis, based on summary statistics (average and variance of Tajima’sDand Fu and Li’sD*), was used to test a family of models with recent population expansion. The African sample (Hausa of Cameroon) is compatible with a constant population size model and a range of models with recent expansion. For this population sample, we estimated confidence sets that showed the limited range of parameter values compatible with growth. For an exponential growth rate as low as 1⫻10⫺3/generation, population growth is unlikely to have started prior to 50,000 years ago.
For higher growth rates, the onset of growth must be more recent. On the basis of the average value of Tajima’sD, our sample from an Italian population was found to be incompatible with a constant population size model or any simple expansion model. In the Chinese sample, the variance of Tajima’sDwas too large to be compatible with the constant population size model or any simple expansion model.
E
LUCIDATING the history of the human population and constant size, growth following a bottleneck, and growth from an initial constant and nontrivial size (Di size is an important part of reconstructing humanevolution and understanding patterns of human varia- Rienzoet al.1998;Kimmelet al.1998;Reichand Gold-stein1998;Gonseret al.2000;Zhivotovskyet al.2000). tion. Changes in population size are thought to mark
important events in the history of a species, e.g., geo- In addition, different models of the mutation process have been assumed in different studies. As a consequence graphic range expansions, development of
technologi-cal innovations, and climatic changes. In addition, the of this heterogeneity, and the uncertainty about the parameters of the mutation process, the results of micro-estimation of the time since the most recent common
satellite studies did not lead to consistent results on the ancestor (TMRCA), which has important implications
evidence for growth and the populations that experi-for human evolution, relies critically on assumptions about
enced it. human demography (Brookfield1997;Stephensand
Similarly, studies of nuclear sequence variation lead Donnelly 2000;Thomson et al. 2000). Finally,
infer-to somewhat contrasting conclusions. In general, nu-ences about the frequency of disease-causing alleles in
clear loci show more ancient coalescence times com-human populations also rely on assumptions about the
pared to mtDNA (as might be expected on the basis of demographic history (ReichandLander2001). In the
the different effective population sizes), but no evidence last 10 years, many data sets have been collected with
for a star-shaped genealogy. The latter observation sug-the purpose of gaining insights into sug-the history of
popu-gests that rapid growth from a small initial size is not lation growth in humans. MtDNA sequences showed
evi-compatible with the data and that, if ancient population dence in favor of rapid population growth from a small
growth occurred, it started from a population of non-initial size such as that leading to a star-shaped
geneal-trivial size. Unfortunately, studies of nuclear sequence ogy. This conclusion was supported by the excess of rare
variation also vary greatly with regard to the scheme for variants and the analysis of mismatch distributions (Di
sampling populations (from population-based to grid RienzoandWilson1991;SlatkinandHudson1991;
sampling), the type of genomic regions studied (from RogersandHarpending1992). Microsatellite studies
coding to noncoding), and the method of variation also support the idea of an ancient population growth.
detection (Przeworskiet al.2000).Walland Przew-However, different studies considered different models
orski(2000) considered a variety of demographic mod-of growth, which include growth from an initial small
els, but none of them could account for the pattern of variation seen at all loci. Since many of the loci exam-ined spanned coding regions, it could not be excluded
1Corresponding author:Department of Ecology and Evolution, 1101
that natural selection affected a portion of them. They
E. 57th St., University of Chicago, Chicago, IL 60637.
E-mail: [email protected] suggested that models of bottleneck or geographic
structure underlie the patterns observed at most loci nential growth rate as low as 1⫻ 10 /generation, the growth phase is unlikely to have started earlier than while a minority of loci are affected by directional
selec-tion. ⵑ50,000 years ago. For higher—possibly more realistic— growth rates, the onset of growth must be more recent. More recently, 10 noncoding regions were surveyed in
three population samples to characterize the decay of Both non-African samples are incompatible with the constant population size model or any version of our linkage disequilibrium and obtain population-based
es-timates of the crossing-over and gene conversion rates growth model. (Frisse et al. 2001). This survey also showed that the
two non-African samples depart significantly from the
MATERIALS AND METHODS expectations of an equilibrium model for several aspects
of the data, including average and variance of Tajima’s Data collection:A new scheme for data collection was devel-Dacross loci, higher-than-expected levels of linkage dis- oped to survey simultaneously and efficiently sequence varia-tion and linkage disequilibrium (LD). This consisted of rese-equilibrium, and a high proportion of loci with
signifi-quencing two segments ofⵑ1 kb separated by ⵑ8 kb in all cant Fay and Wu’s H-tests (Hamblinet al. 2002). The
individuals from three population samples. Each of these two-African sample, however, appeared to be consistent with
segment units is referred to as a “locus pair.” The data set an equilibrium model with a constant long-term pop- analyzed here consists of 10 such locus pairs that are unlinked ulation size. Several scenarios of demography emerge as to each other. The genomic regions were chosen according to a fixed set of criteria. These criteria were determined by relevant models for human populations. One is a model
the need to pool data from different locus pairs in the analysis of constant but nontrivial size followed by recent
popula-and, thus, to select locus pairs with similar recombination and tion growth. This model, which appears to be most rele- mutation rates. In addition, because the main goal of this vant to African populations, is the main topic of this analysis is to reconstruct demographic histories, it was neces-article. Additional models envision a population of con- sary to reduce the probability that the surveyed genomic re-gions were affected by natural selection. This was achieved by stant and nontrivial size that experiences a bottleneck
choosing regions that do not contain or flank known or or temporary population subdivision, in both cases
fol-strongly predicted coding regions (the minimum distance be-lowed by population growth. These more complex mod- tween the regions surveyed and the closest known or strongly els may be most relevant to European populations and predicted gene was ⬎25 kb). The details of the procedure perhaps non-African populations in general. for selecting genomic regions that fulfilled these criteria are described inFrisseet al.(2001). The surveyed regions have Here, we reanalyze the noncoding sequence data in
an average crossing-over rate of 1.29 cM/Mb and 35–45% G⫹
Frisse et al.(2001) to test explicitly models of growth
C content. The 10 locus pairs were resequenced in all 15 from an ancestral population at equilibrium. The
analy-individuals (30 chromosomes) of samples drawn from each ses carried out here differ from those inFrisse et al. of three large populations from the major ethnic groups: (2001) in that they properly take into account the effect Hausa of Cameroon (Sub-Saharan Africa), Italians (Europe), and Han Chinese (Asia). Descriptive statistics of sequence of recombination occurring within loci and test a simple
variation are shown in Table 1. growth model for a broad range of parameter values.
Demographic history models in the coalescent framework: These tests are based on Tajima’s D statistic (Tajima The basic model of population demography is the Wright-1989) and Fu and Li’sD* statistics (FuandLi1993). The Fisher model, which assumes a panmictic population with critical values of these statistics depend on the mutation nonoverlapping generations. We assume the diploid popula-tion size in the distant past was constant at sizeNA. At a time,
rate, recombination rate, and population size history.
tonsetgenerations in the past, the population began
exponen-We estimated these critical values for different
popula-tially growing until the present. Thus, measuring time in units tion histories using coalescent-based Monte Carlo simu- of generations before present we assume the population size, lations. We incorporate uncertainty about certain ge- N(t), is
netic parameters (recombination and mutation rates)
and their variability between loci by assuming these rates N(t)⫽
冦
NA, tⱖtonsetNAe␣(tonset⫺t), 0ⱕ tⱕtonset (1)
are random variables. Thus, in the simulations, the
val-ues of these rates are drawn from specified probability (seeWeissandvon Haeseler1998;Pritchardet al.1999). distributions. Furthermore, we restricted our attention The current population size,N(0)⫽NAe␣tonset, is denotedN
0.
The primary goal of this article is to determine the values of only to combinations of parameter values expected to
␣andtonsetfor which the model is compatible with the data.
match the polymorphism levels observed in human
vari-We assume a generation time of 20 years. Only positive values ation studies.
of␣are considered.
In agreement with Frisseet al. (2001), we find that Coalescent simulations with recombination were used to the African sample is compatible with the constant pop- generate samples under this model. These simulations used standard methodology (Hudson1983, 1990) except that the ulation size model, as well as a range of models with
values of some parameters were drawn from distributions as recent expansion. Since the growth models considered
described below. Recombination was assumed homogeneous here imply an interdependence among the parameters,
expo-TABLE 1
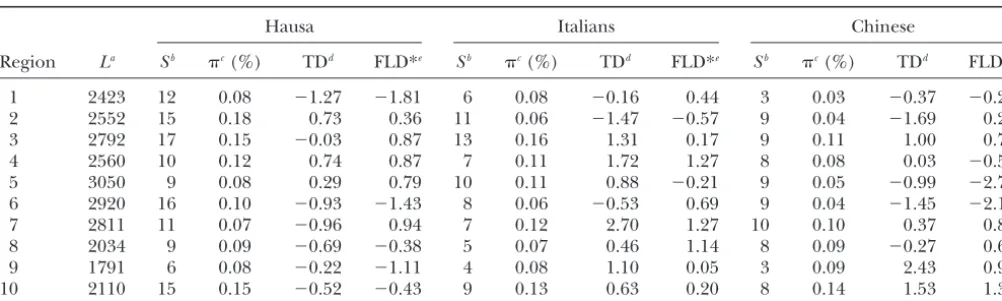
Summary statistics of sequence variation
Hausa Italians Chinese
Region La Sb c(%) TDd FLD*e Sb c(%) TDd FLD*e Sb c(%) TDd FLD*e
1 2423 12 0.08 ⫺1.27 ⫺1.81 6 0.08 ⫺0.16 0.44 3 0.03 ⫺0.37 ⫺0.26
2 2552 15 0.18 0.73 0.36 11 0.06 ⫺1.47 ⫺0.57 9 0.04 ⫺1.69 0.20
3 2792 17 0.15 ⫺0.03 0.87 13 0.16 1.31 0.17 9 0.11 1.00 0.79
4 2560 10 0.12 0.74 0.87 7 0.11 1.72 1.27 8 0.08 0.03 ⫺0.58
5 3050 9 0.08 0.29 0.79 10 0.11 0.88 ⫺0.21 9 0.05 ⫺0.99 ⫺2.71
6 2920 16 0.10 ⫺0.93 ⫺1.43 8 0.06 ⫺0.53 0.69 9 0.04 ⫺1.45 ⫺2.12
7 2811 11 0.07 ⫺0.96 0.94 7 0.12 2.70 1.27 10 0.10 0.37 0.87
8 2034 9 0.09 ⫺0.69 ⫺0.38 5 0.07 0.46 1.14 8 0.09 ⫺0.27 0.69
9 1791 6 0.08 ⫺0.22 ⫺1.11 4 0.08 1.10 0.05 3 0.09 2.43 0.95
10 2110 15 0.15 ⫺0.52 ⫺0.43 9 0.13 0.63 0.20 8 0.14 1.53 1.32
aLength in base pairs of sequenced segment. bNumber of polymorphic sites.
cNucleotide diversity per base pair. dTajima’sD(Tajima1989). eFu and Li’sD* (FuandLi1993).
gamma distribution as described below. The middle “8 kb” of of polymorphic sites in samples. To incorporate prior informa-the generated polymorphisms was ignored to produce samples tion about observed levels of polymorphism in earlier studies, analogous to our locus pair data. we chose the value of A (⫽ ENA/4) so that the expected
Parameter values: Since the goal of this study is making number of segregating sites per kilobase in a sample of 30 inferences about various demographic scenarios, the parame- chromosomes is 4. This choice forAis based on the following
ters not directly associated with demography, such as the muta- observations. In a large number of studies, Watterson’s esti-tion rate,, and the recombination rate,c, can be thought mate of(⫽4Ne) is on averageⵑ0.001 (somewhat larger
of asnuisanceparameters. Elimination of these nuisance pa- in African populations and somewhat smaller in non-African rameters is easily achieved by adopting the Bayesian approach, populations). This is also the average estimated value ofin namely by viewing them as random quantities and subse- the 10 locus pairs analyzed here. In a sample of 30 chromo-quently integrating them out (Severini 1999). Specifically, somes, this value ofleads to an expected number of polymor-we model the uncertainty in the values ofby a Gamma(2, phic sites of 4/kb under the neutral constant population size
) distribution. Similarly, we assume that the recombination model. Thus, for the constant population size model we chose rate,c, is an independent Gamma(2,c) random variable. The A so that 4ENAE ⫽ 0.001. For models with population
shape parameters  and care chosen so that the means growth, we also set the value ofAso that the expected number
E ⫽ 2 and Ec ⫽ 2c of these distributions correspond of polymorphic sites is 4/kb. In this case a simple formula is
to genome-wide estimates for these parameters, namely an not available but the appropriate value ofAorENAcan be
average mutation rate of 2⫻10⫺8/site/generation and a
re-obtained numerically for any specified value oftonsetand␣, as
combination rate between adjacent base pairs of 1⫻10⫺8/
shown in theappendix.
generation. Hence, we set⫽1⫻10⫺8and
c⫽0.5⫻10⫺8. To complete the model specification under a growth
sce-The central 90% intervals for these distributions are (0.36⫻ nario, the remaining two parameters,tonsetand␣, are allowed
10⫺8, 4.74 ⫻ 10⫺8) and (0.18 ⫻ 10⫺8, 2.37 ⫻ 10⫺8) for to vary over a grid of fixed valuest
onset ⫽1K, 2K, . . . , 8K
andc, respectively. Recent findings point to 10- to 1000-fold generations,␣ ⫽0.5⫻10⫺3, 1⫻10⫺3, . . . , 10⫻10⫺3. Note
variability in recombination rate over 1–2 kb in the MHC that some combinations oftonset,␣, andENAwould be omitted
region (Jeffreyset al.2001). If this heterogeneity of recombi- from consideration since to attain the specified mean number nation rate is indeed typical of the human genome as a whole, of polymorphic sites the corresponding values ofEN0would
our modeling of the variability incmay only partially describe have greatly exceeded the current size of the entire world the true recombinational landscape. population. Smaller values of␣were not considered because Estimates of the neutral mutation rate are based on observed they would result in models virtually indistinguishable from levels of sequence divergence from a great ape outgroup from the equilibrium model.
a number of surveys (NachmanandCrowell2000;Przewor- Simulation procedure: The polymorphism data are
simu-skiet al.2000;ChenandLi2001); these estimates are in good lated using methods ofHudson(1990) for constant and
Slat-agreement with those obtained byFrisseet al.(2001) for the kinandHudson(1991) for variable population size. Specifi-data set analyzed here. Estimates of the recombination rate cally, for a single locus pair and contiguous sequences of fixed are based on the comparison of genome-wide genetic and lengthL, for each combination oftonsetand␣(includingtonset⫽
sequence maps (Yuet al.2001). 0.0 and␣ ⫽ 0.0 corresponding to the constant population We also treat NA, the ancestral effective population size size), and a fixed sample size ofnchromosomes, we generate
(which is identical to N0 in the constant population size independent random realizations following these steps:
model), as a random variable independent of all other
parame-Step 1. Simulate the parameterNAas described above, and
ters. In particular, we let NA be randomly distributed as
compute the current effective population sizeN0.
Gamma(4,A). We note that, with the other parameters fixed
Figure 1.—Empirical cumulative distribu-tion funcdistribu-tions of Tajima’sDand Fu and Li’sD* statistics for a single-locus pair and the sample variance of Tajima’s D (over 10 locus pairs) for (A)␣ ⫽0.5⫻10⫺3and (B) 2.0⫻10⫺3.
scaled mutation rate ⫽4N0Land recombination under the null and alternative hypotheses and observed that,
for a fixed␣, they form a stochastically monotone family of rate ⫽ 4N0cL, where L denotes the length of the
sequence. distributions decreasing as tonset increased, i.e., went farther
away into the past, untilⵑ20Kgenerations, after which the Step 3. Simulate the genealogical history with recombination
events as described byHudson(1983). direction of the change reversed (data not shown). We are interested in testing the hypothesis of a relatively recent popu-Step 4. Simulate mutations on the genealogy assuming an
infinite sites model and rates obtained in step 2. lation expansion (tonset⬍5Kgenerations); thus we limited our
investigation to the time interval where monotonicity applies. For our preliminary investigations of the distribution of the Figure 1 illustrates this observation for two such families of statistics, we considered simulated samples of sequences with empirical distributions—those of Tajima’sDand Fu and Li’s L ⫽10,000 bp, but only the mutations that fell in the two D* statistics. Note that the monotonicity of these families 1-kb flanking segments were considered. The polymorphic of distributions implies monotonicity of power functions sites in the middle 8000 bp were ignored to match the structure (CasellaandBerger1990).
of the locus pair data. This is referred to as simulations of the For all test statistics, we obtained empirical cutoff points for simplified data. For testing the models, a similar scheme was the average value of the statistic over 10 locus pairs correspond-used except that the sequence length and distances between ing to the 5% significance level. Likewise, the critical values the sequenced segments were adjusted to match exactly the of the variance of Tajima’sD over 10 locus pairs were esti-data. This is referred to as simulations of the real esti-data. To mated. The power of each test was assessed as a function of generate samples of several genetically independent regions, the parametert
onsetfor a range of fixed values of growth rate
for a single realization ofNAsteps 2–4 were repeated for all ␣. The empirical density functions can also be used to obtain
unlinked loci in question, keeping the value ofNAthe same Pvalues for the experimental data.
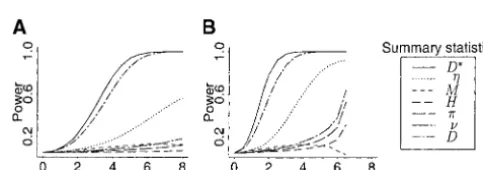
while allowing other parameters to vary randomly from locus The power of a test based on a summary statistic was esti-to locus. This effectively accounts for the mutation and recom- mated by simulating 100,000 realizations from an alternative bination rate heterogeneity between loci. In addition, all real- model in question and counting the number of times the null izations without polymorphic sites were discarded. hypothesis was rejected. The corresponding empirical power Summary statistics and hypotheses testing:Methods for us- functions are shown in Figure 2. The plots clearly indicate ing full data likelihoods are not available or feasible for the that tests based on Tajima’sD and Fu and Li’sD* statistics models tested here with recombination. Hence, we investi- are by far more powerful than all other tests considered. These gated the power of each of the following summary statistics two statistics were used for testing the growth models. In addi-at single-locus pairs to detect recent populaddi-ation growth: the tion, we carried out a test of the equilibrium model on the mean pairwise nucleotide differences,, the sample standard basis of the sample variance of Tajima’sD; the critical values deviation of the pairwise nucleotide difference, for this statistic were estimated on the basis of the same set of simulations described above. The use of this test was
moti- ⫽
冪冢
兺
i⬆jd2 ij
n(n⫺1)
冣
⫺ 2
vated by previous results of a similar test, which suggested a significantly large variance of Tajima’sDin the Chinese sam-ple. However, the test carried out here properly takes into (Hudson 1987), the number of distinct haplotypes in the
sample,M, the haplotype diversity (sample heterozygosity), H, the number of singletons,, Tajima’sDstatistic (Tajima
1989), and Fu and Li’sD* statistic (FuandLi1993; see also
Simonsenet al.1995). The sampling properties of these statis-tics have been studied extensively by a number of authors (Simonsenet al.1995;Pritchardet al.1999) and were shown to be sensitive to population size changes.
In a preliminary investigation, 100,000 independent sam-ples of locus pair sequences were generated using the parame-ters and procedures described above (simulations of the sim-plified data). The behavior of the summary statistics under
different demographic scenarios was compared to choose the Figure2.—Empirical power functions of various summary statistics averaged over 10 independent locus pairs on the most informative one for detecting recent population
expan-sion. basis of a one-tailed test. The null hypothesis is the equilibrium
TABLE 2
Results of the two-tailed multilocus tests for the 10 regions studied
Average Variance of Average
Population Tajima’sD Pvalue Tajima’sD Pvalue Fu and Li’sD* Pvalue
Hausa ⫺0.279 0.368 0.504 0.401 ⫺0.134 0.690
Italians 0.663 0.012 1.399 0.138 0.447 0.088
Chinese 0.046 0.758 1.720 0.038 ⫺0.085 0.818
account the structure of the data and incorporates the effect indistinguishable from the constant population size
of recombination. model. The dashed line in Figure 3 corresponds to
For each value of␣andtonset, a multilocusPvalue for the
points withENA⫽10,000, a value that is often reported
data was estimated as twice (i.e., two-tailed test) the proportion
in human variation studies. This widely reported effective of computer-generated samples with a more extreme average
value of the test statistics than observed. The set of values of population size estimate is based on the implicit assump-␣andtonsetfor which thePvalue was greater than a specified
value constituted our estimated confidence set. Only values of␣ and tonset such that N0is⬍4⫻ 109are considered. All
multilocusPvalues were estimated on the basis of simulations of the real data. Note, however, that the power functions were calculated for a one-tailed test.
RESULTS
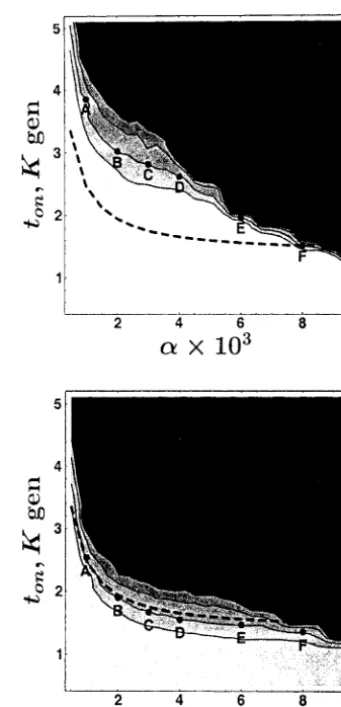
The results of testing the constant population size model are shown in Table 2. Based on the average value of Tajima’sDand Fu and Li’sD*, the Hausa sample is compatible with the constant population size model. In addition, it is compatible with a set of models with recent population growth. The confidence regions for the pa-rameters (␣ and tonset) defining the growth model are
shown in Figure 3. These are the set of parameter values for which the estimatedPvalue is greater than the speci-fied values 0.1, 0.05, 0.02, and 0.01. Such confidence sets show that, for an exponential growth rate as low as 1⫻ 10⫺3/generation, the growth phase is unlikely to
have started earlier thanⵑ50,000 years ago.
As shown in Figure 3, the parameters of the growth model are interdependent: high growth rates are com-patible with the data only for small tonset, and models
with largetonsetare accepted only for small growth rates.
It should be noted that the expectation ofNA is varied
across the confidence region plot with varying values of
␣andtonsetin such a way that the expected number of
polymorphic sites is 4/kb (see materials and meth-ods). This variation of ENA across combinations of ␣
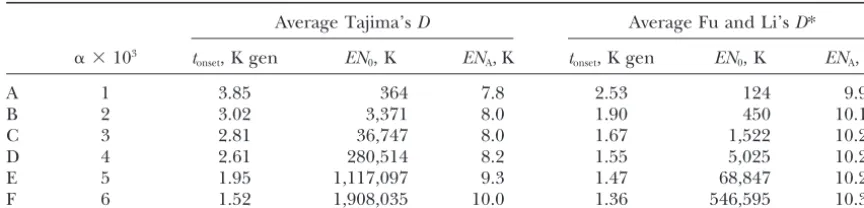
andtonset values is exemplified in Table 3 for six points
(labeled A–F) on the boundary of the 95% confidence set. These values range from 7800 to 10,300, depending
Figure3.—Confidence sets for pairs of parameters (tonset,␣)
on the growth rate and the test statistic applied. For any based on Tajima’sD(top) and Fu and Li’sD* (bottom)
statis-␣value,ENAdecreases with decreasingtonset. Hence, for tics, for the Hausa sample. Shown are the 0.9, 0.95, 0.98, and 0.99 levels. The points A–F on the boundary of the 95% all points in the 95% confidence set with ␣ ⬎ 1 ⫻
confidence set are characterized in Table 3. The dashed line 10⫺3, EN
A must be ⬎7800. As evident in the plot, the
corresponds to the values oftonsetand␣such thatENA⫽10,000.
boundaries of the confidence sets sharply increase as␣
The rejection region is shaded in black. Confidence sets for approaches zero. This implies that although a more the Italian and Chinese samples are not shown because these ancient onset of growth is compatible with the data, samples are incompatible with the constant population size
TABLE 3
Combinations of parameter values on the boundary of the 95% confidence set for the Hausa sample
Average Tajima’sD Average Fu and Li’sD*
␣ ⫻103 t
onset, K gen EN0, K ENA, K tonset, K gen EN0, K ENA, K
A 1 3.85 364 7.8 2.53 124 9.9
B 2 3.02 3,371 8.0 1.90 450 10.1
C 3 2.81 36,747 8.0 1.67 1,522 10.2
D 4 2.61 280,514 8.2 1.55 5,025 10.2
E 5 1.95 1,117,097 9.3 1.47 68,847 10.2
F 6 1.52 1,908,035 10.0 1.36 546,595 10.3
K gen, thousand generations.
tion of an equilibrium population and, as such, is not variance of Tajima’sDin the Italian and Chinese sam-ples, respectively. More complex demographic models equivalent to an estimate of the ancestral population
size in a model that incorporates growth. with population bottlenecks and/or with some degree of geographic substructure in the past may account for In contrast, the Italian data show large positive
aver-age values of Tajima’sDand Fu and Li’sD* across loci. the non-African data.
These conclusions are consistent with the results of The simulations showed that the observed average value
of Tajima’s D is too large to be compatible with the Frisseet al.(2001). However, the analyses carried out here properly take into account the structure of the constant population size model. As expected, recent
population growth shifts the distribution of these statis- data and allow for recombination within each region. As a consequence, in this analysis, the multilocusP val-tics toward smaller values (Figure 1). Thus, it follows that
the Italian sample is also incompatible with the family ues are somewhat lower and reach nominal levels of significance for both the Italian and Chinese samples of growth models tested here (for any positive growth
rate). Likewise, the variance of Tajima’s D across loci (Table 2). It should be noted that no correction for multiple tests was carried out. However, other aspects in the Chinese is significantly too large compared to
the expectations for the constant population size model. of the data corroborate the conclusion of a departure from either the equilibrium or the simple growth mod-Since we showed that the distribution of the variance
of Tajima’sDdecreases monotonically with increasing els. For example, Fay and Wu’sHstatistic (FayandWu 2000) is significant at 4 of the 10 locus pairs (Frisseet time of onset of growth (Figure 1), these results allow
us to rule out both the equilibrium model and the al.2001;Hamblinet al.2002). It has been shown that models of geographic structure may account for this family of growth models tested here. These findings are
consistent with the results inFrisseet al.(2001), which observation (Przeworski 2002). Also, higher-than-pointed to several significant departures from an equi- expected levels of linkage disequilibrium are observed librium model in the non-African population samples. in both non-African samples. These results taken to-gether suggest that a more complicated demographic model is necessary to account for all aspects of the
DISCUSSION polymorphism data in the non-African samples. In
con-trast, we have yet to find an aspect of the Hausa data Our multilocus analysis of noncoding sequences showed
that is incompatible with the equilibrium model or with that the Hausa sample is compatible with a constant
the simple growth model considered here. population size model as well as a model with recent
Despite many attempts to infer the history of popula-population growth if the growth parameter and the time
tion size in humans, a coherent picture has yet to emerge. of initiation of growth are in a constrained range as
A synthesis of the available evidence is complicated by shown in Figure 3. This figure shows a 95% confidence
the heterogeneity of data used, including unlinked au-region based on Tajima’sDand Fu and Li’sD*. For an
tosomal loci as well as nonrecombining uniparentally exponential growth rate of 10⫺3/generation, the earliest
inherited loci such as those in the mtDNA genome and onset compatible with the observed Fu and Li’sD* in
in the nonrecombining portion of the Y chromosome. the Hausa sample is ⵑ50,000 years ago. It should be
A further level of heterogeneity results from the analysis noted that this growth rate is rather small, resulting in
of loci experiencing different mutation processes, namely population size increasing only by a factor of 12 over
nucleotide substitution and insertion/deletion (i.e., mi-50,000 years. If the growth parameter is larger, the onset
crosatellites). Finally, the methods of analysis, the spe-of growth must be more recent than 50,000 years ago.
cific models tested, and the populations sampled vary Conversely, the equilibrium model or models with
greatly across studies. population growth from a population of nontrivial size
mtDNA variation consistent with rapid population growth. polymorphic sites (3.8–24.9), which were thus markedly less than observed at the locus pairs in the Hausa sample These data were used to estimate the time of onset of
growth to an interval that largely overlaps with our esti- (i.e., 47.9 based on Table 2 in Frisse et al. 2001). A study of Y chromosome sequences led to analogous mates for the Hausa sample (RogersandHarpending
1992;Sherryet al.1994;Ingmanet al.2000). However, conclusions (Thomsonet al.2000). A significant excess of rare variants was observed, consistent with rapid pop-our overall results differ from mtDNA findings in
sev-eral important regards. First, mtDNA data show the ulation growth. The TMRCA for a worldwide sample was estimated to be 59,000 years ago (95% central proba-most consistent signal of rapid population expansion
in non-African populations (Di Rienzo and Wilson bility intervals 40,000–140,000) on the basis of a model of exponential growth throughout the history of the 1991; Sherry et al. 1994; Weiss and von Haeseler
1998;Ingmanet al.2000) while substantial heterogene- population. The TMRCA was estimated to be similar (70,000 years ago) on the basis of the average number ity exists across sub-Saharan African populations
(Sherryet al.1994;Watsonet al.1996). Interestingly, of differences between each sequence and the root of the genealogy.
however, a different sample of Hausa showed a
uni-modal distribution of pairwise sequence differences, Overall, the data from uniparentally inherited nonre-combining loci differ markedly from our results in two consistent with rapid population growth in the relatively
recent past (21,000 years ago;Watsonet al.1996). Sec- main respects: the smaller-than-expected ancestral pop-ulation size and the signal of growth in non-African ond, the patterns observed in the mtDNA data are
broadly consistent with a “star-shaped” genealogy (Di samples. While the latter discrepancy might be recon-ciled by more complex demographic models, including RienzoandWilson1991;SlatkinandHudson1991).
MarjoramandDonnelly (1994) showed that such a a population size reduction before expansion (Fayand Wu 1999), the former may require nondemographic pattern is expected only under a specific expansion
model in which a population of very small size (e.g., 500 explanations such as natural selection acting on mtDNA and the Y chromosome (Di RienzoandWilson1991; females for mtDNA or 125 individuals for an autosomal
locus) grows rapidly. This prediction is consistent with Thomsonet al.2000).
Although a number of autosomal microsatellite data estimates of the ancestral population size (i.e., before
growth) obtained on the basis of a model of instanta- sets agree in showing evidence for some population growth, many aspects of the results are incongruous, neous growth applied to mtDNA data that range
be-tween zero and several hundred individuals (Rogers thus hindering any comparison to the locus pair data. Under the assumption of a more general stepwise muta-andHarpending1992). Thus, although our estimates
of the time of onset of growth are largely consistent with tion model, Kimmelet al.(1998) found evidence for a population size reduction followed by expansion in the those obtained on the basis of mtDNA, our estimates of
the ancestral population size appear to be exceedingly non-African samples while the African sample fits the expectations of a constant population size model. These large compared to those based on mtDNA (even when
the fourfold difference expected for uniparentally vs. results are in qualitative agreement with the locus pair data; since no attempt was made at estimating the pa-biparentally inherited loci is taken into account).
Some interesting parallels exist between the mtDNA rameters of the model, it is impossible to compare our conclusions in greater detail. In a different study, a gener-and the Y chromosome findings. Like mtDNA, Y
chro-mosome loci show patterns consistent with rapid growth alized stepwise mutation model was used to test the null model of constant population size (Gonseret al.2000). in most human populations (Pritchard et al. 1999;
Thomsonet al.2000). A variety of methods and models A significant departure in the direction expected under rapid population growth was observed in all non-African have been applied to Y chromosome data to infer the
time of onset of growth.Pritchard et al.(1999) ana- samples as well as in one of two African samples. Under the assumption of a simple stepwise mutation model, lyzed microsatellite data under the assumption of a
gen-eralized stepwise mutation model and the same family ReichandGoldstein(1998) found some evidence for rapid population growth in 3 out of 8 population sam-of expansion models tested here. This analysis led to
estimates of the time of onset of 18,000 years and expo- ples from sub-Saharan Africa and in none of the 12 samples from outside Africa. They estimated the maxi-nential growth rate of 0.008, both consistent with our
Hausa results. As with mtDNA data, however, the ances- mum size of the ancestral population as 6600 individu-als, possibly consistent with the Hausa results for low tral population size is estimated to be much smaller
than our estimate for the Hausa sample, namely 900 growth rates. The time of onset of growth was estimated to range within a 90% confidence interval of 49,000– males [95% confidence interval (C.I.) 50–3200]. To
as-sess the compatibility of the conclusions ofPritchard 640,000 years ago.
Probably due to the similar type of data and demo-et al. (1999) with our data, we calculated the number
of polymorphic sites expected in a sample of 30 chromo- graphic models tested, our results are most consistent with those of WallandPrzeworski(2000) who ana-somes, assuming the above parameter values. For a DNA
interval estimates of the time of onset of exponential than providing confidence intervals for individual pa-growth on the basis of Tajima’s Dand Fu and Li’sD*. rameters, we obtain two-dimensional confidence sets Only the case of an ancestral population of size 10,000 that show the interdependence of the parameters. Un-growing 10-fold and 100-fold is considered (hence, the like Wall and Przeworski (2000) and similarly to exponential growth rate was varied with varying time of Pritchardet al.(1999), we incorporate the uncertainty onset of growth). For the African samples, all eight loci are about the mutation and recombination parameters in compatible with either no expansion or recent expansion, our estimation method.
consistent with our results. However, their confidence It should be noted that, although we have rejected intervals are quite large. In the non-African samples, four simple growth models for the non-African samples, the loci are incompatible with either the constant size or data may be consistent with other scenarios that include the growth models with respect to Tajima’sDwhile two a growth phase as part of a more complex model. In loci are consistent with the growth models only. These this regard, it is interesting to note that a recent analysis results suggest that the variance of Tajima’s Din non- of ascertained single nucleotide polymorphisms in hu-Africans is larger than expected under an equilibrium mans supported a model that included growth in effec-model as we observe in the Chinese sample. tive population size in the context of a subdivided popu-A recent survey of sequence variation in 313 human lation. However, when population subdivision was genes showed a marked skew toward negative Tajima’s removed from the model, a simple equilibrium model Dvalues (Stephenset al.2001), which was interpreted could not be rejected (Wakeleyet al.2001). It follows as evidence in favor of population expansion. However, that, when the equilibrium model cannot be rejected, this analysis involved only a pooled sample of four differ- more complex models may require some form of popu-ent ethnic groups from the United States. In our data, lation growth to be compatible with the data.
pooling samples from different ethnic groups results in
We thank M. Przeworski, J. Pritchard, P. Donnelly, and S. Zoellner
a more negative average Tajima’s Dthan observed in
for comments on the manuscript. This work was supported by a
Na-the individual samples (data not shown). This raises Na-the tional Institutes of Health grant (HG02098) to A.D. possibility that population-specific patterns of frequency
spectrum are obscured in pooled samples and makes the interpretation of the global pattern questionable.
Our data and methods of analyses have several advan- LITERATURE CITED
tages over those of earlier studies. The use of single- Abramovitz, M.,andI. A. Stegun,1964 Handbook of Mathematical nucleotide substitution rather than microsatellite data Functions.Dover, New York.
Brookfield, J. F.,1997 Importance of ancestral DNA ages. Nature
implies better estimates of the mutation rate at each
388:134.
locus and hence more reliable estimates of population
Casella, G.,andR. L. Berger,1990 Statistical Inference.Warsworth &
parameters. Furthermore, avoiding coding regions re- Brooks/Cole, Pacific Grove, CA.
Chen, F. C., andW. H. Li, 2001 Genomic divergences between
duces the probability that patterns of variation were
humans and other hominoids and the effective population size
shaped by natural selection rather than demography.
of the common ancestor of humans and chimpanzees. Am. J.
The availability of sequence data from several indepen- Hum. Genet.68:444–456.
Di Rienzo, A.,andA. C. Wilson,1991 Branching pattern in the
dent loci in exactly the same population samples also
evolutionary tree for human mitochondrial DNA. Proc. Natl.
eliminates the possibility that the observed interlocus
Acad. Sci. USA88:1597–1601.
variability is due to the different histories of the popula- Di Rienzo, A., P. Donnelly, C. Toomajian, B. Sisk, A. Hillet al., tions surveyed at different loci. Since evolutionary pro- 1998 Heterogeneity of microsatellite mutations within and be-tween loci, and implications for human demographic histories.
cesses are highly stochastic, demographic inferences
Genetics148:1269–1284.
must of necessity rely on the analysis of many indepen- Fay, J. C.,andC.-I Wu,1999 A human population bottleneck can dent loci. Unless natural selection is thought to act on account for the discordance between patterns of mitochondrial versus nuclear DNA variation. Mol. Biol. Evol.16:1003–1005.
a specific subset of the loci, any demographic model
Fay, J. C.,andC.-I Wu,2000 Hitchhiking under positive Darwinian
should account for the data atallloci. Thus, a
simultane-selection. Genetics155:1405–1413.
ous analysis of multiple independent loci will lead to Forsythe, G. E., M. A. MalkolmandC. B. Moler,1977 Computer
Methods for Mathematical Computations.Prentice-Hall, Englewood
better estimates and more powerful tests. Accordingly,
Cliffs, NJ.
our multilocus analysis led to narrower confidence
inter-Frisse, L., R. R. Hudson, A. Bartoszewicz, J. D. Wall, J. Donfack
vals and more easily interpretable results compared to et al., 2001 Gene conversion and different population histories those inWallandPrzeworski(2000) that were based may explain the contrast between polymorphism and linkage
disequilibrium levels. Am. J. Hum. Genet.69:831–843.
on a set of single-locusPvalues. Also, our demographic
Fu, Y.-X.,andW.-H. Li,1993 Statistical tests of neutrality of
muta-model is more general than that ofWallandPrzewor- tions. Genetics133:693–709.
ski(2000), in that a full range of ancestral population Gonser, R., P. Donnelly, G. NicholsonandA. Di Rienzo,2000 Microsatellite mutations and inferences about human
demogra-size and growth rate was considered, and is more general
phy. Genetics154:1793–1807.
than a model of exponential growth throughout the
Griffiths, R. C.,andS. Tavare´,1998 The age of a mutation in a
history of the population. Our model is virtually identi- general coalescent tree. Commun. Stat. Stoch. Models14:273–
295.
Hamblin, M. T., E. E. ThompsonandA. Di Rienzo,2002 Complex Weiss, G.,and A. von Haeseler, 1998 Inference of population history using a likelihood approach. Genetics149:1539–1546. signatures of natural selection at the Duffy blood group locus.
Yu, A., C. Zhao, Y. Fan, W. Jang, A. J. Mungallet al., 2001 Compari-Am. J. Hum. Genet.70:369–373.
son of human genetic and sequence-based physical maps. Nature
Hudson, R. R.,1983 Properties of a neutral allele model with
intra-409:951–953. genic recombination. Theor. Popul. Biol.23:183–201.
Zhivotovsky, L. A., L. Bennett, A. M. BowcockandM. W. Feldman, Hudson, R. R.,1987 Estimating the recombination parameter of a
2000 Human population expansion and microsatellite varia-finite population model without selection. Genet. Res.50:245–
tion. Mol. Biol. Evol.17:757–767. 250.
Hudson, R. R.,1990 Gene genealogies and the coalescent process.
Communicating editor:N. Takahata
Oxf. Surv. Evol. Biol.7:1–44.
Ingman, M., H. Kaessmann, S. PaaboandU. Gyllensten, 2000 Mitochondrial genome variation and the origin of modern hu-mans. Nature408:708–713.
Jeffreys, A. J., L. KauppiandR. Neumann,2001 Intensely punctate
APPENDIX
meiotic recombination in the class II region of the major
histo-compatibility complex. Nat. Genet.29:217–222. Here, we compute the expected value of
NA
condi-Kimmel, M., R. Chakraborty, J. P. King, M. Bamshad, W. S. Watkins
tional on the expected number of polymorphismsSnin et al., 1998 Signatures of population expansion in microsatellite
repeat data. Genetics148:1921–1930. the sample. We begin by deriving the expression for the
Marjoram, P., andP. Donnelly, 1994 Pairwise comparisons of expected numberES
nof polymorphic sites in a sample of
mitochondrial DNA sequences in subdivided populations and
haploid sizenas a function of NAand the parameters
implications for early human evolution. Genetics136:673–683.
Nachman, M. W.,andS. L. Crowell,2000 Estimate of the mutation of the evolution model. First, assume that NA and the
rate per nucleotide in humans. Genetics156:297–304. mutation rateare constants rather than random
vari-Press, W. H., S. A. Teukolsky, W. T. VetterlingandB. P. Flannery,
ables. This assumption is not required for the
recombi-1996 Numerical Recipes in Fortran 90: The Art of Parallel Scientific
Computing.Cambridge University Press, Cambridge, UK. nation rate since the only property it affects is the
vari-Pritchard, J. K., M. T. Seielstad, A. Perez-Lezaun andM. W. ance ofS
n.
Feldman,1999 Population growth of human Y chromosomes:
In the infinite sites model of mutation under standard
a study of Y chromosome microsatellites. Mol. Biol. Evol.16:1791–
1798. coalescent theory,Snis identical to the number of
muta-Przeworski, M.,2002 The signature of natural selection at ran- tions on a coalescent tree since the most recent common domly chosen loci. Genetics160:1179–1189.
ancestor of the sample and is given by
Przeworski, M., R. R. HudsonandA. Di Rienzo,2000 Adjusting the focus on human variation. Trends Genet.16:296–302.
Reich, D.,andD. Goldstein,1998 Genetic evidence for a Paleo- ES
n⫽
2ELn, (A1)
lithic human population expansion in Africa. Proc. Natl. Acad. Sci. USA95:8119–8123.
Reich, D. E.,andE. S. Lander,2001 On the allelic spectrum of where ⫽4lN
0⫽4lg(tonset)NAis the scaled mutation
human disease. Trends Genet.17:502–510.
rate per sequence of lengthl, andELnis the expected
Rogers, A. R.,andH. Harpending,1992 Population growth makes
waves in the distribution of pairwise genetic differences. Mol. length of the ancestral tree (i.e., the total length of all Biol. Evol.9:552–569. branches). This relationship holds for all models of
Severini, T. A.,1999 On the relationship between Bayesian and
demographic history of the population, in particular,
non-Bayesian elimination of nuisance parameters. Stat. Sinica9:
713–724. for the exponential growth model in whichg(tonset)⬅
Sherry, S. T., A. R. Rogers, H. Harpending, H. Soodyall, T. Jen- G⫽e␣tonset.
kinset al., 1994 Mismatch distributions of mtDNA reveal recent
To find the expression for ELn in terms of NA and
human population expansions. Hum. Biol.66:761–775.
Simonsen, K. L., G. A. ChurchillandC. F. Aquadro,1995 Proper- other parameters, we note thatLncan be partitioned as
ties of statistical tests of neutrality for DNA polymorphism data.
Genetics141:413–429. L
n⫽ Lcn⫹Lgn, (A2)
Slatkin, M.,andR. R. Hudson,1991 Pairwise comparisons of
mito-chondrial DNA sequences in stable and exponentially growing where Lc
n and Lgn are the parts of the ancestral tree
populations. Genetics129:555–562.
corresponding to the constant and growth phase,
re-Stephens, J. C., J. A. Schneider, D. A. Tanguay, J. Choi, T. Acharya
et al., 2001 Haplotype variation and linkage disequilibrium in spectively. We observe that
313 human genes. Science293:489–493.
Stephens, M.,andP. Donnelly,2000 Inference in molecular popu- ELn⫽
冮
∞0[EAn(t)⫺P(An(t)⫽ 1)]dt, (A3)
lation genetics. J. R. Stat. Soc. B62:605–635.
Tajima, F.,1989 Statistical method for testing the neutral mutation
whereAn(t) is the number of ancestors of the sample
hypothesis by DNA polymorphism. Genetics123:585–595.
Thomson, R., J. K. Pritchard, P. Shen, P. J. OefnerandM. W. at timetin the past. For a sample from an exponentially
Feldman,2000 Recent common ancestry of human Y chromo- growing panmictic population, somes: evidence from DNA sequence data. Proc. Natl. Acad. Sci.
USA97:7360–7365.
Wakeley, J., R. Nielsen, S. N. Liu-Cordero and K. Ardlie, EAn(t)⫽ 1⫹
兺
n
k⫽2
e⫺(k(k⫺1)/2)⌳(t)(2k⫺ 1)n[k]
n(k)
, (A4)
2001 The discovery of single-nucleotide polymorphisms—and inferences about human demographic history. Am. J. Hum.
Genet.69:1332–1347. and
Wall, J. D.,andM. Przeworski,2000 When did the human popula-tion size start increasing? Genetics155:1865–1874.
P(An(t)⫽1)⫽1⫹
兺
nk⫽2
(⫺1)k⫺1e⫺(k(k⫺1)/2)⌳(t) (2k ⫺1)n[k]
n(k)
Watson, E., K. Bauer, R. Aman, G. Weiss, A. von Haeseleret al., 1996 mtDNA sequence diversity in Africa. Am. J. Hum. Genet.
(GriffithsandTavare´1998), where⌳(t)⫽(e ⫺1)/ P(Ag
n(tonset)⫽k)⫽
兺
l⫽ke⫺(l(l⫺1)/2)⌳(tonset)(2l⫺1)(⫺1) k(l⫺1)n[l]
k!(l⫺k)!n(l)
. 2␣GNA,n[k]⫽n(n⫺1) · · · (n⫺k⫹1), andn(k)⫽n(n⫹
(A8) 1) · · · (n ⫹ k⫺ 1). Hence, similarly to Slatkinand
The factor of 1/Gin expression (A7) is due to different Hudson(1991),
timescales forAg
n(t) andAcn(t).
ELg n⫽
冮
tonset
0 [EAn(t)⫺P(An(t)⫽1)]dt For relatively small sample sizes (n⬍25), expressions
(A6) and (A7) can be easily evaluated by means of, for instance, the Numerical Recipes software package
⫽
兺
k⫽2,4,...,n
2(2k⫺1)n[k]
n(k)
冮
tonset0 e
⫺(k(k⫺1)/2)⌳(t)dt
(Press et al.1996) for a range of values ofNAand fixed
values of,␣, andtonset. For largern, numerical
evalua-⫽ 1
␣GNA
兺
n/2
k⫽1
(4k⫺1)n[2k]
n(2k)
ek(2k⫺1)/(2␣GNA)
tion of (A7) becomes increasingly unstable due to a so-called “catastrophic cancellation” (Forsythe et al. 1977) in the alternating summation (A8). One way of
⫻
冤
E1冢
k(2k⫺1) 2␣GNA
冣
⫺ E1
冢
k(2k⫺1) 2␣NA
冣冥
, (A6)
getting around this problem is to utilize the 64-bit (quad-ruple-precision) arithmetic available on Sun SPARC and where E1(·) is the exponential integral (Abramovitz Power PC workstations. Another is to avoid the “exact,”
andStegun1964).
but unstable, calculations in (A8) altogether and instead By the Markov property of the ancestral processAn(t),
solve numerically the system of differential equations, ELc
n⫽
冮
∞
tonset[EAn(t)⫺P(An(t)⫽1)]dt
y˙i ⫽yi⫹ iyi⫺1, i⫽
冢
i2
冣
, i⫽l, . . . ,n, (A9)⫽
冮
∞0
兺
n
k⫽2
E(Ac
n(t)|Acn(0)⫽ k)P(Agn(tonset)⫽ k)dt
which gives rise to (A8). A Fortran 95 program that implements both of these approaches is available from
⫽ 2
G
兺
n
k⫽2
P(Ag
n(tonset)⫽ k)
兺
k⫺1j⫽1
1
j, (A7) the authors.
Finally, solving Equation A1 numerically with respect toNAyields the desired result. Note that for a random,
where Ag
n(t) and Acn(t) refer to the ancestral process
during the growth and constant periods, respectively, rather than fixed,NA this gives only an approximation
forENA; however, the approximation is sufficiently
accu-and the probability distribution ofAg
n(tonset) (Griffiths