ABSTRACT
BARTHOLOMEW, NATHANAEL. Polyacrylamide For Turbidity Control in Runoff: Effects of Polyacrylamide, Soil, and Solution Properties. (Under the direction of Richard McLaughlin).
Eroded soil discharged from construction sites is a major water quality issue. North Carolina regulations require that the turbidity of discharged waters from
construction sites to non-trout streams or reservoirs not exceed 50 nephelometer turbidity units (NTU) and 10 NTU in trout waters. Polyacrylamide (PAM) has been demonstrated to reduce erosion and turbidity in runoff, but there is little information on the interactions between PAM properties and that of the water or suspended solids. Our study tested eight PAM products (Cytec Superfloc A100, A110, A150, N300, 1606; Ciba Soilfix Polybead; Applied Polymer Systems 705; Chemtall 923VHM) at concentrations from 0 to 10 mg L-1 for turbidity reduction in suspensions of 13 soils from active construction sites around North Carolina. For five soil suspensions, with turbidities of up to 3000 NTU, PAM reduced turbidity to below 50 NTU in 30 s. In addition turbidity reductions to the 10 NTU level were observed for two soils. Overall, turbidity reductions of greater than 86% were achieved for all soils. Optimal PAM concentrations of soils tested were 1-2 mg L-1, with higher concentrations causing turbidity increases in some soils.
with different molecular weights and charge density, was the only polymer that
Polyacrylamide For Turbidity Control in Runoff: Effects of Polyacrylamide, Soil, and Solution Properties.
by
NATHANAEL BARTHOLOMEW
A thesis submitted to the Graduate Faculty of North Carolina State University in partial fulfillment of the requirements for the Degree of Master of Science
DEPARTMENT OF SOIL SCIENCE
Raleigh 2003
Approved by:
____________________________ Dr. R. A. McLaughlin Chair of Advisory Committee
__________________________ ________________________
Biography
Nathanael Bartholomew was born April 12, 1977 in Payson, Utah. He spent most of his childhood in Springville, Utah. During his high school years, Nathanael became interested in science. He began his studies at Brigham Young University in Chemical Engineering. After one year of college, Nathanael spent the next two years as a
missionary for the Church of Jesus Christ of Latter-day Saints in Sweden. After coming home Nathanael decided to change majors and after taking an introduction to soil science class by Bruce Webb ended up in Agronomy with an emphasis in Environmental Science. Nathanael was involved with many undergraduate research projects in the Agronomy Department. The studies included: 1) sodic soil reclamation using gypsum,
Acknowledgements
There are many people that I would like to recognize for their support leading to the completion of my M.S. degree. First I would like to thank my wife for her patience during the last two years. I’d like to thank her for always sticking with me even when I haven’t used my head. I’d like to thank her for the support that leads to good grades and a completed degree. Next I would like to thank my parents for the way that they brought me up. Dad always taught me that I needed to be proud of what I do. I’d like to
acknowledge my advisor, Rich for being patient with me even when he probably thought that things would never get done. Also, I’d like to thank him for his quiet support and good example of how to do research and how to effectively present research at
professional meetings. I’d like to thank Dr. Dean Hesterberg for his support and
Table of Contents
List of Figures ………..v
List of Tables ……….xii
Introduction ………1
PAM Background ……….4
Flocculation ………..6
Environmental Issues ………..10
References ………...14
Polyacrylamide and Soil Interactions Introduction ……….22
Materials and Methods ………26
Soil Analysis ………...26
PAM Interactions .………...28
Mixed Polymers ………..31
Results and Discussion ………...32
Soil Analysis ………...……….32
PAM Interactions ………...………..33
Statistical Analysis ………..38
Mixed Polymer ………...………..41
Conclusions ……….42
References ………...43
Combined Gypsum and PAM Treatment Introduction ……….77
Materials and Methods ………80
Results and Discussion ………82
Conclusions ……….87
References ………...88
List of Figures
Page
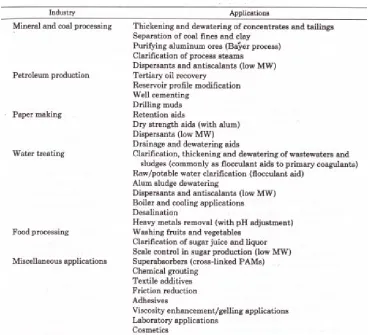
Figure 1.1 Industrial applications of anionic polyacrylamide (Barvenik, 1994). 17
Figure 1.2 Copolymerization of acrylamide and acryloyloxyethyl-trimethyl
ammonium chloride to form cationic PAM (Barvenik, 1994). 18
Figure 1.3 Nonionic PAM polymerization (Barvenik, 1994). 19
Figure 1.4 Copolymerization of acrylamide and sodium acrylate to form
anionic PAM (Barvenik, 1994). 20
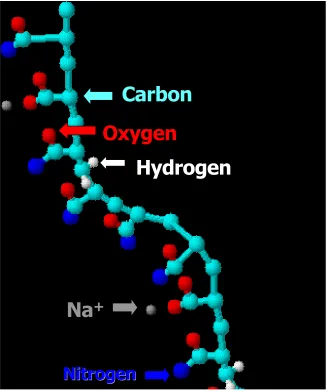
Figure 1.5 Molecular structure of anionic PAM. 21
Figure 2.1 Mineral content of coarse (2 – 0.2 mm) and fine (< 0.2 mm)
clay fractions of typical North Carolina soils (Coleman et al., 1949). 45
Figure 2.2 Soil sample numbers coincide with the highway division they
originated from. 46
Figure 2.3 Example of Initial PAM testing using soil 11 from the Mountain
Region. Figure shown in linear-log scale. 47
Figure 2.4 Turbidity reduction as a function of input concentration for four PAM products differing in charge density (c.d.) (percent hydrolysis) and molecular weight (in Mg mol-1) over nine concentrations on soil sample 9. For each PAM concentration, data points with different letters are significantly different
(p = 0.05). Figure shown in linear-log scale. 48
Figure 2.5 Turbidity reduction as a function of input concentration for four PAM products differing in charge density (c.d.) (percent hydrolysis) and molecular weight (in Mg mol-1) over nine concentrations on soil sample 5. For each PAM concentration, data points with different letters are significantly different
(p = 0.05). Figure shown in linear-log scale. 49
Figure 2.6 Turbidity reduction as a function of input concentration for four PAM products differing in charge density (c.d.) (percent hydrolysis) and molecular weight (in Mg mol-1) over nine concentrations on soil sample 12. For each PAM concentration, data points with different letters are significantly different
(p = 0.05). Figure shown in linear-log scale. 50
weight (in Mg mol-1) over nine concentrations on soil sample 13. For each PAM concentration, data points with different letters are significantly different
(p = 0.05). Figure shown in linear-log scale. 51
Figure 2.8 Turbidity reduction as a function of input concentration for five PAM products differing in charge density (c.d.) (percent hydrolysis) and molecular weight (in Mg mol-1) over nine concentrations on soil sample 11. For each PAM concentration, data points with different letters are significantly different
(p = 0.05). Figure shown in linear-log scale. 52
Figure 2.9 Turbidity reduction as a function of input concentration for four PAM products differing in charge density (c.d.) (percent hydrolysis) and molecular weight (in Mg mol-1) over nine concentrations on soil sample 7. For each PAM concentration, data points with different letters are significantly different
(p = 0.05). Figure shown in linear-log scale. 53
Figure 2.10 Turbidity reduction as a function of input concentration for four PAM products differing in charge density (c.d.) (percent hydrolysis) and molecular weight (in Mg mol-1) over nine concentrations on soil sample 14. For each PAM concentration, data points with different letters are significantly different
(p = 0.05). Figure shown in linear-log scale. 54
Figure 2.11 Turbidity reduction as a function of input concentration for five PAM products differing in charge density (c.d.) (percent hydrolysis) and molecular weight (in Mg mol-1) over nine concentrations on soil sample 2. For each PAM concentration, data points with different letters are significantly different
(p = 0.05). Figure shown in linear-log scale. 55
Figure 2.12 Turbidity reduction as a function of input concentration for five PAM products differing in charge density (c.d.) (percent hydrolysis) and molecular weight (in Mg mol-1) over nine concentrations on soil sample 3. For each PAM
concentration, data points with different letters are significantly different
(p = 0.05). Figure shown in linear-log scale. 56
Figure 2.13 Turbidity reduction as a function of input concentration for four PAM products differing in charge density (c.d.) (percent hydrolysis) and molecular weight (in Mg mol-1) over nine concentrations on soil sample 6. For each PAM concentration, data points with different letters are significantly different
(p = 0.05). Figure shown in linear-log scale. 57
Figure 2.14 Turbidity reduction as a function of input concentration for four PAM products differing in charge density (c.d.) (percent hydrolysis) and molecular weight (in Mg mol-1) over nine concentrations on soil sample 8. For each PAM concentration, data points with different letters are significantly different
Figure 2.15 Turbidity reduction as a function of input concentration for five PAM products differing in charge density (c.d.) (percent hydrolysis) and molecular weight (in Mg mol-1) over nine concentrations on soil sample 1. For each PAM concentration, data points with different letters are significantly different
(p = 0.05). Figure shown in linear-log scale. 59
Figure 2.16 Turbidity reduction as a function of input concentration for four PAM products differing in charge density (c.d.) (percent hydrolysis) and molecular weight (in Mg mol-1) over nine concentrations on soil sample 4. For each PAM concentration, data points with different letters are significantly different
(p = 0.05). Figure shown in linear-log scale. 60
Figure 2.17 Comparison of treatments involving low and high molecular weight PAMs. For each PAM concentration, data points with different letters
are significantly different (p = 0.05). Figure shown in linear-log scale. 61
Figure 2.18 Comparison of treatments involving low and high molecular weight PAMs. For each PAM concentration, data points with different letters are significantly different (p = 0.05). Figure shown in linear-log scale. 62
Figure 3.1 Soil sample numbers coincide with the highway division they originated from. Soil samples used in gypsum evaluation came from 1, 2, 3, 4,
8, 11 and 13 (NCDOT Divisions). 90
Figure 3.2 Turbidity reduction as a function of input PAM concentration. Flocculation by Superfloc A110 (18% charge density, 15 Mg mol –1 molecular weight) alone and with gypsum at four different concentrations on soil 8.For each PAM concentration, data points with different letters are significantly different (p = 0.05). The “0” data point for PAM is graphed at 0.01 due to limitations in
using a linear-log scale. 91
Figure 3.3 Turbidity reduction as a function of input PAM concentration. Flocculation by Chemtall 923VHM (30% charge density, 14-17.5 Mg mol –1 molecular weight) alone and with gypsum at four different concentrations on soil 8.For each PAM concentration, data points with different letters are significantly different (p = 0.05). The “0” data point for PAM is graphed at
0.01 due to limitations in using a linear-log scale. 92
Figure 3.4 Turbidity reduction as a function of input PAM concentration. Flocculation by Ciba Soilfix (30% charge density, 15 Mg mol –1 molecular weight) alone and with gypsum at four different concentrations on soil 8.For each PAM concentration, data points with different letters are significantly different (p = 0.05). The “0” data point for PAM is graphed at 0.01 due to
Figure 3.5 Turbidity reduction as a function of input PAM concentration. Flocculation by APS 705 (mixed charge density, mixed molecular weight) alone and with gypsum at four different concentrations on soil 8.For each PAM concentration, data points with different letters are significantly different (p = 0.05). The “0” data point for PAM is graphed at 0.01 due to limitations
in using a linear-log scale. 94
Figure 3.6 Turbidity reduction as a function of input PAM concentration. Flocculation by APS 706b (block) (mixed charge density, mixed molecular weight) alone and with gypsum at four different concentrations on soil 8.For each PAM concentration, data points with different letters are significantly different (p = 0.05). The “0” data point for PAM is graphed at 0.01 due to
limitations in using a linear-log scale. 95
Figure 3.7 Turbidity reduction as a function of input PAM concentration with no gypsum and 5 different PAM products on soil 8. For each PAM
concentration, data points with different letters are significantly different (p = 0.05). The “0” data point for PAM is graphed at 0.01 due to limitations
in using a linear-log scale. 96
Figure 3.8 Turbidity reduction as a function of input PAM concentration with 10 mg L-1 gypsum and 5 different PAM products on soil 8. For each PAM concentration, data points with different letters are significantly different (p = 0.05). The “0” data point for PAM is graphed at 0.01 due to limitations
in using a linear-log scale. 97
Figure 3.9 Turbidity reduction as a function of input PAM concentration with 20 mg L-1 gypsum and 5 different PAM products on soil 8. For each PAM concentration, data points with different letters are significantly different (p = 0.05). The “0” data point for PAM is graphed at 0.01 due to limitations
in using a linear-log scale. 98
Figure 3.10 Turbidity reduction as a function of input PAM concentration with 50 mg L-1 gypsum and 5 different PAM products on soil 8. For each PAM concentration, data points with different letters are significantly different (p = 0.05). The “0” data point for PAM is graphed at 0.01 due to limitations
in using a linear-log scale. 99
Figure 3.11 Turbidity reduction as a function of input PAM concentration with 100mg L-1 gypsum and 5 different PAM products on soil 8. For each PAM concentration, data points with different letters are significantly different (p = 0.05). The “0” data point for PAM is graphed at 0.01 due to limitations
in using a linear-log scale. 100
for soil sample 11. The “0” data point for PAM is graphed at 0.01 due to
limitations in using a linear-log scale. 101
Figure 3.13 Turbidity reduction by Superfloc A100 (7% charge density, 16 Mg mol-1 molecular weight) alone and with gypsum at three different concentrations for soil sample 13. The “0” data point for PAM is graphed at 0.01 due to
limitations in using a linear-log scale. 102
Figure 3.14 Turbidity reduction by Superfloc A100 (7% charge density, 16 Mg mol-1 molecular weight) alone and with gypsum at four different concentrations for soil sample 1. The “0” data point for PAM is graphed at 0.01 due to
limitations in using a linear-log scale. 103
Figure 3.15 Turbidity reduction by Superfloc A100 (7% charge density, 16 Mg mol-1 molecular weight) alone and with gypsum at three different concentrations for soil sample 2. The “0” data point for PAM is graphed at 0.01 due to
limitations in using a linear-log scale. 104
Figure 3.16 Turbidity reduction by Superfloc A100 (7% charge density, 16 Mg mol-1 molecular weight) alone and with gypsum at three different concentrations for soil sample 4. The “0” data point for PAM is graphed at 0.01 due to
limitations in using a linear-log scale. 105
Figure 3.17 Turbidity reduction by Superfloc A100 (7% charge density, 16 Mg mol-1 molecular weight) alone and with gypsum at three different concentrations for soil sample 3. The “0” data point for PAM is graphed at 0.01 due to
limitations in using a linear-log scale. 106
Figure A.1 X-ray diffraction patterns for phyllosilicate mineralogy of the fine clay fraction of soil sample 1. Numbers above peaks are d-spacings in
nanometers. 111
Figure A.2 X-ray diffraction patterns for phyllosilicate mineralogy of the coarse clay fraction of soil sample 1. Numbers above peaks are d-spacings in
nanometers. 112
Figure A.3 X-ray diffraction patterns for phyllosilicate mineralogy of the fine clay fraction of soil sample 2. Numbers above peaks are d-spacings in
nanometers. 113
Figure A.4 X-ray diffraction patterns for phyllosilicate mineralogy of the coarse clay fraction of soil sample 2. Numbers above peaks are d-spacings in
Figure A.5 X-ray diffraction patterns for phyllosilicate mineralogy of the fine clay fraction of soil sample 3. Numbers above peaks are d-spacings in
nanometers. 115
Figure A.6 X-ray diffraction patterns for phyllosilicate mineralogy of the coarse clay fraction of soil sample 3. Numbers above peaks are d-spacings in
nanometers. 116
Figure A.7 X-ray diffraction patterns for phyllosilicate mineralogy of the fine clay fraction of soil sample 4. Numbers above peaks are d-spacings in
nanometers. 117
Figure A.8 X-ray diffraction patterns for phyllosilicate mineralogy of the coarse clay fraction of soil sample 4. Numbers above peaks are d-spacings in
nanometers. 118
Figure A.9 X-ray diffraction patterns for phyllosilicate mineralogy of the fine clay fraction of soil sample 5. Numbers above peaks are d-spacings in
nanometers. 119
Figure A.10 X-ray diffraction patterns for phyllosilicate mineralogy of the coarse clay fraction of soil sample 5. Numbers above peaks are d-spacings in
nanometers. 120
Figure A.11 X-ray diffraction patterns for phyllosilicate mineralogy of the fine clay fraction of soil sample 6. Numbers above peaks are d-spacings in
nanometers. 121
Figure A.12 X-ray diffraction patterns for phyllosilicate mineralogy of the coarse clay fraction of soil sample 6. Numbers above peaks are d-spacings in
nanometers. 122
Figure A.13 X-ray diffraction patterns for phyllosilicate mineralogy of the fine clay fraction of soil sample 7. Numbers above peaks are d-spacings in
nanometers. 123
Figure A.14 X-ray diffraction patterns for phyllosilicate mineralogy of the coarse clay fraction of soil sample 7. Numbers above peaks are d-spacings in
nanometers. 124
Figure A.15 X-ray diffraction patterns for phyllosilicate mineralogy of the fine clay fraction of soil sample 9. Numbers above peaks are d-spacings in
nanometers. 125
nanometers. 126
Figure A.17 X-ray diffraction patterns for phyllosilicate mineralogy of the fine clay fraction of soil sample 11. Numbers above peaks are d-spacings in
nanometers. 127
Figure A.18 X-ray diffraction patterns for phyllosilicate mineralogy of the coarse clay fraction of soil sample 11. Numbers above peaks are d-spacings in
nanometers. 128
Figure A.19 X-ray diffraction patterns for phyllosilicate mineralogy of the fine clay fraction of soil sample 13. Numbers above peaks are d-spacings in
nanometers. 129
Figure A.20 X-ray diffraction patterns for phyllosilicate mineralogy of the coarse clay fraction of soil sample 13. Numbers above peaks are d-spacings in
List of Tables
Page
Table 2.1 PAM products used in initial evaluation of PAM interactions. 63
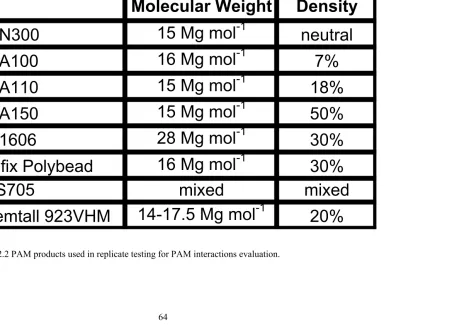
Table 2.2 PAM products used in replicate testing for PAM interactions
evaluation. 64
Table 2.3 PAM products used in mixed polymer evaluation. 65
Table 2.4 Properties for soils that had 98 to 99.7% reductions in suspension
turbidity with PAM (2 mg L-1). 66
Table 2.5 Properties for soils that had diminished turbidity reduction at PAM
concentrations greater than 1 mg L-1. 67
Table 2.6 Properties for soils that had a little flocculation with PAM at lower
concentrations (< 1 mg L-1), but flocculated at higher PAM concentrations. 68 Table 2.7 Properties for soils that had a little or no flocculation with any single component PAM. APS705 (commercially mixed) PAM was the only effective
polymer. 69
Table 2.8 Stepwise regression results on the effect of soil properties on PAM (Superfloc A100) effectiveness for soil samples with kaolinite as the dominant clay mineralogy. All other soil properties were not significant at p = 0.05. 70
Table 2.9 Summary of individual regression analysis on the effect of soil properties on PAM effectiveness (Superfloc A100) for soil samples with
kaolinite as the dominant clay mineralogy. 71
Table 2.10 Stepwise regression results on the effect of soil properties on PAM effectiveness (Superfloc A100) for soil samples with > 20% smectite or vermiculite clay mineralogy. All other soil properties were not significant
at p = 0.05. 72
Table 2.11 Summary of individual regression analysis on the effect of soil properties on PAM effectiveness (Superfloc A100) for soil samples with > 20%
smectite or vermiculite clay mineralogy. 73
Table 2.12 Stepwise regression results on the effect of soil properties on PAM effectiveness (Superfloc A100) for all 13 NC DOT soil samples. All other soil
Table 2.13 Pearson correlation coefficients for sand correlation to all other soil
properties. 75
Table 2.14 Summary of individual regression analysis on the effect of soil properties on PAM effectiveness (Superfloc A100) for all 13 NC DOT soil
samples. 76
Table 3.1 Comparison of the amount of smectite and vermiculite in the clay fraction of recalcitrant soils (1, 2, 4, 6, 7) with soils that had turbidity reductions
(with PAM) that met the 50 NTU standard (5, 9, 11, 13). 107
Table 3.2 Properties of PAM products used in gypsum evaluation. All polymers
except SF A100 were used in replicate testing (soil 8). 108
Table 3.3 Table comparing the soil properties of the four Coastal Plain soils. 109
Table A.1 Average NTU readings for soils with the most effective flocculation with PAM. For each PAM concentration, data points with different letters are
significantly different (p = 0.05). 131
Table A.2 Average NTU readings for soils with diminished turbidity reduction at high PAM concentrations. For each PAM concentration, data points with
different letters are significantly different (p = 0.05). 132
Table A.3 Average NTU readings for soils with little flocculation at low PAM concentrations. For each PAM concentration, data points with different letters
are significantly different (p = 0.05). 133
Table A.4 Average NTU readings for soils with minimal PAM effect (except APS705). For each PAM concentration, data points with different letters are
significantly different (p = 0.05). 134
Table A.5 Statistical significance of flocculant treatment by gypsum
concentration for soil 8 (lsd α=0.05). 135
Table A.6 Statistical significance of gypsum concentration by PAM
Introduction
Eroded soil discharged from construction sites is a major water quality issue. Erosion
from construction sites accounts for approximately 5.4 X 10⁸ Mg yr-1 solids discharged into
surface waters (Przepiora et al., 1998). Sediment carried from construction sites causes
increases in the turbidity of natural waters. This turbidity keeps sunlight from penetrating
into water by both reflecting and absorbing light. In slow moving water, light absorption
causes increases in water temperature and decreases of oxygen mixing into deeper waters.
Reduction in light decreases the growth of benthic macrophytes. High turbidity waters also
have reduced aquatic plant (phytoplankton) growth. Decreased phytoplankton growth
reduces the food source for zooplankton and fish larvae. Turbidity can also have negative
effects on normal fish hatching. Direct, lethal effects on adult fish are rarely seen, but high
levels of suspended solids are associated with gill damage and abrasion (Clark et al., 1985).
Rainbow trout (Salmo gairdneri) develop a higher incidence of fin rot when exposed to high
turbidity waters for several months. In general, fish populations are indirectly reduced
because of high turbidity by: 1) decreased food supply, 2) destruction of habitat, and 3)
decreased reproductive success (Clark et al., 1985).
In 1973 North Carolina enacted one of the nation’s strictest sediment and erosion
control plans (Burby et al., 1990). According to the sediment and erosion control act of
1973, any construction site that disturbs greater than one acre must have an erosion control
plan and have the erosion control measures in place 15 working days after land is disturbed
(NC DENR, 2002). The primary goal of the act is to keep sediment within the boundaries of
construction sites. Out of 128 constructions sites evaluated in North Carolina in 1990, Burby
(>0.85 m3) levels of sediment to leave sites. A large portion of sediment losses could have
been controlled by proper placement and maintenance of sediment control measures, but it
was believed that “Part of the sedimentation problem obviously cannot or, for economic
reasons, should no be prevented from occurring. For example, some particles are too fine to
be captured in entrapment devices” (Burby et al., 1990). Fennessey and Jarrett (1994) also
stated that runoff containing more than 20% of soil particles finer than 20 µm (fine silt)
would require chemical flocculation to meet desired discharge water quality. Line and
White (2001) evaluated three temporary sediment traps with rock outlets in the North
Carolina Coastal Plain and Piedmont regions. They found that sediment traps retained only
21 to 40% of clay and 43 to 72% of silt.
N.C. Administrative Code15ANCAC 02B .0211 requires that the turbidity of
discharged waters from construction sites to non-trout streams or reservoirs not exceed 50
nephelometric turbidity units (NTU) and not exceed 10 NTUs in trout waters. However, the
code also states that “compliance with this turbidity standard can be met when land
management activities employ Best Management Practices (BMPs) . . . recommended by the
Designated Nonpoint Source Agency (North Carolina Sediment Control Commission)” (NC
DENR, 2002).
In October 2000, there was a case in Jackson County, NC where the development of a
golf course led to down-stream damage of a lake due to high turbidity discharge. The golf
course developer being sued had followed an erosion control plan that was certified by the
Department of Water Quality (DWQ). It was decided before an Administrative Law Judge
that the Department of Environment and Natural Resources (DENR) had erroneously
violated so long as sedimentation control BMPs are being followed. The ruling cast doubt on
the validity of the turbidity standard. However, in conclusion to the issue, the staff of DWQ
recommended that the current turbidity standard be retained, but improvements in BMP
design and ground cover requirements were needed (Ross and Gardner, 2002).
Przepiora et al. (1997) evaluated the turbidity of two sedimentation basins in urban
construction sites in the North Carolina Piedmont. Over a twelve-month period turbidity
readings of discharged water always exceeded 50 NTU ranging from 120 to 3200 NTU.
Przepiora et al. (1998) concluded that more effective technologies for removing suspended
solids would have to be found to reach the turbidity requirements set forth in NC
Administrative Code 15 ANCAC 02B .0211.
Since the 1970s polyacrylamide (PAM) has emerged as an effective soil erosion
amendment (Orts et al., 1999). The majority of PAM produced is used in industry (Fig. 1.1)
in multiple applications of water treatment as a flocculant. Sojka and Lentz (1997) found
PAM to be an excellent flocculant for silt and clay particles that were dispersed in furrow
irrigation. Water treated with PAM (5-20 mg L-1) caused soil to settle to the furrow bottom.
PAM technology could potentially help keep construction site discharge to the high water
quality requirements set by North Carolina and other states.
PAM Background
PAM is a water-soluble synthetic polymer. There are three types of PAM, each
having different charge characteristics. A unique chemical reaction is used to produce each
type of PAM. The three types of PAM are: cationic, nonionic and anionic. All of the PAM
types are used in water treatment, but due to unique properties they each have slightly
different applications. The degree of negative (or positive) charge that PAM has is called the
charge density. In anionic PAM, charge density is defined by the degree of hydrolysis; i.e.,
the percentage of OH- groups substituted for NH2 groups on the polymer during
polymerization (Green et al., 2000). In cationic PAM, the charge density is the percent of
positively charged units in the polymer (Fig. 1.2).
Cationic PAM is used mainly as a flocculant for sewage sludge and various industrial
wastes (Barvenik, 1994). Cationic PAM may have adverse effects on aquatic life and
presently is not used in erosion control (Goodrich et al., 1991; Sojka and Lentz, 1997).
Nonionic PAM is used as a flocculant in solid-liquid separations, usually as an aid to
primary coagulants such as aluminum and iron salts. Nonionic PAM is also used in erosion
control, although in limited applications (Barvenik, 1994). Nonionic PAM is actually
slightly anionic (1-2 % charge density) due to the hydrolysis of acrylamide units during the
manufacturing process (Barvenik, 1994). Figure 1.3 shows the polymerization reaction for
nonionic PAM.
The majority of anionic PAM is used in water treatment and industrial wastewater
treatment (Barvenik, 1994). Since the 1970s there has been increased use of anionic PAM as
a soil amendment for erosion control (Orts et al., 1999). However, erosion control
(mw) anionic PAM (12—18 Mg mol-1), with a charge density ranging from 7 to 50 is
typically used in erosion control (Orts et al., 1999). Anionic PAM is commonly produced
(Fig. 1.4) by copolymerization of acrylamide and acrylic acid (or a salt of acrylic acid)
(Barvenik, 1994). Figure 1.5 illustrates the molecular structure of anionic PAM.
PAM is typically purchased as a dry powder. Dry PAM has active polymer
concentrations of 75 to 90 %, the remainder being water, processing aids, and buffers
(Barvenik, 1994). PAM is most efficient and effective if dissolved in water before
application to soil (Lentz and Sojka, 1994; Nadler et al., 1994). When mixing PAM
solutions, PAM should always be added to water that is stirred or agitated (water should
never be added to PAM) (Sojka and Lentz, 1997). The polymer solution must be rapidly
agitated for at least 30-60 minutes for dry granular PAM to be thoroughly dissolved
(Barvenik, 1994). Higher molecular weight PAMs require more time to dissolve and the
solutions are more viscous (Levy and Agassi, 1995). Anionic PAM with a molecular weight
between 15-20 Mg mole-1 forms extremely viscous solutions above 1-2% PAM
concentrations (Barvenik, 1994). PAM is soluble in cold water, and heating does not
increase the rate of dissolution (Montgomery, 1968). Pumping liquid PAM solutions may
shear PAM molecules, reducing its viscosity and reducing its effectiveness to bridge soil
Flocculation
Flocculation occurs when PAM binds (bridges) between multiple soil particles in
suspension. Polymers need to be of a high molecular weight to successfully bridge multiple
soil particles (Gregory, 1989; Laird, 1997; Green et al., 2000). High molecular weight PAM
is long enough to bind to multiple soil particles, with 15 Mg mole-1 PAM being
approximately 10µm in length (Orts et al., 1999). Bridging occurs best when polymer
adsorption leaves a significant portion of the polymer in the aqueous phase. This allows
multiple particles to bind to the same polymer chain (Gregory, 1989). In the case of excess
polymer adsorption, bridging is prevented because insufficient free particle surface for
bridging is available. Flocculation by bridging leads to larger, more stable aggregates than
flocs formed through the reduction of the electrical double layer by addition of salts.
Colloid scientists usually refer to aggregation caused by reduction of double-layer repulsion
and charge neutralization as coagulation and flocculation as aggregation caused by polymer
bridging (Gregory, 1989; Helalia and Letey, 1988; Laird, 1997). PAM desorption from soil
particles is thought to be very limited because of the small probability that all polymer
segments could detach simultaneously (Nadler and Letey, 1989; Theng, 1982).
Cationic, nonionic and anionic PAMs are hypothesized to have unique binding
mechanisms to soil particles. The major binding mechanism of cationic PAM is electrostatic
(coulombic) interactions between positively charged trimethyl ammonium groups on the
polymer and negative clay surfaces (Aly and Letey, 1988; Helalia and Letey, 1988; Theng,
1982; Ben-Hur, 1992). Aly and Letey (1988) observed a decrease in cationic PAM
adsorption to soil as electrolyte concentration of soil suspensions increased. They concluded
electrostatic bonds. In addition Laird (1997) showed a large release of exchangeable Ca2+
with reaction of cationic PAM to Ca2+ saturated soil. Cationic PAM both coagulates and
flocculates suspended solids by: 1) decreasing particle repulsion and 2: increasing bridging
between clay particles (Aly and Letey, 1988).
Nonionic PAM tends to coil in aqueous systems rather than form a chain, which may
decrease its ability to bind to multiple soil particles (Laird, 1997; Helalia and Letey, 1988;
Theng, 1982). Theng (1982) and Ben-Hur (1992) hypothesized that entropy is the driving
force for nonionic PAM binding to soil particles. PAM adsorption on clay surfaces generally
leads to desorption of solvent molecules. Desorption of these molecules increases the
entropy (disorder) of the solution (universe). Natural systems (including PAM/soil
suspensions) move from conditions of low to high entropy (Theng, 1982). Amide nitrogens
are also thought to be involved in the binding of nonionic PAM to clay surfaces. Although
nonionic PAM exists as a random coil in solution, it is believed to extend into the aqueous
phase during adsorption. Theng (1982) reported that an average of 60% of nonionic polymer
chains extend into the aqueous phase, which are available to bridge between multiple soil
particles. Nonionic PAM along with cationic forms of PAM is believed to be able to enter
into the interlayer space of 2:1 clays, whereas anionic polymers cannot (Theng, 1982;
Ben-Hur et al., 1992).
Intramolecular electrostatic repulsion extends anionic polymers. Anionic PAM is
generally more effective for flocculation and stabilization of soil particles than nonionic
polymers because of enhanced particle bridging due to greater polymer extension (Laird,
1997). Although anionic PAM is expected to extend in solution, polymers with charge
There are many possible mechanisms for anionic PAM adsorption to soil particles.
The mechanisms involved in the flocculation of 1:1 clays and those involving 2:1 clays are
hypothesized to be different. Some of the binding mechanisms proposed for 1:1 clays
(kaolinite) are: 1) hydrogen bonding (Laird 1997), 2) ligand exchange (Aly and Letey 1988;
Theng 1982), 3) anion exchange (Peng and Di 1994; Theng 1982), 4) hydrophobic bonding
(Laird 1997), and 5) cation bridging (Laird, 1997; Aly and Letey, 1988). Mechanisms
proposed for 2:1 clays (vermiculite, smectite) are: 1) cation bridging (Laird, 1997; Aly and
Letey, 1988) and 2) van der Waals forces (Laird, 1997; Shainberg et al., 1990).
Adsorption of negatively charged PAM to any mineral surface is most often attributed
to cation bridging (Laird, 1997; Ben-Hur et al., 1992; Aly and Letey, 1988; Nadler and
Letey, 1989, Theng, 1982; Green et al., 2000; Orts et al., 1999; Sojka and Lentz, 1997).
Multivalent cations act as bridges between the anionic groups (carboxyl) of the polymer and
the negative clay surfaces. In the presence of electrolytes the thickness of the diffuse double
layer at the clay and polymer surfaces is suppressed, resulting in decreased repulsive forces
and greater polymer adsorption (Shainberg and Levy, 1994).
Shainberg et al., (1990) hypothesized that there are two different types of cation
bridging between polymers and soil. The first type is an interaction between anionic groups
of the polymer with an exchangeable cation through a water molecule to yield an
“outer-sphere” complex. This mode of interaction happens in aqueous solutions. The second type
is cation bridging between anionic groups of the polymer in direct association with
exchangeable cations in the soil to form an “inner-sphere” complex. The drying of a soil
induces inner-sphere complex formation (Shainberg et al, 1990). The adsorption of PAM
short-range van der Waals force holds them together (Zang and Miller, 1996; Laird, 1997; Letey,
1994).
Cation bridging may be the major mechanism in the adsorption of PAM to 2:1 clays,
but other mechanisms may be more instrumental in the adsorption of PAM to kaolinitic clays
(Laird, 1997). Peng and Di (1994) found that the addition of Ca2+ and Al3+ to kaolinite
suspensions containing PAM decreased clay flocculation. They hypothesized that if cation
bridging is the main adsorption mechanism, then the addition of multivalent cations should
have increased the flocculation of soil particles. They also observed that the density of PAM
adsorption on edges was much higher than on faces. Peng and Di (1994) attributed
adsorption of PAM to edge faces to hydrogen bonding between polymer amide groups and
exposed oxygen of kaolinite surfaces. Theng (1982) stated that under acidic conditions,
anionic polymers could adsorb to clays by either anion exchange or ligand exchange.
Because kaolinite ion exchange capacity is pH dependent, under acidic conditions it can
exhibit anionic exchange, or positive surface charge, attracting anionic PAM. Ligand
exchange would occur when the anionic carboxylic group on the polymer enters the inner
coordination layer of edge aluminum to form a coordination complex. The final
hypothesized binding mechanism between PAM and kaolinite is hydrophobic bonding
(Laird, 1997). This occurs when the carbon backbone (nonpolar) of PAM forms a van der
Environmental Issues
The issues associated with the release of PAM into the environment are quite
different for the cationic forms compared to the nonionic or anionic forms. For this reason,
they will be discussed separately.
Cationic PAM is not currently used in environmental applications because of its
toxicity to fish. Cationic PAM binds to negatively charged fish gills, resulting in suffocation
(Sojka and Lentz, 1997; Goodrich et al., 1991). Low concentrations of cationic PAM (0.3-10
mg L-1) are known to cause damage to fish and invertebrates (Barvenik, 1994). However,
under environmental conditions, it is possible the toxicity would be largely mitigated.
Because PAM irreversibly binds to soil particles (Letey, 1994; Seybold, 1994; Zang and
Miller, 1996), it is conceivable that limited or no toxicity to fish occurs under typical
conditions found on construction sites due to the high concentrations of suspended sediment.
Most testing of PAM toxicity has been performed in distilled water, which does not
accurately describe cationic PAM toxicity in natural environments (McCollister et al., 1965;
Biesinger et al., 1976). Goodrich et al. (1991) found that the addition of 5 mg L-1 humic acid
to distilled water decreased fish toxicity of cationic PAM seven to sixteen fold. Limited
laboratory studies have been done on the effectiveness of cationic PAM as an amendment for
erosion control (Aly and Letey, 1988; Helalia and Letey, 1988; Laird, 1997; Letey, 1994).
Cationic polymers have shown greater adsorption to clays than the anionic and nonionic
types and may be more effective as a flocculant to reduce turbidity of soil suspensions
(Letey, 1994; Malik and Letey, 1991; Barvenik, 1994). However, further testing reflecting
the normal range of environmental conditions will need to be done before cationic PAM is
Anionic and nonionic forms of PAM are nontoxic to fish (Seybold, 1994). However,
the potential for the introduction of residual monomer acrylamide in PAM applications is one
area of concern. Acrylamide is a known neurotoxin and carcinogen to humans and has a
LD50 (mammals) between 110 and 280 mg kg-1 body weight (Seybold, 1994). By US law
(From Sojka and Lentz, 1997: “Products (PAM) labeled for sale in the USA as erosion
polymers are formulated to the same EPA and FDA standards as those used in potable water
treatment and for food processing and packaging uses. By US law, they may contain no
more than 0.05% monomer.) the concentration of residual acrylamide in PAM cannot exceed
0.05% (Sojka and Lentz, 1997; Barvenik, 1994). Wallace and Wallace (1986) found typical
acrylamide concentrations in PAM to be below 0.0002%. Even with such low concentrations
of acrylamide in PAM, it is still a major source of acrylamide released into the environment
(Abdelmagid and Tabatabai, 1982). However, acrylamide is biodegradable and does not
accumulate in soils. At ambient temperatures the half-life of acrylamide in soil ranged from
18 to 45 hours when added at 25 mg kg-1 (Lande et al., 1979). Amdelmagid and Tabatabai
(1982) demonstrated that acrylamide is hydrolyzed, releasing NH4+ under various soil
conditions. Dry beans (Phaseolus vulgaris), sugarbeet (Beta vulgaris L.), and corn (Zea
mays L.) treated with 1120 kg ha-1 PAM (50-100 times normal application) showed no
detectable acrylamide monomer in the tissues (Sojka and Lentz, 1997).
PAM exhibits low toxicity in mammals (Barvenik, 1994). McCollister et al. (1965)
examined workmen from PAM production plants over five years and found no health effects
associated with PAM inhalation. An additional study of unintentional occupational exposure
to PAM indicated that there was no association with tumors, suggesting that residual
degradation in soil systems is approximately 10% per year primarily through shear-induced
chain scission and photodegradation. However, degradation does not produce the monomer
acrylamide due to the removal of the amine group from the polymer backbone (hydrolysis)
(Orts et al., 1999; Barvenik, 1994; Abdelmagid and Tabatabai, 1982). Aqueous solutions of
PAM may provide a substrate for mold growth if nutrients are present, although PAM
degradation does not occur due to microbial attack (Montgomery, 1964). PAM has not been
shown to have any negative effects on plant growth or nutrition and is safe to use as a soil
amendment (Barvenik, 1994; Sojka and Lentz, 1997).
Increase in PAM solution viscosity is another potential environmental issue. PAM
solution viscosity increased 5% for every 10 mg L-1 increase in PAM concentration for a
PAM product with a molecular weight of 15 Mg mol-1 and an 18% charge density
(Bjorneberg, 1998). A 2,500 mg L-1 solution of PAM (30 % c.d., high m.w.) caused death in
100% of fish population, probably due to solution viscosity (McCollister, 1965). This
concentration is 125-500 times that used in agriculture applications to irrigation water (Orts
et al., 1999).
The environmental benefits of PAM are much greater than the possible risks involved
with its use. Lentz and Sojka, (1994) showed that PAM treatment generally improved furrow
discharge water quality. Compared with the controls, PAM treatment reduced losses of
ortho-phosphate, nitrates, and biological oxygen demand (BOD) by 30%; total-phosphorus
by 47%; and total sediment by 58% (Lentz and Sojka, 1994). Lentz et al., (1998) found
ortho-P and total-P concentrations in control discharge to be five to seven times that of PAM
Additional environmental benefits from PAM use come from the reduction of the
degradation of natural waters due to sediment pollution. Some of the environmental
problems associated with sediment in water are: 1) benthic communities damaged by
sediment blanketing community, 2) high turbidity reduces both plankton and aquatic plant
production, 3) nutrients attached to sediment lead to the eutrophication of surface waters, 4)
increase in turbidity affects light penetration and can decrease oxygen concentration and
increase water temperature (Clark et al., 1985). Environmental benefits also include
References
Alley, S.M. and J. Letey. 1988. Polymer and water quality effects on flocculation of montmorillonite. Soil Sci. Soc. Am. J. 52:1453-1458.
Abdelmagid, H.M. and M.A. Tabatabai. 1982. Decomposition of acrylamide in soils. J. Environ. Qual. 11:701-704.
Arora, H.S. and N.T. Coleman. 1979. The influence of electrolyte concentration on flocculation of clay suspensions. Soil Sci. 127:134-139.
Barvenik, F.W. 1994. Polyacrylamide characteristics related to soil applications. Soil Sci. 158:235-243.
Ben-Hur, M., M. Malik, J. Letey, and U. Mingelgrin. 1992. Adsorption of polymers on clays as affected by clay charge and structure, polymer properties, and water quality. Soil Sci. 153:349-356.
Biesinger, K.E., A.E. Lemke, W.E. Smith, and R.M. Tyo. 1976. Comparative toxicity of polyelectrolytes to selected aquatic animals. Polyelectrolyte Tox. 48:183-187.
Bjorneberg, D.L. 1998. Temperature, concentration, and pumping effects on PAM viscosity. Trans. ASAE. 41:1651-1655.
Burby, R.J., E.J. Kaiser, M.I. Luger, R.G. Paterson, H.R. Malcom and A.C. Beard. 1990. A report card on urban erosion and sedimentation control in North Carolina. Carolina Plan. 16:28-36.
Clark, E.H., J.A. Haverkamp, and W. Chapman. 1985. Eroding soils: The off-farm impact. The Conservation Foundation, Washington, DC.
Fennessey, L.A.J., and A.R. Jarrett. 1994. The dirt in a hole: A review of sedimentation basins for urban areas and construction sites. J. Soil Water Cons. 49:317-323.
Goldberg, S. and R.A. Glaubig. 1987. Effect of saturating cation, pH, and aluminum and iron oxide on the flocculation of kaolinite and montmorillonite. Clays Clay Min. 35:220-227.
Goodrich, M.S., L.H. Dulak, M.A. Friedman, and J.J. Lech. 1991. Acute and long-term toxicity of water-soluble cationic polymers to rainbow trout (Oncorhynchus mykiss) and the modification of toxicity by humic acid. Environ. Tox. Chem. 10:509-515.
Gregory, John. 1989. Fundamentals of flocculation. Critical Rev. Environ. Control. 19:185-230.
Helalia, A.M. and J. Letey. 1988. Polymer type and water quality effects on soil dispersion. Soil Sci. Soc. Am. J. 52:243-246.
Laird, D.A. 1997. Bonding between polyacrylamide and clay mineral surfaces. Soil Sci. 162:826-832.
Lande, S.S., S.J. Bosch, and P.H. Howard. 1979. Degradation and leaching of acrylamide in soil. J. Environ. Qual. 8:133-137.
Lentz, R.D. and R.E. Sojka. 1994. Field results using polyacrylamide to manage furrow erosion and infiltration. Soil Sci. 158:274-282.
Lentz, R.D., R.E. Sojka, and C.W. Robbins. 1998. Reducing phosphorus losses from surface-irrigated fields: emerging polyacrylamide technology. J. Environ. Qual. 27:305-312.
Letey, J. 1994. Adsorption and desorption of polymers on soil. Soil Sci. 158:244-248.
Levy, G.J., and M. Agassi. 1995. Polymer molecular weight and degree of drying effects on infiltration and erosion of three different soils. Aust. J. Soil. Res. 33:1007-1018.
Line, D.E., and N.M. White. 2001. Efficiencies of temporary sediment traps on two North Carolina Construction sites. Trans ASAE. 44:1207-1215.
Malik, M., and J. Letey. 1991. Adsorption of polyacrylamide and polysaccharide polymers on soil materials. Soil Sci. Soc. Am. J. 55:380-383.
McCollister, D.D., C.L. Hake, S.E. Sadek, and V.K. Rowe. 1965. Toxicologic investigations of polyacrylamides. Tox. Applied Pharm. 7:639-651.
Montgomery, W.H. 1968. Polyacrylamide. Water Soluble Resins. Wayne, NJ.
Nadler, A and J. Letey. 1989. Adsorption isotherms of polyanions on soils using tritium labeled compounds. Soil Sci. Soc. Am. J. 53:1375-1378.
Nadler, A., M. Magaritz, and L. Leib. 1994. PAM application techniques and mobility in Soil. Soil Sci. 158:249-254.
North Carolina Department of Environment and Natural Resources. 2002. Administrative code section 15ANCAC 02B .0211. Fresh surface water quality standards for class c waters. NC DENR, Div. Of Environmental Management, Raleigh, NC.
Pang, F.F., and P. Di. 1994. Effect of multivalent salts-calcium and aluminum on the flocculation of kaolin suspension with anionic polyacrylamide. J. Colloid Interface Sci. 164:229-237.
Przepiora, A., D. Hesterberg, J.E. Parsons, J.W. Gilliam, D.K. Cassel, and W. Faircloth. 1997. Calcium sulfate as a flocculant to reduce sedimentation basin water turbidity. J. Environ. Qual. 26:1605-1611.
Przepiora, A., D. Hesterberg, J.E. Parsons, J.W. Gilliam, D.K. Cassel, and W. Faircloth. 1998. Field evaluation of calcium sulfate as a chemical flocculant for sedimentation basins. J. Environ. Qual. 27:669-678.
Ross, W.G. Jr., C.H. Gardner. 2002. N.C. Division of Water Quality makes recommendations on turbidity standard. Sediments. 9:1,3.
Seybold, C.A. 1994. Polyacrylamide review: soil conditioning and environmental fate. Comm. Soil Sci. Plant Anal. 11:767-834.
Shainberg, I. and G.J. Levy. 1994. Organic polymers and soil sealing in cultivated soils. Soil Sci. 158:267-273.
Shainberg, I., D.N. Warrington, and P. Rengasamy. 1990. Water quality and PAM interactions in reducing surface sealing. Soil Sci. 149:301-307.
Sojka, R.E., and R.D. Lentz. 1997. Reducing Furrow Irrigation Erosion with Polyacrylamide (PAM). J. Prod. Agric. 10:47-51.
Stephens, S.H. 1991. Final report on the safety assessment of polyacrylamide. J. Am. Coll. Toxicol. 10:193-202.
Theng, B.K.G. 1982. Clay-Polymer interactions: summary and perspectives. Clays Clay Min. 30:1-10.
Wallace, A. and G.A. Wallace. 1986. Effects of soil Conditioners on emergence and growth of tomato, cotton, and lettuce seedlings. Soil Sci. 141:313-316.
mide
Polyacryla
Cationic
y
-Cl
CH
|
CH
-
N
-
CH
|
)
(CH
|
O
|
C
O
|
CH
-
CH
x
NH
|
C
O
|
-
CH
CH
3 3 3 2 2 2 2 2−
−
+
=
−
−
=
=
=
=
+
=
2 2
CH
CH CH
CH
C O C O
2
|
|
|
|
NH
+
Acrylamide Acryloyloxyeth
2 2
3 3
3
(C H )
|
CH -N -CH
|
-CH Cl
yl- trimethyl
ammonium chloride
Figure 1.2 Copolymerization of acrylamide and acryloyloxyethyl-trimethyl ammonium chloride to form cationic PAM (Barvenik, 1994).
Polymerization
2 2 XCH
CH
|
C O
|
NH
Nonionic
Polyacrylamide
−
= − −
-ide
Acrylam
NH
|
O
C
|
CH
CH
2 2
=
=
ide
Acrylam
NH
|
O
C
|
CH
CH
2 2
=
=
CH =CH
2|
C=O
|
-
+
O Na
Sodium acrylate
2 2
2
CH CH
CH CH
|
|
C O
C O
|
|
NH
Y
O Na
Z
Anioni
−
−
=
− −
=
+
-c
Polyacrylamide
+
Carbon
Na
+
Oxygen
Nitrogen
Nitrogen
Hydrogen
PAM Interactions
Introduction
The effectiveness of PAM as a flocculant is affected by the characteristics of the soil being treated. Some of the characteristics that may be significant in adsorption and flocculation of soil particles by PAM are: 1) mineralogy, 2) exchangeable cations, 3) pH, 4) soil texture, 5) organic matter content, and 6) iron oxide content. In addition, how PAM interacts with individual soils may depend on the configuration of the PAM molecule itself (charge density and molecular weight).
Laird (1997) demonstrated that the efficacy of anionic PAM for clay flocculation varies with mineralogy (kaolinite > illite >> quartz). In addition, Ben-Hur et al. (1992) found adsorption of anionic PAM on illite 200 to 400 times greater than that of anionic PAM adsorption to smectite clays. Anionic PAM is highly effective in the acid kaolinite and acid illite systems (Laird, 1997). Arora and Coleman (1979) showed that the
quartz are silanol groups (>Si—OH), which are neutral in acidic environments. The lack of positive charge sites, or divalent cations on quartz surfaces leads to poor adsorption of anionic PAM. Coleman et al. (1949) compared the clay mineralogy of seven soils typical of the Coastal Plain, Piedmont, and Mountain regions of North Carolina (Fig. 2.1). The greatest differences in mineralogy between regions were the increase of smectite
(montmorillonite) and the absence of iron and aluminum oxides in the Coastal Plain. In addition Coleman et al. (1949) demonstrated that there were large differences in
mineralogy within each region.
Cation bridging is believed to be a major mechanism of PAM adsorption, although it may not be as important in kaolinite. Divalent cations provide a bridge between negatively charged polymer and clay surfaces (Letey, 1994). Laird (1997) showed that soils saturated with Ca2+ resulted in greater flocculation with PAM than soils saturated by Na+. Soils with divalent exchangeable cations will result in increased cation bridging and better flocculation with the addition of PAM (Nadler and Letey, 1989). The significance of divalent cations in solution or on exchange sites may differ according to soil mineralogy (Laird, 1997; Peng and Di, 1994).
Goldberg and Glaubig (1987) determined that the critical coagulation
concentration of all tested clays, clay mixtures and oxides were pH dependent. The pH dependence of kaolinite was greater than montmorillonite, although a 50/50 mixture behaved more like montmorillonite. Peng and Di (1994) hypothesized that adsorption of anionic PAM to kaolinite is strongly dependent on pH. In contrast, adsorption of
decreased flocculation. Possible explanations for this phenomenon are that at low pH values PAM becomes protonated and neutralized. The neutralization of carboxyl groups on the polymer causes the polymer to coil on itself, decreasing its ability to bridge between soil particles. At higher pH values, kaolinite edge and surface charges become more negative, which increases repulsion of anionic PAM.
Soil texture is an important factor in the efficacy of PAM surface applications for erosion control (Green et al., 2000; Nadler et al., 1994; Miller et al., 1998). However, all articles that sited the importance of soil texture on PAM efficacy dealt with stabilization of soil aggregates and not flocculation. I hypothesize that the ratio of silt to clay may effect the flocculation of soil suspension with the addition of PAM, although not overall soil texture.
Kretzschmar et al. (1997) found that the removal of natural organic matter from clay reduced the stability of clay colloids in critical coagulation experiments with kaolinite soils. It was suggested that the effect of organic matter on colloidal stability was due to electrostatic and steric stabilization. The stabilizing effect of natural organic matter in coagulation experiments may not be the same as those with polymer
interactions, although negatively charged organic matter would likely repel anionic polyacrylamide except at low pH (hydrophobic reactions) (Helalia and Letey, 1988; Nadler and Letey, 1989).
performed and they did not mention the iron oxide content of each soil. Theng (1982) stated that ligand exchange might be an important mechanism for anionic PAM binding. Iron oxides may be involved in flocculation with PAM if polymer carboxyl groups (COO-) exchange with hydroxyl groups (>Fe-OH).
The objectives of this study were: 1) to evaluate the PAM-induced flocculation of soils from across NC having diverse soil characteristics that may have potential
Materials and Methods
Soil Analysis
Soil particle size analysis was completed by the hydrometer method (Gee and Bauder, 1986), after soil organic matter was removed by the addition of hydrogen peroxide (Day, 1965). Chemical dispersion was accomplished by the addition of Na-hexametaphosphate. An electric mixer was used for physical dispersion for a 5-minute duration on each soil sample. This analysis was performed on two samples from each soil and the values reported here are an average.
Clay mineralogy (< 2 µm) was determined by x-ray diffraction analysis (Whittig and Allardice, 1986). Soils that had already received chemical and physical dispersement from the particle size analysis were used for mineralogical analysis determination (Kunze and Dixon, 1986). X-ray diffraction patters were interpreted by measuring (integrating) the area under the curve of each clay mineral (smectite, vermiculite, mica, and kaolinite) in the Mg-glycerol saturated samples. The area of each clay mineral was divided by the total area of all clay minerals to give the percent of each clay mineral present in the soil.
Soil pH was determined using a pH electrode with distilled water and a 1:1 soil to water ratio. Two samples were used and an average pH value was reported.
Extractable soil iron was determined by ammonium oxalate and citrate-bicarbonate-dithionite (CBD) extraction. Ammonium oxalate extraction was done to determine the amount of amorphous and organically bound Fe. CBD extracts all forms of iron oxide (crystalline and noncrystalline)(Jackson et al., 1986).
Oxalate extractable iron was determined by measuring 0.15 g (0.3 g in gray soils) of soil in a 50 ml centrifuge tube. Thirty mL of oxalate extract was added to the soil and the tube was then covered in aluminum foil. All tubes were shaken for 2 hours on a reciprocating shaker. Samples were centrifuged at 15000 rpm for 15 minutes and the supernatant solutions were saved and Fe was measured by atomic absorption (AA) spectrometry (Jackson et al., 1986).
CBD extractable iron was determined by first weighing 1 g soil (3 g in gray soils) into 100 mL polypropylene centrifuge tubes. 50 mL of Na-citrate/bicarbonate solution was added to each tube, and the tubes were heated (75-80 °C) in a water bath while adding a total of 2 g Na-dithionite over a 15 minute time period. Saturated NaCl solution was then added to promote flocculation. Samples were centrifuged for 5 minutes at 2000 rpm and Fe was measured by AA spectrometry (Jackson et al., 1986).
PAM Interactions
Thirteen soil samples were provided by the North Carolina Department of
Transportation (NCDOT) from active construction sites within 13 of their 14 geographic divisions (Fig. 2.2). This provided a fairly comprehensive range of materials
representing North Carolina sediment sources. The samples were taken from subsoils, which were exposed during the grading process, although the original depths are not known. Soil samples were allowed to air-dry, after which they were ground with a mortar and pestle until they passed through a 2-mm sieve.
We evaluated 11 PAM products which had a wide range in molecular weight and charge density. The molecular weight of the polymers ranged from 14 to 28 Mg mol-1 and the charge density ranged from neutral to 50% molar charge (Table 2.1). Applied Polymer Systems (APS) PAM products contained a mixture of polymers containing different molecular weight and charge density. The PAM products used were: Superfloc 1606, A150, A150 HMW, A100, and N300 (Cytec Industries, West Patterson, NJ, USA), Chemtall 923 VHM (Chemtall Inc., Riceboro, GA, USA), Soilfix Polybead (Ciba
Specialty Chemicals, Suffolk, VA, USA), and APS 702aa, 702b, 702c, and 730b (Applied Polymer Systems Inc., Woodstock, GA, USA). Initially, an evaluation of all polymers (11) with all soils (13) was performed (Table 2.1; Fig 2.3).
All PAM used in the evaluation was received in granular form. Stock solutions containing PAM (0.1% w/w) were made by slowly adding the PAM to a flask of stirring, distilled water and mixing for at least 24 hours at room temperature. Each soil
suspension with PAM was shaken for 10 seconds (no previous physical or chemical dispersion) and placed on the lab bench to settle under gravity. Twenty seconds after shaking, a nephelometer (Analite 152, McVan Instruments, Mulgrave, Australia) probe was inserted into the solution and a nephelometric turbidity (NTU) reading was taken 10 seconds later at a depth between 10 and 38 mm.
After an initial flocculation screening with each soil and all 11 PAMs, the four or five best flocculants for each soil were chosen for replicated testing (Table 2.2). The criteria for the selection of the best PAM were a combination of the greatest turbidity reduction and the lowest concentration of polymer needed to decrease turbidity. Cytec Industries A110 (SF A836) is commonly used in erosion control and was included in replicate testing (Orts et al., 1999). Applied Polymer Systems 705 was used in replicate testing instead of other (702aa, 702b, 702c, 705, and 730b) commercially mixed
polymers. These experiments used the same procedure as is described for the screening tests, but with three treatment replicates.
Soil characteristics were evaluated as potential indicators of the relative effectiveness of PAMs in reducing turbidity. Stepwise multiple regression (SAS Institute, Cary, NC) analysis was performed on soil turbidity reduction for one PAM product (Cytec Superfloc A100).
according to soil mineralogy for initial statistical analysis. Soils that had less than 20% smectite or vermiculite in either the fine or coarse clay fraction with dominant kaolinite clay mineralogy were grouped together (sample 5, 9, 11, 12, 13, 14). Soil samples 1, 2, 3, 4, 6, and 7 all had greater than 20% smectite or vermiculite in either the fine or coarse clay fraction. Arora and Coleman demonstrated that raising the smectite fraction in a smectite/kaolinite from 15 to 20% caused the greatest increase in critical salt
concentration (85-270 meq L-1). These soils would likely to react more like smectite (or vermiculite) than kaolinite (Arora and Coleman, 1979). Multivariate analysis (stepwise regression analysis) for soil properties (texture, exchangeable cations, pH, organic
carbon, Fe oxide) was performed for each group of soils. The dependant variable, named lnpct, in the experiments was equal to the log (100* ((initial turbidity-final
Mixed Polymers
The mixed PAM product APS 705 was often the most effective in reducing turbidity, but we do not know what PAMs are in the formulation. We designed a series of experiments to determine if the results could be replicated using a mixture of PAMs having a variety of molecular weights and charge densities. We selected soil sample 4 from the Coastal Plain Region because it was the most recalcitrant in responding (flocculating) to single component PAMs but did respond to APS 705. The products used in the mixture were all from Cytec Industries (West Paterson, NJ, USA). The individual products mixed were Superfloc N300, A100, A150, N300LMW, A100LMW, and A150LMW. Polymers with a “LMW” suffix have a molecular weight of
approximately 4 Mg mole–1, and those products without the suffix have molecular weights approximately 14-16 Mg mole–1 (Table 2.3).
Combinations and single PAMs were used in this experiment to differentiate what parameters were significant in the evaluation. Treatments included: A100LMW,
A150LMW, N300, A100 + A100LMW, A150LMW + N300, N300LMW + A150, and N300 + A150. Polymer mixtures contained 50% (w/w) of each polymer added. The treatments were intended to evaluate if the effectiveness of APS 705 was due to low molecular weight PAM alone, high molecular weight PAM alone, combined high and low molecular weight with the same charge density, or a combination of different
molecular weights and charge densities. All PAM used in the evaluation was in granular form and was mixed with distilled water as described above. In the case of PAM
Results and Discussion
Soil Analysis Properties
PAM Interactions
Minimal turbidities were reached with PAM concentrations generally between 0.5 and 2 mg L-1 with all PAM and soil combinations (Fig 2.4-2.16). In most cases, PAM reduced turbidity in soil suspensions. Soils varied greatly in terms of PAM flocculation efficiency with turbidity reductions ranging from 86 to 99.7% compared to untreated controls. Five soils had turbidity reductions of at least 98 % within 30 seconds, with three reaching the 50 NTU level and two dropping below 10 NTU (Fig. 2.4-2.8). In four soils (Fig. 2.8-2.11) turbidity declined to a minimum with increasing PAM concentration, then increased at concentrations greater than 1 mg L-1. Increasing the PAM concentration in these soils to 5 mg L-1 caused diminished turbidity reduction. In three other soils (Fig. 2.12-2.14), PAM had no observable effect until the concentration exceeded 0.5 mg/L. At higher PAM concentrations these soils had turbidity reductions of 86, 91, and 97%, but only one of the soils met the 50 NTU standard. The final two soils (Fig. 2.15-2.16) exhibited little or no flocculation with single component PAMs. However, a
commercially mixed PAM application (APS 705) reduced turbidity by 87% (Fig. 2.15-2.16).