Nonparametric Disequilibrium Mapping of Functional Sites Using Haplotypes
of Multiple Tightly Linked Single-Nucleotide Polymorphism Markers
Rong Cheng,*
,1Jennie Z. Ma,*
,†Fred A. Wright,
‡,2Shili Lin,
§Xin Gao,
‡Daolong Wang,
‡,2Robert C. Elston** and Ming D. Li*
,3*Department of Psychiatry and†Center for Biostatistics and Epidemiology, The University of Texas Health Science Center, San Antonio, Texas 78229,‡Division of Human Cancer Genetics and§Department of Statistics, Ohio State University, Columbus, Ohio 43210 and
**Department of Epidemiology and Biostatistics, Case Western Reserve University, Cleveland, Ohio 44109 Manuscript received October 10, 2002
Accepted for publication March 24, 2003
ABSTRACT
As the speed and efficiency of genotyping single-nucleotide polymorphisms (SNPs) increase, using the SNP map, it becomes possible to evaluate the extent to which a common haplotype contributes to the risk of disease. In this study we propose a new procedure for mapping functional sites or regions of a candidate gene of interest using multiple linked SNPs. Based on a case-parent trio family design, we use expectation-maximization (EM) algorithm-derived haplotype frequency estimates of multiple tightly linked SNPs from both unambiguous and ambiguous families to construct a contingency statisticSfor linkage disequilibrium (LD) analysis. In the procedure, a moving-window scan for functional SNP sites or regions can cover an unlimited number of loci except for the limitation of computer storage. Within a window, all possible widths of haplotypes are utilized to find the maximum statisticS*for each site (or locus). Furthermore, this method can be applied to regional or genome-wide scanning for determining linkage disequilibrium using SNPs. The sensitivity of the proposed procedure was examined on the simulated data set from the Genetic Analysis Workshop (GAW) 12. Compared with the conventional and generalized TDT methods, our procedure is more flexible and powerful.
M
OST human disorders of interest likely result from (Patil et al. 2001; Gabriel et al. 2002; Zhang et al.2002a) showed that using selected representative SNPs the cumulative effect of alleles at multiple
suscep-tibility loci, none of which on its own is either necessary by haplotype block partition algorithms can dramati-cally reduce the time and effort for genotyping without or sufficient to cause the disease. Because of this, the
classical strategies of analyzing monogenic disorders losing much haplotype information. Therefore, associa-tion studies using SNP markers represent an important have been unsuccessful. Alternative approaches such as
genome-wide linkage and association analysis have been tool in identifying susceptibility loci for human disor-ders because of their ability to identify unique chromo-proposed and utilized in many studies (e.g., seeRisch
2000). Large-scale association studies would employ a somal segments likely to harbor disease-predisposing genes.
dense single-nucleotide polymorphism (SNP) map to
detect association between markers and disease. In the Many haplotype analysis methods in the literature require phase information inferred from genotype data. causal hypothesis, most genetic determinants of a
dis-ease are SNPs that are likely to be selected as markers. However, as the number of loci increases, the informa-tion loss due to haplotype ambiguity would increase In the proximity hypothesis, most disease determinants
will not be included among markers but may be detected rapidly (Hodgeet al.1999). Several strategies that make use of the expectation-maximization (EM) algorithm through linkage disequilibrium with other SNPs.
Simu-lation studies based on monotonic popuSimu-lation expan- (Dempsteret al.1977) have been proposed to overcome the problem of missing phase information for estimat-sion suggest that useful association does not usually
extend beyond 3 kb along the genome (Collinset al. ing haplotype frequencies from unphased diploid geno-type data (ExcoffierandSlatkin1995, 1998;Hawley
1999;Kruglyak1999). Recent advances in the
identifi-andKidd1995;Longet al.1995;Slatkinand
Excof-cation of SNP haplotype blocks in the human genome
fier1996;ChianoandClayton1998;Clayton1999). Recently, several research groups have discussed and
1Present address:Columbia Genome Center, Columbia University, compared the accuracy of haplotype frequency
estima-1150 S. Nicholas Ave., New York, NY 10032. tion using the EM algorithm (FallinandSchork2000;
2Present address: Department of Biostatistics, University of North
Tishkoff et al. 2000; Stephens et al. 2001; Niu et al.
Carolina, Chapel Hill, NC 27599.
2002; Qin et al. 2002). It was suggested that even in
3Corresponding author:Department of Psychiatry, Mail Code 7792,
the worst case, individual haplotype frequency estimates
7703 Floyd Curl Dr., San Antonio, TX 78229.
E-mail: [email protected] obtained by the EM algorithm from a sample size of 100
or more would not deviate ⬎5% from their true values difference between the procedure reported here and the published methods in the literature (Clayton1999; among the sampled individuals (Fallin and Schork
2000). Furthermore, Fallin and Schork (2000) sug- Zhao et al. 2000). We apply the proposed method to scan the simulated sequence data from the Genetic Analy-gested that one should be more concerned about the
quality of sampling than the possibility of estimation sis Workshop (GAW) 12 (Almasyet al.2001) to identify the functional sites of candidate genes with tightly errors when assessing haplotypes among unphased
indi-viduals. Therefore, EM estimation of haplotype frequen- linked SNP markers. Comparing the results from our procedure with those from the conventional and gener-cies for multiple diallelic genotypes may represent a
viable alternative to the recruitment of additional family alized TDT methods, it appears that our method is more flexible and powerful.
members or intensive laboratory haplotyping for haplo-type-based genetic studies.
Haplotype frequency estimates from tightly linked
METHODS
multilocus genotyping data have been used for
linkage-disequilibrium (LD) analysis (Clayton1999;Toivonen We describe a nonparametric method of detecting functional SNP site(s) of haplotypes associated with the
et al.2000;Zhaoet al.2000;Fallinet al.2001;Schaid
et al.2002). For example,Zhaoet al.(2000) proposed disease of interest in a LD study. The method naturally incorporates tightly linked multilocus genotype data, in a new statistical method for the
transmission/disequilib-rium test (TDT) using EM-derived haplotype frequency the sense that multiallelic loci are utilized and the exist-ing disequilibrium among markers (in both haplotypes estimates of multiple tightly linked markers from both
unambiguous and ambiguous families. Their results sug- that are transmitted and those that are not transmitted to affected offspring) is built into the test. The approach gest that the power of the method was higher than that
of the conventional TDT method (Spielmanet al.1993) searches for evidence of ancestral haplotypes that are shared more often among chromosomes transmitted or other TDT methods, such as using estimated
haplo-type frequencies of multiple markers from only unam- than among chromosomes not transmitted to affected offspring, followed by comparison of the observed data biguous families (Wilson 1997; Clayton and Jones
1999).Clayton(1999) also proposed a new TDT statis- to the distribution of data expected under the null hy-pothesis.
tic for the situation in which some haplotype phases
are unknown or some parental genotypes are missing. EM algorithm estimation:When a haplotype segment with certain marker(s) occurs in a chromosome
trans-Dudbridgeet al.(2000) showed that, in some families
for which haplotypes are known, a potentially serious mitted to affected offspring with a frequency higher than that in the chromosome not transmitted, there bias is introduced into the TDT if the loss of information
from families with ambiguous haplotypes is not taken exists an association of the haplotype with the disease. This finding would be considered striking and consis-into consideration. The methods proposed byClayton
(1999) andZhaoet al.(2000) can avoid loss of informa- tent with the hypothesis that the marker positions are near a disease gene or located at a disease locus (e.g., tion from families with ambiguous haplotypes, but both
require one to preassign a window width prior to analyz- a functional site lies within the sequence of a disease gene), explaining the haplotype as being identical by ing multisite parental transmission data under this given
fixed width. descent (IBD) with that from a common founding an-cestor. We consider N randomly sampled trios, each
Sachidanandam et al. (2001) pointed out that in
practice, when a gene has been implicated in causing containing an affected offspring along with two parents, with each member genotyped for multiple tightly linked the disease of interest as a result of linkage analysis,
known biological function(s), or an expression pattern, markers. In some trios, it may be impossible to unambig-uously reconstruct haplotypes from the given genotypes. it is desirable to survey allelic variation within it
exhaus-tively for any potential association to the disease. Using In such a design with data from an affected singleton offspring and both parents, if the haplotypes can be SNP markers, it becomes possible to evaluate the extent
to which common haplotypes contribute to disease risk. reconstructed from the known genotypes unambigu-ously, we letHbe the total number of possible haplo-In this study, we apply EM-derived haplotype frequency
estimates of multiple tightly linked SNP markers from types andnjandn⬘j be numbers of a particular haplotype
hj(j⫽1, 2, . . . ,H) transmitted and not transmitted to
both unambiguous and ambiguous families to construct
a contingency table statistic, namely S(a, b), for LD the affected offspring, respectively (see Table 1). If the haplotypes cannot be reconstructed unambiguously, analysis. Our procedure assumes no or very rare
recom-bination among multiple tightly linked markers. In our then, to fully use the information of the multiple tightly linked markers, the EM algorithm is employed to esti-procedure, a moving-window scan for functional sites or
regions can cover any number of loci without limitation mate the transmitted and not transmitted haplotype frequenciesfjandf⬘j (j⫽1, 2, . . . ,H). In Table 1, we
except for that imposed by computer storage. Within a
given maximum window width, all possible widths of use 2N ⫻fj and 2N⫻ f⬘j to represent directly counted
numbersnjandn⬘j, respectively, even when some of the
haplotypes are utilized to find the maximum statisticS*
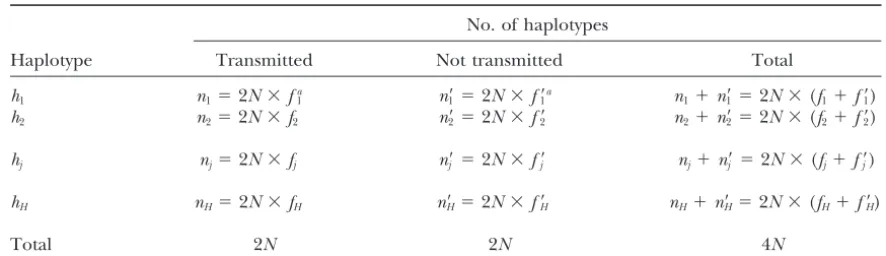
TABLE 1
H⫻2 table for calculating the contingency table statisticS(S*(x)⫽ max
a,b:aⱕxⱕb S(a,b))
No. of haplotypes
Haplotype Transmitted Not transmitted Total
h1 n1⫽2N⫻fa
1 n⬘1⫽2N⫻f⬘1a n1⫹n⬘1⫽2N⫻(f1⫹f⬘1) h2 n2⫽2N⫻f2 n⬘2⫽2N⫻f2⬘ n2⫹n⬘2⫽2N⫻(f2⫹f⬘2)
hj nj⫽2N⫻fj n⬘j ⫽2N⫻fj⬘ nj⫹n⬘j ⫽2N⫻(fj⫹f⬘j)
hH nH⫽2N⫻fH n⬘H⫽2N⫻fH⬘ nH⫹n⬘H⫽2N⫻(fH⫹f⬘H)
Total 2N 2N 4N
af
j and f⬘j (j ⫽ 1, 2, . . . , H) represent the proportions of transmitted and not-transmitted haplotypes,
respectively.
SupposeGi(⫽gi,gi,m,gi,f) is the trio for theith family, Pi(gi,gi,m,gi,f)⫽
兺
(hu,hv,hl,hm)僆Gifuflfv⬘fm⬘.
where gi, gi,m, and gi,f represent the genotypes of the
child, the mother, and the father, respectively. Let So the log-likelihood is
hu be paternal haplotype transmitted to the affected logL(data|G1,G2, . . . ,GN)⫽
兺
N
i⫽1
log {Pi(gi,gi,m,gi,f)}⫹constant
offspring
hvbe paternal haplotype not transmitted to the affected ⫽
兺
Ni⫽1
log {
兺
(hu,hv,hl,hm)僆Gi
fuflfv⬘fm⬘}⫹constant.
offspring
hl be maternal haplotype transmitted to the affected Next we consider estimation of the haplotype frequencies
offspring f
jandfj⬘(j⫽1, 2, . . . ,H). The EM algorithm (see,e.g.,
hmbe maternal haplotype not transmitted to the affected ExcoffierandSlatkin 1995, 1998;Hawley andKidd
offspring. 1995; Long et al. 1995; Slatkin and Excoffier 1996;
ChianoandClayton1998;Clayton1999) is a way of
Conditional onGi, the probability or weight to a
trans-attempting to find the fjand fj⬘(j⫽ 1, 2, . . . , H) that
mitted haplotypehjfrom theith family is
maximize the log-likelihood logL(data|G1, G2, . . . , GN). Similar to the study reported byZhaoet al.(2000),
w(i)
j ⫽
兺
(hu,hv,hl,hm)僆Gicjul(i)fuflfv⬘fm⬘
兺
(hu,hv,hl,hm)僆Gfuflfv⬘fm⬘, we assume that all parents represent a random sample of unrelated individuals from a population in Hardy-Wein-berg equilibrium. The entire set of weights,w(i)
j andwj⬘(i)
where (hu,hv,hl,hm)僆Gidenotes the haplotype group
(i⫽1, 2, . . . ,N;j⫽1, 2, . . . ,H) can thus be computed (hu,hv,hl,hm) that is compatible with the genotype group
in a single pass through theH possible haplotypes as of the ith family and the factor cj
ul(i) (⫽ 0, 1, or 2)
indicated below: depends on the counts of haplotype frequency fj
oc-curring in the pair of haplotype frequencies (fu,fl). The
summation in the denominator is over all haplotype
w(1)
1 w(2)1 ... w(1N) w1⬘(1) w⬘1(2) ... w⬘1(N) w(1)
2 w(2)2 ... w(2N)
and w⬘
(1)
2 w⬘2(2) ... w⬘2(N)
.
⯗ ⯗ ⯗ ⯗ ⯗ ⯗ ⯗ ⯗
w(1)
H w(2)H ... w(HN) wH⬘(1) w⬘H(2) ... w⬘H(N)
groups that are compatible withGi. Thew(ji)are defined
as the estimated weight of theith family when the par-ent(s) has haplotype (hu⫽j,hv) and/or (hl⫽j,hm), andhj
is transmitted. Similarly, In principle, the maximum-likelihood (ML) estimates of the haplotype frequencies could be found analytically by solving a set of equations with the Lagrange
multipli-w⬘(i)
j ⫽
兺
(hu,hv,hl,hm)僆Gicjvm(i)fuflfv⬘fm⬘
兺
(hu,hv,hl,hm)僆Gifuflfv⬘fm⬘ ers1and2:is the weight for a not-transmitted haplotypehj.
log(fjorf⬘j)
冢
兺
Ni⫽1
log
冦
兺
(hu⬘,hv⬘,hl⬘,hm⬘)僆Gi
fu⬘fl⬘f⬘v⬘f⬘m⬘
冧
Given the genotypes, the likelihood function for the data is
⫹ 1(1⫺
兺
H
j⫽1
fj)⫹ 2(1⫺
兺
Hj⫽1
f⬘j)
冣
⫽0,L(data|G1,G2, . . . ,GN) ⬀
兿
N
i⫽1
Pi(gi,gi,m,gi,f),
j⫽1, 2, . . . ,H,
and2. We obtain the ML estimators offjandf⬘j (j⫽ sible compatible haplotype groups are conditional on
a given family’s genotypes, first a compatible haplotype 1, 2, . . . ,H) in the (p⫹1)st EM iteration,
group is randomly selected. For each family, haplotypes are then randomly permuted within each transmitted/
fˆ(p⫹1)
j ⫽
1 2N
兺
N
i⫽1 w(i)(p⫹1)
j and fˆ⬘j(p⫹1)⫽
1 2N
兺
N
i⫽1 w⬘(i)(p⫹1)
j .
nontransmitted haplotype pair for each parent to form a new set of family genotypes. The transmitted and non-transmitted haplotype frequencies are then reestimated Initially, all haplotypes are set equally frequent, so that
using the EM algorithm for each random selection and all possible complementary haplotype pairs are equally
permutation of the data. By using this procedure, we likely. In the (p ⫹ 1)st expectation step (E-step), the
obtain the null distribution of the maximum ofS*from weights of the transmitted and not-transmitted
haplo-10,000 randomized permutations. Then it is easy to ob-types, w(i)(p⫹1)
j and w⬘j(i)(p⫹1), can be obtained from the
tain the 100(1⫺ ␣) percentile and appropriatePvalue given genotype information and current estimates of
for the maximum ofS*over the region with multiple the haplotype frequencies, fˆ(p)
j andfˆ⬘j(p). The (p⫹ 1)st
tightly linked markers. A computer program for the maximization step (M-step) gives the
maximum-likeli-proposed method is available upon request. hood estimates offˆ(p⫹1)
j andfˆ⬘j(p⫹1). When the difference
between the values of the haplotype estimates in the previous M-step and current one becomes less than a
RESULTS
predetermined quantity (e.g., 10⫺7), the iteration is
We applied the proposed procedure to the simulated stopped and the final estimates are obtained. The
esti-sequence data set of GAW 12. This data set contains mated numbers nˆj (⫽2N ⫻ fˆj) and nˆ⬘j (⫽2N ⫻ fˆ⬘j) of
computer-simulated sequence data with multiple SNP transmitted and not-transmitted haplotypes are then
markers for seven candidate genes in 23 extended pedi-used for further computing the statisticSand estimating
grees with a total of 1497 individuals for two popula-the empirical 100(1 ⫺ ␣) percentiles and P value by
tions: a general and an isolated population. There were simulation permutation (ChurchillandDoerge1994).
50 replicates for each population model. We randomly
StatisticS:The key feature of this method is
encom-sampled 10 replicates from the 50 replicates of the gen-passed by defining a statisticS(a,b) (GaoandWright
eral population and separated them into two groups 1999) that is computed on the set of haplotypes
begin-each with five replicates. Group 1 contained replicates ning at marker positionaand ending at positionb. The
1, 10, 18, 42, and 48, while group 2 contained replicates association evidence at positionxis
21, 23, 33, 34, and 38. For each extended pedigree in a
S*(x)⫽ max
a,b:aⱕxⱕb
S(a,b). replicate, we randomly sampled a trio with one affected offspring and two parents (affected or unaffected), for The statisticSis chosen to reflect a striking association whom genotyping information was available. In total, of all haplotypes with the disease. In other words, for 95 and 97 trios were in groups 1 and 2, respectively. an arbitrary statisticSand at positionx, we search over all Last, we pooled the two samples together to form sample haplotype widths (containingx) to find the haplotype in 3, with a total of 192 trios. All the SNP variants present in most striking association with the disease. Under the a sample were counted, and only those with a frequency null hypothesis, this haplotype has no association with ⬎1% were chosen as possible SNP sites (Broderand the disease. Under the assumption that haplotypes are Venter2000).
sampled independently, we compute a Pvalue for the Theoretically, the EM algorithm can be applied to an
2contingency table test of haplotypevs.disease status
unlimited number of loci with any number of alleles. and refer to the statistic S(a, b)⫽ ⫺log10(P value) as However, in practice, implementation of this algorithm S. The P value corresponds to the k ⫻ 2 standard 2
is limited by the need to store the estimated haplotype contingency table test ofk(1⬍kⱕH) unique haplo- frequencies for every possible haplotype contained in types (with k ⫺ 1 d.f.) that begin at position a and the sample. These storage requirements increase expo-end at b vs. disease status, under the assumption of nentially with the number of loci under investigation. independence. The numberkof unique haplotypes will For example, the numbers of SNPs for candidate gene depend on the choice ofaandb. 1 are 155, 158, and 152 in samples 1, 2, and 3,
respec-Permutation for empiricalPvalue:To evaluate type I tively. If any individual is heterozygous at 150 loci, then error accurately, an empiricalPvalue that appropriately the number of possible haplotypes in that sample is 2150.
corrects for the testing of multiple marker locations is Also, as the number of markers increases, there will be obtained from the EM estimates of haplotype numbers an increased variance in the estimates. In this study, we and frequencies (nˆj,nˆ⬘j,fˆj, andfˆ⬘j;j⫽1, 2, . . . ,H), by first selected SNP markers atⵑ1000-bp intervals and set
pos-TABLE 2
Chromosomal locations and sequence lengths of seven candidate genes in the simulation model
Candidate gene Chromosomea Location (cM)b Length (bp)c SNPs
1 (MG6)d 6 30.50 20,000 150e
2 (MG5) 1 137.10 13,000 92
3 2 111.00 16,000 113
4 1 138.30 20,000 104
5 14 9.80 17,000 35
6 (MG1) 19 42.10 17,000 37
7 9 47.90 20,000 185
aChromosome number.
bThe location in centimorgans fromp-ter of the chromosome. cThe length of the sequence for a candidate gene in base pairs. dMG indicates major gene in the original simulation model.
eNumber of SNPs for each gene (1% less than one allele frequency at a locus⬍99%).
follows: a pattern is set up where the first window consists site at nucleotide 5782, was detected in both samples 1 and 3. For candidate gene 1 in sample 1 and candidate of markers 1–5 (i.e., 1ⱕaⱕxⱕbⱕ5) and the second
window of markers 2–6 (i.e., 2ⱕa ⱕxⱕ bⱕ 6), and gene 6 in sample 2, the statisticS*peaks were detected at the same locations as in the other samples, except the shifting of the window continues until all of the
SNPs of a gene or genomic fragment have been scanned. that the correspondingPvalues did not reach the 0.01 level. It should be noted that, after pooling samples 1 The chromosome locations, lengths of sequence data,
and number of SNPs for these candidate genes are and 2 to form sample 3, the statisticS*values at the peak locations increased as the sample size became larger for shown in Table 2.
Linkage disequilibrium analysis was performed for both candidate genes 1 and 6, but did not increase, in fact even decreased, for the other five candidate genes all selected SNPs of these seven candidate genes. The
distributions of the statisticS*for these candidate genes at some peak locations (Figure 1).
Next, we compared our procedure to the generalized are shown in Figure 1. The highest peak locations of
S*and their corresponding P values for all candidate TDT (Clayton 1999) and the conventional TDT
(Spielman et al.1993) methods for candidate genes 1
genes are summarized in Table 3. As described in
meth-ods, for an arbitrary statisticSand at the positionx, we and 6 in samples 1–3. For the conventional TDT method, each SNP site was studied separately, leading to a P
searched over all haplotype widths. If we setm⫽5 and
x⫽5, the varied pairs of (a, b) containing thexwill be value for each SNP site. For the generalized TDT method implemented in the TRANSMIT program (1, 5), (2, 6), (3, 7), (4, 8), (5, 9), (2, 5), (3, 6), (4, 7),
(5, 8), (3, 5), (4, 6), (5, 7), (4, 5), (5, 6), and (5, 5), (Clayton 1999), we fixed the window widths at two, three, four, or five linked SNPs followed by choosing and the statisticScalculated from the last pair of (5, 5)
is equivalent to a conventional single-marker test. Some the smallestPvalue for each SNP site from the multiple-locus and single-multiple-locus analysis results under different of the peak locations of S* in Table 3 contained two
linked markers with an equal maximumS*, while others windows. As shown in Figure 2, for candidate gene 1, the highest peaks of the statisticS*from our procedure might contain three, four, or five linked markers. One
functional SNP was identified for candidate genes 1 are greater than (or at least equal to) those obtained from the generalized or conventional TDT methods for and 6. No functional SNP site was detected at the 0.01
significance level for the other five candidate genes (Ta- all samples. For candidate gene 6, the largest statistics obtained from our procedure are all greater than those ble 3). In fact, for candidate gene 2 multiple simulated
functional sites directly affected a quantitative trait, but from the TRANSMIT or TDT procedures. The highest peaks of statistic S*from the TRANSMIT program are no single functional site directly affected disease status.
For the other four candidate genes, no functional sites greater than or equal to those from the conventional TDT method.
were simulated in the original model (Almasy et al.
2001). For candidate gene 1, the functional site at the Figure 3 compares the results obtained from our pro-cedure with the generalized and conventional TDT nucleotide 557 position was detected in samples 2 and
3, as expected from the underlying assumption of the methods for candidate gene 1 in sample 3 (N ⫽ 192 trios) under different SNP densities. A total of 41, 23, simulated data set. For candidate gene 6, a region from
nucleotides 5782 to 7332 (i.e., the maximum statistic 8, and 5 SNPs were selected from the original SNPs for candidate gene 1, which gave an average SNP interval
S*obtained using the haplotype data from two tightly
Figure1.—The chromo-somal distribution of sta-tistic S* for seven candi-date genes. The lines with open circles, triangles, and squares represent the re-sults from samples 1, 2, and 3, respectively. Average SNP interval for all candidate genes isⵑ1000 bp.
simulated functional site (i.e., 557 bp) was included for smaller. Similarly, we compared the results from these three methods for candidate gene 6 under three differ-only the first two high densities. As shown in Figure 3,
the highest peaks of statisticS*detected by these meth- ent SNP densities. As shown in Figure 4, the functional site is detected by all three methods for candidate gene ods are all at or around the 557-bp functional site.
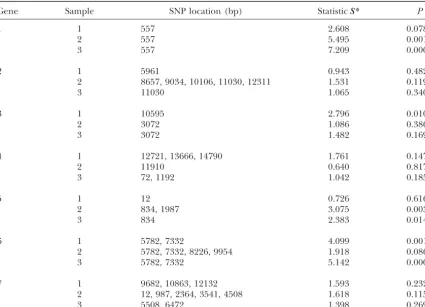
TABLE 3
The peak locations of the statisticS* andPvalues (each obtained empirically from 10,000 permutations) for
seven candidate genes
Gene Sample SNP location (bp) StatisticS* P
1 1 557 2.608 0.078
2 557 5.495 0.001
3 557 7.209 0.0004
2 1 5961 0.943 0.482
2 8657, 9034, 10106, 11030, 12311 1.531 0.119
3 11030 1.065 0.340
3 1 10595 2.796 0.010
2 3072 1.086 0.386
3 3072 1.482 0.169
4 1 12721, 13666, 14790 1.761 0.147
2 11910 0.640 0.817
3 72, 1192 1.042 0.185
5 1 12 0.726 0.616
2 834, 1987 3.075 0.003
3 834 2.383 0.014
6 1 5782, 7332 4.099 0.001
2 5782, 7332, 8226, 9954 1.918 0.086
3 5782, 7332 5.142 0.0001
7 1 9682, 10863, 12132 1.593 0.232
2 12, 987, 2364, 3541, 4508 1.618 0.115
3 5508, 6472 1.398 0.269
1000-bp intervals and at SNP site 7332 bp (which is 1550 1999;TengandRisch1999;ZhengandElston1999;
ZhuandElston2000, 2001) and proved to be powerful
bp away from the functional 5782-bp site) for
2000-bp intervals. Maximum statisticsS*obtained from our approaches to identify susceptibility genes for the dis-procedure are always greater than those obtained from ease of interest. However, to apply most, if not all, of the generalized or conventional TDT (see Figure 4, A these methods, one needs to either discard families with and B). When 5 SNPs atⵑ4000-bp intervals were used, ambiguous haplotypes or analyze the markers sepa-no linkage disequilibrium was detected by any method, rately, resulting in potential loss of power.
but our procedure and the generalized TDT method In this study, we propose a new procedure for nonpar-still produced smaller P values than those from the ametric disequilibrium mapping at a functional site (or conventional TDT (Figure 4C). region) within a candidate gene by using multiple tightly linked SNPs. For an arbitrary statisticSat positionx,we search over all haplotype widths (containingx) and find
DISCUSSION
that some of the peak locations of the maximum statistic
S*contain two linked markers while others might con-To date,ⵑ2.1 million SNPs have been identified in
tain three, four, or five linked markers (see Table 3). the human genome (Venteret al.2001). This rich
re-With our procedure, researchers do not need to know source should allow the initiation of genome-wide
link-prior to analysis what window width of haplotype is more age disequilibrium mapping of disease genes in the
appropriate for detecting a functional site or region. In human population (Lander et al. 2001). In the past,
contrast, the methods proposed by Clayton (1999) many LD analysis methods have been proposed (e.g.,
andZhaoet al.(2000) require assigning a window width
FalkandRubinstein1987;Ott1989;Thomsonet al.
first and then analyzing multisite parental transmission 1989;TerwilligerandOtt1992;Spielmanet al.1993;
data under this fixed width. Therefore, our procedure
ShamandCurtiss1995;Thomson1995;Schaid1996;
is more flexible, and it can find the maximum statistic
Spielmanand Ewens1996, 1998; Martin et al. 1997,
S*with an appropriate window width of haplotype trans-2000; Sham 1997; Xiong and Guo 1997; Lazzeroni
sin-Figure2.—Comparison of linkage disequilibrium analyses among our procedure (nonparametric disequilibrium, ND), the generalized TDT (using the program TRANSMIT;Clayton1999), and the conventional TDT method, for candidate genes 1 and 6 on samples 1, 2, and 3. The lines with open circles, triangles, and squares indicate the results from ND, TRANSMIT, and TDT, respectively. The average SNP interval for all candidate genes isⵑ1000 bp.
gle, two, or more multiple linked markers (ⱕm). Al- data set was rather complex (Almasyet al.2001). Seven major genes (MG) were assumed to influence one or though it is generally thought that a multiple-locus
approach may be more powerful than single-locus analy- more of five quantitative traits (Q1–Q5), disease liability, and age at onset. The disease liability was constructed sis, this does not mean that this is true in all cases. For
example, for candidate gene 1 in the simulated GAW as a function of Q1–Q5, MG6, and a mitochondrial component. MG6 provides a baseline liability value, 12 data set, it seems that the single-marker approach is
better than that of multiple markers. In contrast, for which is adjusted for Q1–Q5. MG6 and the mitochon-drial component have direct effects on liability and ac-candidate gene 6, we found that using the haplotype
transmission data of two linked markers appears to be count for 22 and 10% of its variance, respectively, con-ditional on other covariates like gender, age, and better than using those of a single marker, or three,
of the variance in liability, MG2 for 4.4%, MG3 for 8%, rectly affects liability and the functional site for candi-date gene 6, where only one functional site directly MG4 for 0.3%, and MG5 for 9%. Our procedure could
detect the functional site for candidate gene 1 that di- contributes to Q1 and Q2 and indirectly affects the affection status. But we could not detect the multiple functional sites for candidate gene 2, a quantitative trait gene with multiple functional sites. Therefore, for quan-titative traits controlled by multiple genes with relatively small effects or multiple functional sites each with a small genetic effect, such as candidate gene 2, other methods of using haplotype information should be con-sidered. Several methods focusing on this type of data have been proposed (Clayton1999;Liet al.2001;Schaid
et al.2002).
Using the procedure reported in this study, linkage disequilibrium due to the two simulated functional sites of candidate genes 1 and 6 (defined as MG6 and MG1, respectively, in the original model) were detected. Mul-tiple alleles were in candidate gene 2; all changes in regulatory elements or in the first or second base pair of a codon leading to amino acid substitutions were functional. However, this was not the case for candidate gene 6. Furthermore, candidate gene 2 directly contrib-utes to Q5 from multiple functional sites and then indi-rectly affects the affection status.
On the basis of the mapping results from our method and the generalized and conventional TDT methods on the GAW 12 simulated data set, it appears that our procedure is as sensitive and powerful as the TDT meth-ods for candidate gene 1, but is more powerful than the TDT methods for candidate gene 6. Additionally, we investigated how SNP density may affect the perfor-mance of our procedure. A functional SNP site for can-didate gene 1 was detected by all three methods, regard-less of SNP density and whether the functional SNP site was included or not. In contrast, a functional SNP site for candidate gene 6 was detected only at high SNP densities, not at low density. To explain this difference, we examined selected SNPs used under each density for both genes and found that a SNP at the 189-bp position of gene 1, which is only 368 bp away from the functional SNP site, was used for all analyses. However, for candidate gene 6 at the 4000-bp intervals, the closest SNP sites used in the analysis were at the 4848- and 9952-bp positions, which are either loosely linked or too far away from the functional site (5782 bp). Regard-less of which SNP density was used, overall, we found that our procedure and the generalized TDT method are less dependent on the SNP density than the
conven-Figure3.—Comparison of linkage disequilibrium analyses of our procedure with the generalized TDT (TRANSMIT;
tional TDT method is. Moreover, our program is more user friendly and less time consuming than the TRANS-MIT program with respect to file preparation before and after mapping analysis. For example, for candidate gene 1 under a density of 500-bp intervals, only 1 file was needed for our procedure, while for TRANSMIT we had to prepare 40, 39, 38, and 37 files for window widths of two, three, four, and five linked SNPs, respec-tively. Although these files can be prepared using a shell script for each selected window width, we still have to summarize a significant number of output files for com-paring the results.
Theoretically, our search procedure can cover as many loci as one wishes without limitation, except for the computer storage requirement. As needed, our method can be used for regional or genome-wide scan-ning to study LD using SNP markers. This represents another advantage of our program compared to other currently available procedures. It should be pointed out that if genome-wide high-density SNP data were available, then the size of the data file would become significantly large. The newly proposed haplotype block partition algorithms (Patil et al. 2001; Zhang et al.
2002a) can be employed to find appropriate blocks and select representative SNPs. To overcome the difficulty of extreme time cost and the limitation of computer storage in estimating large haplotypes of SNPs,Niu et al.(2002) and Qin et al.(2002) proposed a partition-ligation (PL) strategy together with Gibbs sampling and an EM algorithm. Their PL-EM algorithm (Qin et al.
2002) can be applied to haplotype estimation within a window for a large number of SNPs (e.g.,⬎20). These multimarker approaches can effectively extract informa-tion from a case-parent trio as well as case-control data and increase the efficiency and detection power in re-gional or genome-wide LD analysis.
An alternative approach to EM in inferring haplo-types has been suggested byClark(1990) and used in several recent studies (Reichet al.2001;Stephenset al.
2001). However, as discussed byClark (1990), several problems may arise with his procedure,e.g., the
possibil-Figure4.—Comparison of linkage disequilibrium analyses
ity of never being able to start the iterative algorithm
of the ND procedure with the generalized TDT and
conven-because of the absence of any unambiguous individuals
tional TDT methods for candidate gene 6 under SNP densities
in the sample. Instead of finding only a list of possible of (A) 1000-, (B) 2000-, and (C) 4000-bp intervals, respectively. haplotypes by Clark’s algorithm, the EM approach has The lines with open circles, triangles, and squares represent the advantage of estimating haplotype frequencies, the results from our procedure, the generalized TDT, and
the conventional TDT, respectively.
which in turn can be used directly for further2testing
in LD analysis.Stephenset al.(2001) proposed a new statistical method, applicable for genotype data at linked
man population evolutionary histories. Furthermore, loci, for haplotype reconstruction from population data,
their method cannot be applied to estimate the trans-based on an iterative sampling algorithm using a
pseudo-mission haplotype frequencies. The PL-Gibbs sampler Gibbs sampler. Their simulated results showed that
er-strategy proposed byNiuet al. (2002) not only can infer ror rates were reduced by⬎50% relative to its nearest
the haplotype phases with a large number of SNPs, but competitor (EM-derived haplotypes). However,Zhang
is also supposed to run faster than the method proposed
et al. (2001) compared the two methods and pointed
byStephenset al.(2001). It is possible to extend their out that one limitation of Stephenset al.’s study is the
method to estimate the affected (case) and unaffected fact that their simulations were based on coalescent
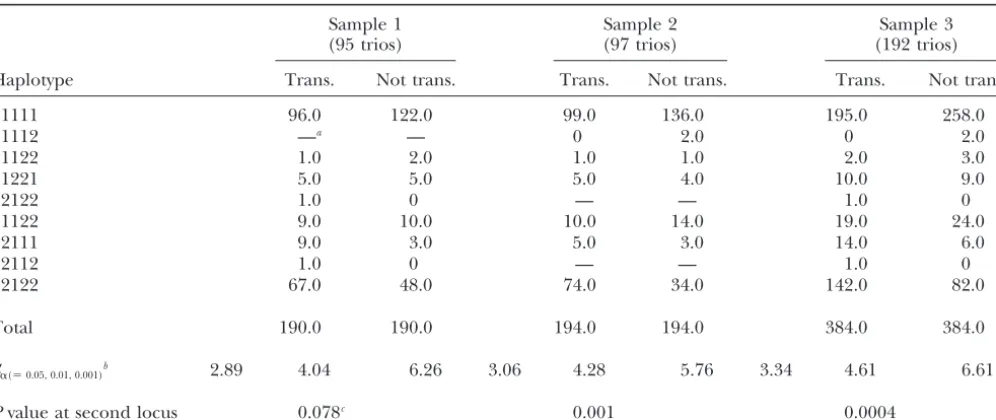
TABLE 4
EM-derived estimated numbers of haplotypes of the first five selected SNPs at 189, 557, 1505, 2732, and 3653 bp of candidate gene 1 and significance levels for the three samples studied
Sample 1 Sample 2 Sample 3
(95 trios) (97 trios) (192 trios)
Haplotype Trans. Not trans. Trans. Not trans. Trans. Not trans.
11111 96.0 122.0 99.0 136.0 195.0 258.0
11112 —a — 0 2.0 0 2.0
11122 1.0 2.0 1.0 1.0 2.0 3.0
11221 5.0 5.0 5.0 4.0 10.0 9.0
12122 1.0 0 — — 1.0 0
21122 9.0 10.0 10.0 14.0 19.0 24.0
22111 9.0 3.0 5.0 3.0 14.0 6.0
22112 1.0 0 — — 1.0 0
22122 67.0 48.0 74.0 34.0 142.0 82.0
Total 190.0 190.0 194.0 194.0 384.0 384.0
S␣(⫽0.05, 0.01, 0.001)b 2.89 4.04 6.26 3.06 4.28 5.76 3.34 4.61 6.61
Pvalue at second locus 0.078c 0.001 0.0004
Trans., transmitted.
aNo haplotype in the sample.
bEmpiricalP-valuesS*obtained from 10,000 randomized permutations for 0.05, 0.01, and 0.001 significance levels, respectively. cCorresponding statisticSat second locus; see Table 3.
and to estimate transmission haplotype frequencies for ally a maximumS(x) with the smallestPvalue is chosen as S*(x) at locus x. By applying the method to the independent case-parent trio data as done in Zhao et
al.(2000), together with the procedure reported herein. simulated data sets, we found that the shorter the win-dow width, the smaller the number of degrees of free-Indeed, this idea has been extended for case-control
association analysis with multiple tightly linked SNP dom. This suggests that the clustering of haplotypes into fewer groups may, in fact, improve the power of the markers by using EM-derived haplotype frequencies
(Fallinet al.2001). For example, if the haplotype fre- test.
The number of possible haplotypes increases rapidly quencies or numbers of multiple SNPs are estimated by
the PL-EM algorithm (Qinet al.2002) or the algorithm with the size of the searching window. To avoid very rare haplotypes, we compared sample sizes from 100 to proposed by Niu et al. (2002), we can calculate the
maximum statisticS*for each site with a wider moving 1000 and found that the maximum searching window width should be set in the range approximately four window to find associated functional sites or regions,
using simulation permutation to obtainP values as indi- to eight tightly linked SNPs (equivalent to ⵑ16–256 possible haplotypes). By empirical study, Niu et al.
cated here.
In the current version of our program, the missing (2002) andQinet al.(2002) also suggested that five to eight SNPs appeared to be a good choice for the atomis-genotype of a parent and/or the affected offspring at
any SNP site is assigned a code that differs from the tic unit size before the ligation step. Specifically, the maximum width was set at 5 in all the LD analyses codes assigned to the two possible SNPs at the position.
As expected, this approach will yield rare haplotypes, reported in this study. If the sample size is large enough, it is sufficient to use a single initial condition for the which may eventually affect the power of the test to
detect functional sites. haplotype frequencies (e.g., all haplotypes are set equally frequent) to start the EM estimation (HawleyandKidd
The chi-square statistic is highly sensitive to small cell
counts. Recently,Seltmanet al.(2001) pointed out that 1995;SlatkinandExcoffier1996). Given the sample size in the GAW 12 data set, we used this single initial although haplotypes are more informative than alleles
of individual SNPs in the transmission disequilibrium- condition. On the other hand, if the sample size is not large enough, then multiple initial conditions should based approach, the larger number of haplotypes
rela-tive to alleles at individual loci might decrease the statis- be used for EM estimation to avoid going to a local optimum.
tical power of haplotype-based TDT. The reason for
this may be the larger number of degrees of freedom An example has been given for the first five selected SNP loci of candidate gene 1 to illustrate our procedure. required. As indicated earlier, our program
TRANSMIT program and providing advice on using it. The use of
found by using the EM algorithm for the first five
se-the GAW 12 simulated data was permitted by se-the Southwest
Founda-lected SNPs of candidate gene 1 and P values for the
tion for Biomedical Research, which was supported by a GAW grant,
maximum statisticS*obtained from 10,000 randomized GM31575 from National Institute of General Medical Sciences. We permutations in all samples. The nonancestral and an- are grateful to Dr. Jean MacCluer and Ms. Vanessa Olmo for handling our request for the GAW 12 data. This research was supported in part
cestral sequence variants of candidate gene 1 were
by National Institutes of Health (NIH) grant DA12844 (to M.D.L.);
coded as alleles 1 and 2, respectively. On the basis of
GM28356, RR03655, and DK57292 (to R.C.E.); GM58934 (to F.A.W.);
the estimated haplotype numbers, it is easy to see
evi-National Science Foundation grant DMS-9971770 (to S.L.); and a
dence of ancestral haplotypes that are shared more of- General Clinical Research Center grant from the NIH (M01-RR00211) ten among the haplotypes transmitted than among awarded to the University of Tennessee Health Science Center.
those not transmitted to affected offspring. In this case, allele 2 at base pair 557 is associated with the disease.
Recently,Zhanget al. (2002b) applied the haplotype
LITERATURE CITED
block partition and “tag SNPs,” distinguishing
algo-Almasy, L., J. D. Terwilliger, D. Nielsen, T. D. Dyer, D. Zaykin
rithms to association studies. After haplotype block
par-et al., 2001 GAW12: simulated genome scan, sequence, and
tition, tag SNPs were further selected within each haplo- family data for a common disease. Genet. Epidemiol.21(Suppl.
1): S332–S338.
type block and used for association analysis. Their
Broder, S., andJ. C. Venter, 2000 Sequencing the entire genomes
simulation results indicated that the genotyping efforts
of free-living organisms: the foundation of pharmacology in the
can be significantly reduced by using the tag SNPs with- new millennium. Annu. Rev. Pharmacol. Toxicol.40:97–132.
Chiano, M., andD. Clayton, 1998 Fine genetic mapping using
out much loss of power, and haplotype-based LD
analy-haplotypes and the missing data problem. Ann. Hum. Genet.62:
sis can be much more powerful than marker-by-marker
55–60.
analysis. It seems that a more effective and powerful Churchill, G. A., andR. W. Doerge, 1994 Empirical threshold
values for quantitative trait mapping. Genetics138:963–971.
searching strategy should combine the procedures of
Clark, A. G., 1990 Inference of haplotypes from PCR-amplified
identifying haplotype block structure and the
corre-samples of diploid populations. Mol. Biol. Evol.7:111–122.
sponding tag SNPs with the PL-EM (Qin et al. 2002) Clayton, D. G., 1999 A generalization of the
transmission/disequi-librium test for uncertain-haplotype transmission. Am. J. Hum.
and/or PL-Gibbs sampling (Niuet al.2002) algorithms
Genet.65:1170–1177.
as well as our moving-window statisticS(x) and
permuta-Clayton, D. G., andH. Jones, 1999 Transmission/disequilibrium
tion methods. tests for extended marker haplotypes. Am. J. Hum. Genet.65: 1161–1169.
The procedure proposed in this study is
nonparamet-Collins, A., C. LonjouandN. E. Morton, 1999 Genetic
epidemiol-ric and robust. For a complex disease controlled by
ogy of single-nucleotide polymorphisms. Proc. Natl. Acad. Sci.
multiple genes, the effect of a functional site accounting USA96:15173–15177.
Cordell, H. J., andR. C. Elston, 1999 Fieller’s theorem and linkage
for as little as 4.6% of the variance in liability (e.g.,
disequilibrium mapping. Genet. Epidemiol.17:237–252.
candidate gene 6) could be detected with the sample
Dempster, A., N. LairdandD. Rubin, 1977 Maximum likelihood
size studied. Covariate factors such as gender, age, envi- from incomplete data via the EM algorithm. J. R. Stat. Soc. B39:
1–38.
ronment, the disease mode (dominant, recessive,
addi-Dudbridge, F., B. P. C. Koeleman, J. A. ToddandD. G. Clayton,
tive, or multiplicative), and penetrance, were not
con-2000 Unbiased application of the transmission/disequilibrium
sidered in the proposed method. Also, the power of a test to multilocus haplotypes. Am. J. Hum. Genet.66:2009–2012.
Excoffier, L., andM. Slatkin, 1995 Maximum-likelihood
estima-haplotype-based test study depends on the data
struc-tion of molecular haplotype frequencies in a diploid populastruc-tion.
ture, the trait of interest, the polymorphism information
Mol. Biol. Evol.12:921–927.
content of marker loci, the degree of LD among the Excoffier, L., andM. Slatkin, 1998 Incorporating genotypes of
relatives into a test of linkage disequilibrium. Am. J. Hum. Genet.
markers, the allele frequencies, the amount of
popula-62:171–180.
tion stratification, and the marker density. Our
ap-Falk, C. T., andP. Rubinstein, 1987 Haplotype relative risks: an
proach makes the implicit assumption that the under- easy reliable way to construct a proper control sample for risk calculations. Ann. Hum. Genet.51:227–233.
lying population is homogeneous. In a non-admixed
Fallin, D., andN. J. Schork, 2000 Accuracy of haplotype frequency
population, if linkage disequilibrium exists across a
re-estimation for biallelic loci, via the expectation-maximization
al-gion, then recombination must be quite infrequent and gorithm for unphased diploid genotype data. Am. J. Hum. Genet.
67:947–959.
probably can be safely ignored. If population migration,
Fallin, D., A. Cohen, L. Essioux, I. Chumakov, M. Blumenfeldet
admixture, or stratification is present, this should affect
al., 2001 Genetic analysis of case/control data using estimated
the estimates of allele or haplotype frequencies and haplotype frequencies: application to APOE locus variation and
Alzheimer’s disease. Genome Res.11:143–151.
decrease the power of LD detection. A model-based
Gabriel, S. B., S. F. Schaffner, H. Nguyen, J. M. Moore, J. Royet al.,
procedure implementing some appropriate parameters
2002 The structure of haplotype blocks in the human genome.
may then improve the power of the method. Also, it Science296:2225–2229.
Gao, X., andF. A. Wright, 1999 Nonparametric disequilibrium
remains to be determined in a future study whether our
mapping when haplotypes are available. Am. J. Hum. Genet.65
idea can be extended to other data structures, such as (Suppl.): A250.
nuclear families with multiple sibs and/or one or both Hawley, M. E., andK. K. Kidd, 1995 HAPLO: a program using the EM algorithm to estimate frequencies of multi-site haplotypes. J.
parents missing, or to extended pedigrees.
Hered.86:409–411.
The authors thank the editor, anonymous reviewers, and Dr. Hon- Hodge, S. E., M. BoehnkeandM. A. Spence, 1999 Loss of informa-gyu Zhao for their valuable comments and suggestions on the manu- tion due to ambiguous haplotyping SNPs. Nat. Genet.21:360–
in the presence of association: the sib transmission/disequilib-rium mapping of common disease genes. Nat. Genet.22:139–144.
Lander, E. S., L. M. Linton, B. Birren, C. Nusbaum, M. C. Zodyet rium test. Am. J. Hum. Genet.62:450–458.
Spielman, R. S., R. E. McGinnisandW. J. Ewens, 1993 The
transmis-al., 2001 Initial sequencing and analysis of the human genome.
Nature409:860–921. sion test for linkage disequilibrium: the insulin gene and
insulin-dependent diabetes mellitus (IDDM). Am. J. Hum. Genet.52:
Lazzeroni, L. C., and K. Lange, 1998 A conditional inference
framework for extending the transmission/disequilibrium test. 506–516.
Stephens, M., N. J. SmithandP. Donnelly, 2001 A new statistical Hum. Hered.48:67–81.
Li, J., D.Wang, J.Dong, R.Jiang, K.Zhanget al., 2001 The power method for haplotype reconstruction from population data. Am. J. Hum. Genet.68:978–989.
of transmission disequilibrium tests for quantitative traits. Genet.
Epidemiol.21(Suppl. 1): S632–637. Sun, F., W. D. Flanders, Q. YangandM. J. Khoury, 1999 Transmis-sion disequilibrium test (TDT) when only one parent is available:
Long, J. C., R. C. WilliamsandM. Urbanek, 1995 An E-M algorithm
and testing strategy for multiple-locus haplotypes. Am. J. Hum. the 1-TDT. Am. J. Epidemiol.150:97–104.
Teng, J., and N. Risch, 1999 The relative power of family-based Genet.56:799–810.
Martin, E. R., N. L. KaplanandB. S. Weir, 1997 Tests for linkage and case-control designs for linkage disequilibrium studies of complex human diseases. II. Individual genotyping. Genome Res. and association in nuclear families. Am. J. Hum. Genet.61:439–
448. 9:234–241.
Terwilliger, J. D., andJ. Ott, 1992 A haplotype-based “haplotype
Martin, E. R., S. A. Monks, L. L. WarrenandN. L. Kaplan, 2000
A test for linkage and association in general pedigrees: the pedi- relative risk” approach to detecting allelic associations. Hum. Hered.42:337–346.
gree disequilibrium test. Am. J. Hum. Genet.67:146–154.
Niu, T., Z. S. Qin, X. XuandJ. S. Liu, 2002 Bayesian haplotype Thomson, G., 1995 Mapping disease genes: family-based association studies. Am. J. Hum. Genet.57:487–498.
inference for multiple linked single-nucleotide polymorphisms.
Am. J. Hum. Genet.70:157–169. Thomson, G., W. P. Robinson, M. K. Kuhner, S. JoeandW. Klitz,
1989 HLA, insulin gene, and Gm associations with IDDM.
Ott, J., 1989 Statistical properties of the haplotype relative risk.
Genet. Epidemiol.6:127–130. Genet. Epidemiol.6:155–160.
Tishkoff, S. A., A. J. Pakstis, G. RuanoandK. K. Kidd, 2000 The
Patil, N., A. J. Berno, D. A. Hinds, W. A. Barrett, J. M. Doshiet
al., 2001 Blocks of limited haplotype diversity revealed by high- accuracy of statistical methods for estimation of haplotype fre-quencies: an example from the CD4 locus. Am. J. Hum. Genet. resolution scanning of human chromosome 21. Science 294:
67:518–522. 1719–1723.
Toivonen, H. T., P. Onkamo, K. Vasko, V. Ollikainen, P. Sevonet
Qin, Z. S., T. NiuandJ. S. Liu, 2002
Partition-ligation-expectation-al., 2000 Data mining applied to linkage disequilibrium map-maximization algorithm for haplotype inference with
single-ping. Am. J. Hum. Genet.67:133–145. nucleotide polymorphisms. Am. J. Hum. Genet.71:1242–1247.
Venter, J. C., M. D. Adams, E. W. Myers, P. W. Li, R. J. Muralet
Reich, D. E., M. Cargill, S. Bolk, J. Ireland, P. C. Sabetiet al.,
al., 2001 The sequence of the Human Genome. Science291: 2001 Linkage disequilibrium in the human genome. Nature
1304–1351. 411:199–204.
Wilson, S. R., 1997 On extending the transmission/disequilibrium
Risch, N. J., 2000 Searching for genetic determinants in the new
test (TDT). Ann. Hum. Genet.61:151–161. millennium. Nature405:847–856.
Xiong, M., andS. W. Guo, 1997 Fine-scale genetic mapping based
Sachidanandam, R., D. Weissman, S. C. Schmidt, J. M. Kakol, L. D.
on linkage disequilibrium: theory and applications. Am. J. Hum.
Steinet al., 2001 A map of human genome sequence variation
Genet.60:1513–1531. containing 1.42 million single nucleotide polymorphisms. Nature
Zhang, K., M. Deng, T. Chen, M. S. WatermanandF. Sun, 2002a 409:928–933.
A dynamic programming algorithm for haplotype block
parti-Seltman, H., K. RoederandB. Devlin, 2001
Transmission/disequi-tioning. Proc. Natl. Acad. Sci. USA99:7335–7339. librium test meets measured haplotype analysis: family-based
asso-Zhang, K., P. Calabrese, M. NordborgandF. Sun, 2002b Haplo-ciation analysis guided by evolution of haplotypes. Am. J. Hum.
type block structure and its applications to association studies: Genet.68:1250–1263.
power and study designs. Am. J. Hum. Genet.71:1386–1394.
Schaid, D. J., 1996 General score tests for associations of genetic
Zhang, S. L., A. J. Pakstis, K. K. KiddandH. Y. Zhao, 2001 Compar-markers with disease using cases and their parents. Genet.
Epide-isons of two methods for haplotype reconstruction and haplotype miol.13:423–449.
frequency estimation from population data. Am. J. Hum. Genet.
Schaid, D. J., C. M. Rowland, D. E. Tines, R. M. JacobsonandG. A.
69:906–911.
Poland, 2002 Score tests for association between traits and
Zhao, H. Y., S. L. Zhang, K. R. Merikangas, M. Trixler, D. B.
haplotypes when linkage phase is ambiguous. Am. J. Hum. Genet. Wildenaueret al., 2000 Transmission/disequilibrium tests us-70:425–434.
ing multiple tightly linked markers. Am. J. Hum. Genet. 67:
Sham, P., 1997 The transmission/disequilibrium tests for multial- 936–946.
lelic loci. Am. J. Hum. Genet.61:774–778. Zheng, C., andR. C. Elston, 1999 Multipoint linkage
disequilib-Sham, P. C., andD. Curtis, 1995 An extended transmission/disequi- rium mapping with particular reference to the African-American librium test (TDT) for multi-allele marker loci. Ann. Hum. Genet. population. Genet. Epidemiol.17:79–101.
59:323–336. Zhu, X., andR. C. Elston, 2000 Power comparison of regression
Slatkin, M., andL. Excoffier, 1996 Testing for linkage disequilib- methods to test quantitative traits for association and linkage. rium in genotypic data using the EM algorithm. Heredity 76: Genet. Epidemiol.18:322–330.
377–383. Zhu, X., and R. C.Elston, 2001 Transmission/disequilibrium tests
Spielman, R. S., andW. J. Ewens, 1996 The TDT and other family- for quantitative traits. Genet. Epidemiol.20:57–74. based tests for linkage disequilibrium and association. Am. J.