XU, YIZHE. Modeling and Control of Grid-Connected Microgrid as Solid State Synchronous Machine (SSSM). (Under the direction of Dr. Alex Qin Huang.)
The research work aims to study the grid-connected operation of a recently developed
power electronics interface for high penetration of distributed renewable energy resources
(DRER) integration, the solid state synchronous machine (SSSM). The SSSM is a physical
and software platform that interfaces between the AC grid and various DRER. It will not
only fulfill the role of a traditional distribution transformer for electricity delivery, but also
supply with ancillary service to improve power quality, frequency and voltage stability. With
the developed benefits, the SSSM is therefore a significant step forward to supporting high
penetration DRER integration.
Two particular problems that have been of primary focus in high DRER penetration
are issues with frequency regulation and voltage rise. The occurrence of frequency and
voltage instability in power system practice will be described in first chapter. The state of
art for the solution on traditional power system practice, grid-connected DC/AC inverter,
DC microgrid and virtual synchronous machine will be list by detailed literature review.
The SSSM will mimic a synchronous machine which contains (1) a Volt-Var regulation
capability to provide voltage support; (2) a frequency regulation capability to emulate the
angle swing characteristic; (3) an improved dual droop control between AC grid frequency
and DC side energy storage cells. Under the above control strategy, both frequency and
voltage issues could be effectively solved. The detailed circuit, control and operation of
SSSM and coordinated DRER system will be introduced in second chapter.
Small signal model of SSSM based DRER system has been built in third chapter. Stability
first introduced to enhance SSSM’s stability by damping oscillations while interaction with
power system synchronous generators. Furthermore, a detailed design procedure has been
made up for SSSM in fourth chapter. Besides of the capacity requirement of energy storage,
a virtual impedance has been newly introduced in SSSM control to replace part of the
physical large inductor required for voltage-source SSSM.
The control concept of SSSM is specifically applied for photovoltaic generation system,
named Photovoltaic Synchronous Generator (PVSG). PVSG could potentially be the next
generation PV inverter. Not only the conventional PV inverter (Maximum Power Point Track)
MPPT could be implemented, but the power variation in PV generation could be effectively
smoothed with improved voltage profile and frequency response. The required energy is
supplied by the proposed hybrid energy storage system, all described in fifth chapter.
The effectiveness of the SSSM and PVSG control strategy has been verified by simulation
and experimental results in sixth chapter. The contribution on power system voltage and
frequency stability is promising, and will finally promote the high penetration of DRER
integration. In seventh chapter, future work is described that integrates data collection,
communication to SSSM and PVSG. Three phase prototype will also be built, connected
with weak grid such as a synchronous generator to verify the voltage and frequency
stabil-ity improvement in high DRER penetration system. The simplified model for large scale
simulation is also required in future study for power system application and potential
by Yizhe Xu
A dissertation submitted to the Graduate Faculty of North Carolina State University
in partial fulfillment of the requirements for the Degree of
Doctor of Philosophy
Electrical Engineering
Raleigh, North Carolina
2017
APPROVED BY:
Dr. Iqbal Husain Dr. Ning Lu
To my parents
Yizhe Xu was born in 1988 and raised in Harbin, China. He received the B.Sc. degree from
Wuhan University, Wuhan, China, in 2010, and the M.Sc. degree from North Carolina State
University, Raleigh, NC, USA, in 2012, both in Electrical Engineering. He is currently working
towards his Ph.D. degree at the FREEDM Systems Center, Department of Electrical and
Computer Engineering, North Carolina State University, where he has been a Research
Assistant since 2011.
His research interests include power electronics converter control, Solid State Transformers,
virtual synchronous machines, integration of distributed renewable energy resources, and
I would like to express my deepest gratitude to my advisor, Dr. Alex Huang, for his
guid-ance, continous support and encouragement throught my PhD study. I have benefited
tremendously from his extensive knowledge, broad vision and creative thinking during
my research work. It has been always joyful and inspiring to discuss various subjects with
him. I am grateful to Dr. Iqbal Husain, Dr. Ning Lu, Dr. Xiangwu Zhang, Dr. Wensong Yu,
Dr. Jayant Baliga, Dr. Aranya Chakrabortty, Dr. Mesut Baran, Dr. Subhashish Bhattacharya,
Dr. Srjan Lukic, Dr. Doug Hopkins, Dr. David Lubkeman from NC state Univeristy and Dr.
Qing-an Zeng from NC A&T University for their valuable discussions and guidance about
my research.
I am deeply thankful to the team members including Dr. Dong Chen, Dr. Ruiyang Yu,
Dr. Zhigang Liang, Dr. Elie Najm, Dr. Chushan Li, Dr. Xu She, Dr. Fei Wang, Dr. Xijun Ni,
Mr. Swanand Juvekar, Mr. Fei Xue, Dr. Qi Tian, Dr. Ankan De, Ms. Huan Hu, Dr. Mingkui
Wei, Dr. Yen-mo Chen, Dr. Kuijun Lee, Mr. Yang Lei, Ms. Sarah Hambridge, Dr. Mohammad
Ali Rezaei, Mr. Xiangjun Song, Ms. Lan Ma, Mr. Tianxiang Chen, Mr. Junhong Song, Mr.
Qingxuan Ma and many others who have worked on the GEH (Green Energy Hub), PV PnP
and PVSG related projects.
It has been a great pleasure to work with so many talented and helpful colleagues and
friends in FREEDM systems center. I would like to thank Dr. Gangyao Wang, Dr. Jun Li, Dr.
Yu Du, Dr. Xiang Lu, Dr. Xiaofeng Yang, Dr. Wenxi Yao, Dr. Wu Chen, Dr. Tiefu Zhao, Dr.
Xiaohu Zhou, Dr. Lijun Zheng, Dr. Xuan Li, Dr. Qian Chen, Dr. Xiaoqing Song, Dr. Chang
Peng, Dr. Li Wang, Mr. Qianlai Zhu, Mr. Qingyun Huang, Dr. Leonard White, Dr. Moyeen
ul Huq, Dr. Sheng Zong, Dr. Lin Liang, Dr. Zhan Shen, Dr. Sanzhong Bai, Dr. Mengchia Li,
Dr. Wengcong Su, Dr. Yu Liu, Dr. Pochih Lin, Dr. Wenxu Zhao, Mr. Yang Xu, Dr. Zhengping
Xi, Dr. Eric Green, Mr. Liqi Wang, Ms. Lisha Sun, Ms. Yue Shi, Mr. Mingqi Huo, Mr. Haotao
Ke, Mr. Yiwei Xiong, Mr. Jiadi Jiang, Dr. Jianhua Zhang, Mr. Yalin Wang, Mr. Jia Wang, Ms.
Jing Yao, Mr. Zhiping Chen, Mr. Youxi Shao, Mr. Xingchen Yang, Mr. Li Jiang, Mr. Yike Li, Dr.
Habiballah Rahimi Eichi, Dr. Wentao Sun, Dr. Zheng Zeng, Dr. Xiaohang Sun, Dr. Sijia Guo,
Dr. Wan Jiao, Ms. Lei Lei, Dr. Ghazal Falahi, Dr. Changjian Hu, Dr. Wenchao Song, Dr. Jiwei
Fan, Dr. Zhuoning Liu, Dr. Xiyuan Ma, Mr. Jason Petron, Mr. Jingjing Gong, Mr. Zhao Wang,
Ms. Tong Wei, Ms. Chunxue Yang, Ms. Xichun Ying, Ms. Luyue Zhang, Ms. Xingyu Li, Ms.
Yuling Zhao, Mr. Nan Xue, Mr. Yao Meng, Dr. Jiahong Yan, Ms. Xiangqi Zhu, Mr. Wei Jing,
Mr. Jiyu Wang, and etc.
I would also like to thank the FREEDM administrative and lab management staffs, Mr.
Hulgize Kassa, Ms. Karen Autry, Ms. Colleen Reid, Ms. Rebecca McLennan, Mr. Roy Charles,
Mr. Rogelio Sulivan, Dr. Ewan Pritchard, Mr. Seth Crossno, Ms. Audrey Callahan, Ms. Penny
Jeffrey, Ms. Pam Carpenter, for their countless help during my research.
My heartfelt appreciation goes toward my parents, Guangchen Xu and Huiyun Xu for
LIST OF TABLES . . . ix
LIST OF FIGURES. . . x
Chapter 1 INTRODUCTION. . . 1
1.1 Overview of DRER Integration . . . 2
1.1.1 Defining DRER Penetration . . . 2
1.1.2 Current Development of DRER Integration . . . 4
1.2 Impact of DRER Integration . . . 8
1.3 Voltage Quality Issues . . . 17
1.3.1 Voltage Rise . . . 17
1.3.2 Voltage Sag . . . 28
1.3.3 Voltage Flicker . . . 29
1.4 Frequency Stability . . . 30
1.4.1 Frequency Response . . . 30
1.4.2 Frequency Regulation . . . 35
1.5 Outline . . . 40
Chapter 2 SOLID STATE SYNCHRONOUS MACHINE . . . 43
2.1 Overview . . . 43
2.2 Frequency Regulation . . . 46
2.2.1 Inertia Support . . . 49
2.2.2 Damping Coefficient . . . 53
2.3 Volt-Var Control . . . 54
2.4 Dual Droop Control . . . 55
Chapter 3 STABILITY ANALYSIS OF SSSM SYSTEM . . . 61
3.1 Overview . . . 61
3.2 Small Signal Modeling . . . 64
3.2.1 Modeling of SSSM . . . 64
3.2.2 Modeling of DC Microgrid . . . 67
3.3 Stability Analysis . . . 72
3.3.1 Original SSSM . . . 72
3.3.2 DC Microgrid Interaction . . . 73
3.3.3 Power System Stabilizer (PSS) . . . 75
Chapter 4 DESIGN AND OPTIMIZATION . . . 80
4.1 Overview . . . 80
4.2.3 DC/DC Converter for Battery . . . 94
4.3 Controller Design . . . 95
4.3.1 Power Electronics Control . . . 96
4.3.2 Power System Control . . . 99
4.3.3 Power System Stabilizer . . . 106
4.4 Virtual Impedance Design . . . 111
Chapter 5 PV Synchronous Generator . . . 113
5.1 Overview . . . 113
5.2 Control and Operation . . . 114
5.2.1 AC Frequency and DC Voltage Regulation . . . 114
5.2.2 Integrated MPPT Control . . . 118
5.2.3 Droop Control for Energy Storages . . . 119
5.3 Small-Signal Analysis . . . 122
5.3.1 Modeling of PV Arrays, MPPT Control and Energy Storage Unit . . . . 122
5.3.2 Modeling of PVSG . . . 125
5.3.3 MPPT Control’s Limitation . . . 128
5.4 Hybrid Energy Storage . . . 130
5.4.1 Energy Storage Unit’s Power Rating . . . 131
5.4.2 Energy Storage Unit’s Capacity Requirement . . . 131
5.4.3 Hybrid Energy Storage . . . 135
Chapter 6 SIMULATION AND EXPERIMENTAL . . . 142
6.1 Overview . . . 142
6.2 Simulation Results . . . 143
6.2.1 Case I: Load Change . . . 147
6.2.2 Case II: Source Change . . . 148
6.2.3 Case III: Governor-like Control . . . 149
6.2.4 Case IV: Island and Synchronization . . . 151
6.2.5 Virtual Impedance . . . 154
6.2.6 Voltage and Frequency Regulation . . . 155
6.3 SSSM Experimental Results . . . 156
6.3.1 Case I: Load Change . . . 158
6.3.2 Case II: Source Change . . . 160
6.3.3 Case III: Governor-like Control . . . 160
6.3.4 Case IV: Island and Synchronization . . . 162
6.3.5 PSS Regulator . . . 163
6.4 PVSG Experimental Results . . . 164
Chapter 7 CONCLUSION AND FUTURE WORKS . . . 170
7.1 Conclusion . . . 170
7.2 Future Works . . . 172
Table 1.1 Define Penetration by Various Metrics . . . 4 Table 1.2 ANSI C84.1 Voltage Range for 120V voltage level . . . 13 Table 1.3 Characteristics of the Scenarios . . . 33 Table 1.4 Frequency Security Indices for different PV penetration scenarios . . . . 34 Table 1.5 Frequency Regulation Measures from Utility, DRER and Demand Side
Management . . . 42
Table 3.1 Parameters of a single SSSM system . . . 63
Table 4.1 Hardware parameters of SSSM . . . 92
Figure 1.1 Solar PV Global Capacity, 2004-2014 . . . 6
Figure 1.2 Wind Power Global Capacity, 2004-2014 . . . 7
Figure 1.3 Estimated Renewable Energy share of Global Electricity Production, End-2014 . . . 8
Figure 1.4 PV System Output for Summer Week . . . 10
Figure 1.5 PV System Output for Winter Week . . . 11
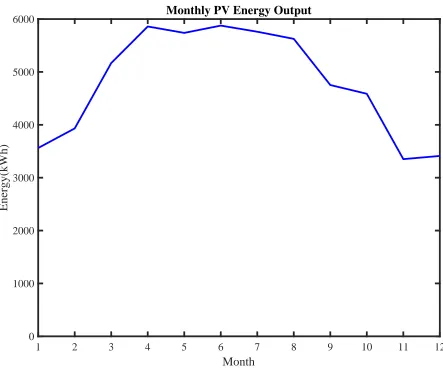
Figure 1.6 Monthly Total PV System Energy Output . . . 12
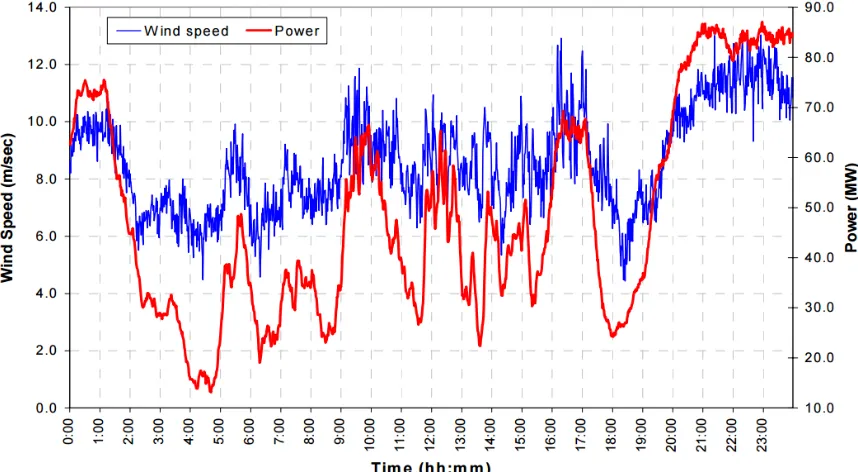
Figure 1.7 1-minute average power and wind speed plot . . . 13
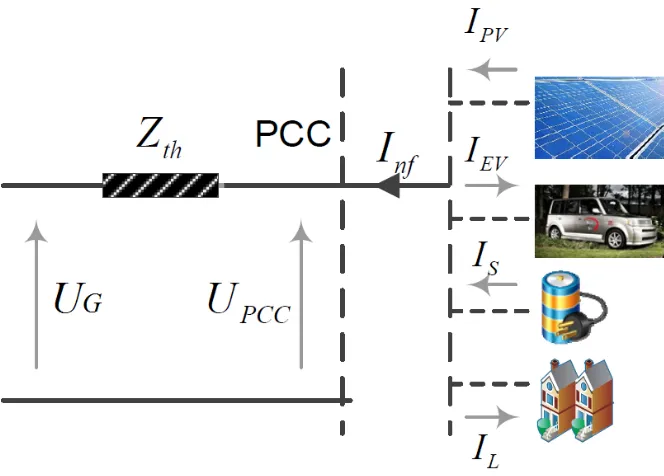
Figure 1.8 Equivalent circuit of a typical DRER system connected to the grid . . . . 17
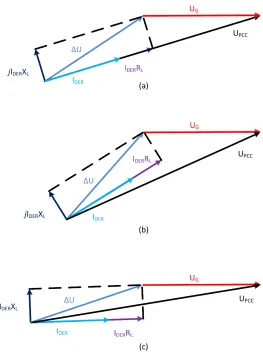
Figure 1.9 Phasor Diagram of Grid and PCC voltage, (a) PF=1.0, (b) PF=-0.9 (c) PF=0.9 . . . 19
Figure 1.10 One-line diagram of the IEEE 34 node test feeder . . . 21
Figure 1.11 Per unit voltage at the end of the circuit (node 840) for operation during an entire year (2010) (a) with no PV interconnected onto the circuit (b) with 2-MW PV plant interconnected at the end of the circuit (node 840) 21 Figure 1.12 Voltage profile at peak load with a PV penetration of 10% and 50% . . . 22
Figure 1.13 Voltage profile at zero load with a PV penetration of 50% . . . 23
Figure 1.14 Voltage profile at zero load with a PV penetration of 50% at (a) 0.95 PF and (b) 0.85 PF . . . 24
Figure 1.15 Frequency response with different PV penetration scenarios . . . 34
Figure 1.16 Frequency Control under normal conditions and coordinated under all conditions . . . 36
Figure 1.17 Sequence and Coordination of Utility Frequency Control Stages . . . 37
Figure 2.1 Overall architecuture of the SSSM and the control strategy . . . 45
Figure 2.2 Power circuit diagram of the SSSM . . . 47
Figure 2.3 Detailed control strategy diagram of the SSSM . . . 47
Figure 2.4 Block diagram of the SSSM’s virtual rotor model . . . 51
Figure 2.5 Dual Droop Control Coordination Diagram . . . 56
Figure 2.6 Detailed control diagram of battery cell . . . 57
Figure 2.7 Comparison between power controls: (a) traditional active power con-trol of the SM; (b) dual droop concon-trol of SSSM . . . 59
Figure 3.1 Single Machine Infinite Bus System with SSSM and DC Microgrid . . . . 62
Figure 3.2 Overall block diagram for SSSM small signal model . . . 71
Figure 3.3 Overall block diagram for SSSM small signal model with updated PSS . 79 Figure 4.1 Single Machine Infinite Bus System with SSSM and DC Microgrid . . . . 81
Figure 4.5 Plots of DC voltage ripple (half of peak-peak difference), active/reactive power from PCC at differentCd c values. Flat top (2V) shows the ripple
limit is reached. . . 93
Figure 4.6 Bi-directional DC/DC converter for Battery interconnection . . . 94
Figure 4.7 Efficiency curve under different load. Yellow: Charging mode. Blue: Discharging mode. . . 95
Figure 4.8 Bode Plots for Current Controller . . . 97
Figure 4.9 Bode Plots for Dual Loop Controller . . . 98
Figure 4.10 Volt-Var Droop Control . . . 100
Figure 4.11 SSSM Operation Area . . . 101
Figure 4.12 Plots of∆SSS M for full load range with different line impedance cases. . 103
Figure 4.13 Jv i r limit for different line impedance without energy storage. . . 103
Figure 4.14 Root locus of the three dominant eigenvalues for SSSM model,La c = 3.1m H . . . 105
Figure 4.15 Root locus of the three dominant eigenvalues for SSSM model,La c = 12.1m H . . . 105
Figure 4.16 KP SS vs. SSSM power Curve,La c =3.1m H . . . 106
Figure 4.17 KP SS vs. SSSM power Curve,La c =12.1m H . . . 107
Figure 4.18 Symmetric Adaptive gain method forKS T AB . . . 108
Figure 4.19 Adaptive gain method for High X/R CaseKS T AB . . . 108
Figure 4.20 Adaptive gain method for Low X/R CaseKS T AB . . . 109
Figure 4.21 Root locus of the three dominant eigenvalues of SSSM model withGP SS and 600W load:−20<KS T AB<20 . . . 110
Figure 5.1 Overall architecture of the PVSG with energy storage units . . . 115
Figure 5.2 Detailed control strategy of PVSG including DC-DC converter for for energy storages . . . 115
Figure 5.3 Block diagram of the linearized PVSG’s virtual rotor model . . . 117
Figure 5.4 PV array diagram: (a) Equivalent circuit model of a single PV array; (b) Power-voltage curve . . . 123
Figure 5.5 Overall block diagram for PVSG small signal model . . . 127
Figure 5.6 Locus of first three dominant eigenvalues for PVSG model:Jv i r =4,vd c = 193.1V, 25◦C, A.M1.5, 1000W/m2 (a) 0.1 < V s t e p/Ps t e p < 0.35; (b) 0.0003185<TM P P T <0.3185 . . . 130
Figure 5.10 Simulation results with different Jv i r andKe s (a) maximumrP V SG; (b)
maximum∆Ee s . . . 137
Figure 5.11 Simulation results on energy capacity requirement with different irra-diation data . . . 137
Figure 5.12 Control Diagram for Energy Storage Units: (a) Ultra Capacitor; (b) Bat-tery Unit . . . 138
Figure 5.13 (a)1s Resolution PV Power and Grid Frequency; (b) Power Output from Ultracapacitor and Battery Unit . . . 139
Figure 6.1 System Diagram for simulation and experiments . . . 144
Figure 6.2 Simulation Schematic: System Level . . . 145
Figure 6.3 Simulation Schematic: SSSM Block . . . 145
Figure 6.4 Simulation Schematic: Energy Storage Block . . . 146
Figure 6.5 Simulation Schematic: PV Block . . . 146
Figure 6.6 Simulation results of Case I: (a) Jv i r =1.06; (b) Jv i r =4.24 . . . 148
Figure 6.7 Simulation results of Case II: (a) Jv i r =1.06; (b) Jv i r =4.24 . . . 149
Figure 6.8 Simulation results of Case III . . . 150
Figure 6.9 Simulation results of Case IV: (a) reconnecting with battery cell and load; (b) reconnecting with battery cell and PV . . . 151
Figure 6.10 Flow chart of the synchronization process in SSSM . . . 153
Figure 6.11 Transition for different reconnection points, Green:δg =π/2, Blue: δg =π/3, Red:δg=π/4, Black:δg=0 . . . 154
Figure 6.12 Virtual Impedance Verification, Lime Green:Lv i r =6m H, Blue:Lv i r = 4.5m H, Red:Lv i r =3m H, Black:Lv i r =0m H . . . 155
Figure 6.13 Reactive Power support for Volt-Var Control . . . 156
Figure 6.14 Frequency Response with Different Virtual InertiaJv i r, Magenta: Jv i r = 0.53; Black: Jv i r =1.06; Blue: Jv i r =2.12; Red: Jv i r =4.24; Green: Jv i r = 8.48 . . . 157
Figure 6.15 SSSM Prototype . . . 158
changes to 0A; (d) Jv i r =1.06, 0A source changes to 2.5A. CH1:Po u t (500W/div); CH2:ω(0.08πrad/s/div); CH3:vd c (10V/div); CH4:ib a t
(2A/div); X-axis: timet(400ms/div) . . . 161 Figure 6.18 Experimental results of Case III: CH1:Po u t (500W/div); CH2:ω(0.08
πrad/s/div); CH3:vd c (10V/div); CH4:ib a t (2A/div); X-axis: timet
(20s/div) . . . 162 Figure 6.19 Experimental results of Case IV: (a) reconnecting with battery cell and
load; (b) recoonecting with battery cell and PV cell. CH1:Po u t (500W/div); CH2:ω(0.08πrad/s/div); CH3:vd c (10V/div); CH4:ib a t (2A/div); X-axis: timet(400ms/div) . . . 163 Figure 6.20 Experimental results of Case V: (a) withGP SS(s); (b) withoutGP SS(s).
CH1:Po u t (500W/div); CH2:ω(0.08πrad/s/div); CH3:vd c (10V/div); CH4:ib a t (2A/div); X-axis: timet(400ms/div) . . . 164 Figure 6.21 Experimental results of Case I at Jv i r =0.5: (a) shading; (b) unshading.
CH1:ip v (2A/div); CH2:Po u t (300W/div); CH3:ω (0.08πrad/s/div); CH4:vd c (10V/div); X-axis: timet(400ms/div) . . . 165 Figure 6.22 Experimental results of Case I at Jv i r =4: (a) shading; (b) unshading.
CH1:ip v (2A/div); CH2:Po u t (300W/div); CH3:ω (0.08πrad/s/div); CH4:vd c (10V/div); X-axis: timet(400ms/div) . . . 166 Figure 6.23 Experimental results of Case II: CH1:ip v(2A/div); CH2:Po u t (300W/div);
CH3:ω(0.08πrad/s/div); CH4:ie s (2A/div); X-axis: timet(20s/div) . . 167 Figure 6.24 Experimental results of Case III: CH1:ip v (2A/div); CH2:Po u t(300W/div);
1
INTRODUCTION
The first chapter introduces the background of Distributed Renewable Energy Resources
(DRER) integration in conventional power grid. The penetration of DRER integration is
defined and develops rapidly during last decades. However, the penetration level is still
limited due to following reasons,[KIv]
1. The variability of DRERs increases fluctuation of net load, causing a notable increase
in generation re-dispatch.
to unbalance between power supply and demand.
3. Lack of stabilizing inertia from large rotating machines has raised general concern
for maintaining the regulated frequency.
4. Risk of mass disconnection of DRERs generation in the event of frequency or voltage
variation results in system instability, load shedding and other protection events,
threatening both physical or cyber security.
5. Despite DRER potential environmental and economic benefits, many challenges
remain in the marketplace for greater adoption of DRERs.
The concept of Solid State Synchronous Machine (SSSM) is introduced to overcome the
technical challenges. Compared with previous research results from detailed literature
review, the SSSM has following features[DCHb]:
1. Volt-Var regulation capability to provide voltage support
2. Frequency regulation capability to emulate the rotor angle swing characteristic
3. Improved dual droop control between AC grid frequency and DC side energy storage
cells[NPGr]
1.1
Overview of DRER Integration
1.1.1
Defining DRER Penetration
Four separate matrics define the DRER penetration level, each of which may lead to
aggregate capacity either to the peak load or to the system’s total installed capacity. The
latter ratio gives a smaller value due to the requirement of reserve capacity in excess of peak
load for power system stability. For islanded power system and utilities with few or no
inter-connections, even larger reserve capacity levels are maintained than large interconnected
grid-connected systems.
Instantaneous DRER penetration measures the ratio of DRER power to the system
load at any given instant. It varies from moment to moment as the DRER varies. The peak
instantaneous penetration is the highest level that the instantaneous penetration ever
reaches. Take the wind turbine as the example, the peak instantaneous occurs in the middle
of a windy night. This metric can have a value over twice as the previous metrics for the same
system, also true for PV system to a smaller degree. The peak instantaneous penetration
ratio is the relevant measure for much of the integration analysis that evaluates the effect of
DRER integration on power quality and system stability of the overall electric utility system.
The ratio of the renewable power system’s energy output to the total energy production
of the electric system results in the smallest penetration value for a particular system due
to variability and intermittence of the DRER. This metric can be useful as a rough proxy for
DRER generation’s impact on carbon emissions or fuel consumption, depending on the
type and size of DRERs and enviromental factors.
To illustrate the differences between these definitions, consider a system with 1MW
peak load and 200kW of DRER integration as measured by the nameplate rating. If the
minimum load for the system is 400kW, the peak instantaneous penetration would be 50
percent, assuming that the 200kW is a wind farm occasionally produced at peak power
capacity would be 1.5MW. The penetration by that metric would be 13.33 percent. Finally,
if the wind farm has a capacity factor of 30 percent and the electric system has a load factor
of 60 percent, the penetration in energy terms would be 10 percent (60kW/600kW). A PV
plant with a 20 percent capacity factor would have a penetration in energy terms of 6.67
percent (40kW/600kW). The summary is list in Table 1.1 below.
Table 1.1Define Penetration by Various Metrics
Various Metrics Wind PV
Peak Instantaneous Penetration 50% 30%
Penetration Based on Peak Load 20% 20%
Penetration Based on System Capacity 13.33% 13.33%
Penetration Based on Energy 10% 6.67%
To evaluate the degree of DRER integration, the matric of penetration based on system
capacity is applied in this report.
1.1.2
Current Development of DRER Integration
The fossil fuels such as coal, petroleum and natural gas for thermal power station take
mil-lions of year to make. They are not renewable and depleted slowly because of constant use.
Besides, the combustion of fossil fuels contributes the most to acid rain and air pollution,
and has been connected with global warming. Due to the chemical compostion of fossil
air pollution from the emission of gases such as carbon dioxide, nitrogen oxides and sulfur
dioxide.
There is no shortage of renewable energy from the sun, wind, water and biomass. The
hydroelectricity is the most widely used form of renewable energy, accounting for 16
per-cent of global electricity generation with the advantages of flexibility, low power costs,
suitability for industrial applications and reducedC O2emissions. However, it may suffer from ecosystem damage, loss of land, siltation, flow shortage, methane emissions from
reservoirs, relocation and failure risks. Conventional power stations, such as coal-fired, gas
and nuclear powered plants, as wells as hydroelectric dams and large-scale solar power
sta-tions, are centralized and often required to be transmitted over long distances. By contrast,
DRER systems are decentralized, modular and more flexible technologies, that are located
close to the load they serve, albeit having capacities of only 10 MW or less. Solar energy
and wind power are typically used in DRER systems and increasingly play an important
role for the electric power distribution system.
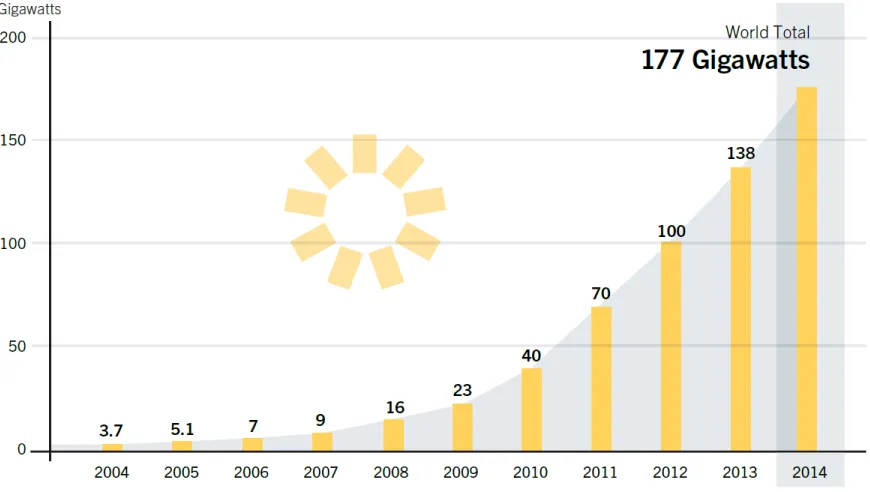
Solar PV is starting to play a substantial role in electricity generation in some countries as
rapidly falling costs have made unsubsidised solar PV-generated electricity cost-competitive
with fossil fuels in an increasing number of locations around the world. From 2004 to 2014,
solar PV global capacity increased from 3.7 GW to 177 GW, as shown in Fig. 1.1.
An estimated 40 GW solar PV has been installed in 2014, for a total global capacity of
about 177 GW. China, Japan, and the United States accounted for the vast majority of new
capacity, but the distribution of new installations continued to broaden, with Latin America
seeing rapid growth, significant new capacity added in several African countries, and new
Figure 1.1Solar PV Global Capacity, 2004-2014
lead the total solar PV capacity, particular Germany.
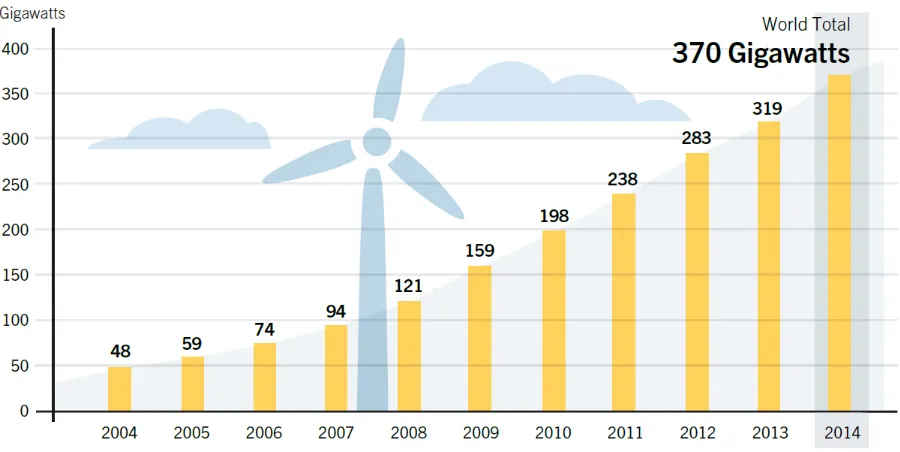
Wind energy is the least-cost option for new power generating capacity in an increasing
number of locations, and new markets emerged in Africa, Asia and Latin America. From
2004 to 2014, wind power global capacity increased from 48 GW to 370 GW, as shown in Fig.
1.2.
A record 51 GW, the most of any renewable technology was added in 2014, for a year-end
total of 370 GW. Asia remained the largest market, led by China and overtook Europe in
total capacity. The United States was the leading country for wind power generation. Wind
power met more than 20% of electricity demand in serveral countries, including Denmark,
Nicaragua, Portugal, and Spain. Turbine designs for use on- and offshore continued to evolve
Figure 1.2Wind Power Global Capacity, 2004-2014
Globally, there is growing awareness that increased deployment of renewable energy
is critical for addressing climate change, creating new economic opportunities, and
pro-viding energy access to the billions of people still living without modern energy services.
Renewables represented approximately 59% of net additions to global power capacity in
2014, with significant growth in all regions. By the end of 2014, renewables comprised an
estimated 27.7% of the world’s power generating capacity, enough to supply an estimated
Figure 1.3Estimated Renewable Energy share of Global Electricity Production, End-2014
1.2
Impact of DRER Integration
High penetration of DRER integration has been set to be a long-term and sustainable
target for energy planning policy up from 138 countries till 2014, which is over 9 times
higher than 15 countries in 2005. However, although power electronics based converters
for renewable resources develop rapidly during last 20 years beneficial from the evolution
of power devices, circuit topology and control strategies with higher efficiency and lower
cost, conventional fossil fuels and nuclear energy system still dominates the current power
grid, as shown in Fig.1.3. Even for the renewables, the centralized hydropower accounts for
72.8%, which is not convenient for distributed generation. For solar PV and wind power,
only 0.9% and 1.8% are accounted for the share of global electricity production, respectively
till end of 2014.[Admt a]
High peak instantaneous DRER penetration level (over 50%) has already been
for state and country level, DRER penetration level is still limited under 20% based on
system capacity due to following reasons from both economic and technical perspectives.
1. The variability of DRERs increases fluctuation of net load, causing a notable increase
in generation re-dispatch. The power output of solar PV is decided by PV panels’
inter-nal parameters, such as photovoltaic cells’ materials, numbers of cells; the installation
condition, such as the longitude and latitude of the panels and tilt angle; but most
importantly, the environmental factors, such as irradiance and ambient temperature.
The output of solar PV is necessarily variable simply because the sun changes position
throughout the day and throughout the seasons. Clouds are largely responsible for
rapid changes in the output of solar PV system. Changes in solar insolation at a point
due to a passing cloud can exceed 60% of the peak insolation in a matter of seconds.
Unlike changes in the position of the sun which affects the output of all PV plants
in a nearly unifrom, highly correlated way, changes in PV output due to clouds are
not driven by a similar uniform process. Clouds move across plants affecting one
part of a PV system before another or leaving some parts of the system unobstructed
as the clouds pass. The diversity of the passing clouds add the complexity and
dif-ficulty to accurately forecast the power generation from the PV system. The similar
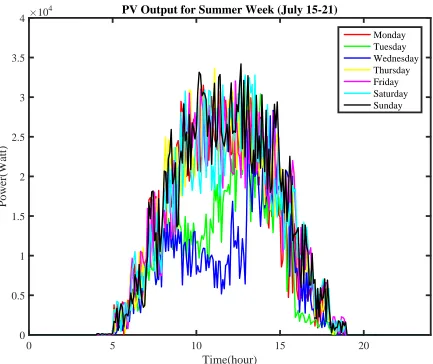
PV power fluctuation also occurs in different weather and terrain conditions. Fig. 1.4
and Fig. 1.5 show the real 1-minute average PV output power 7 days×24 hours data
measured from the 40kW rooftop PV panels for a typical summer week (July 15- 21)
and a winter week (January 15-21), respectively, at the Future Renewable Electric
Energy Delivery and Management Systems Center (FREEDM), North Carolina State
total PV system energy output across the year.
0 5 10 15 20
Time(hour) 0
0.5 1 1.5 2 2.5 3 3.5 4
Power(Watt)
×104 PV Output for Summer Week (July 15-21)
Monday Tuesday Wednesday Thursday Friday Saturday Sunday
Figure 1.4PV System Output for Summer Week
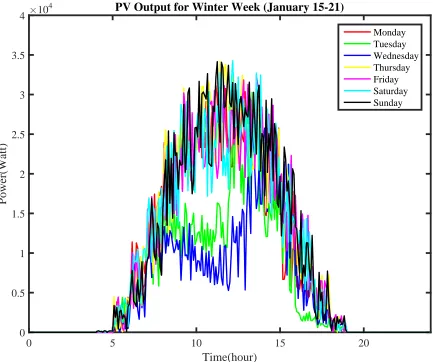
Similarly, Fig. 1.7 shows the wind speed plot with 1-minute average output power
from the SW Minnesota wind power plant, with rated total installed capacity 103.5
0 5 10 15 20 Time(hour) 0 0.5 1 1.5 2 2.5 3 3.5 4 Power(Watt)
×104 PV Output for Winter Week (January 15-21)
Monday Tuesday Wednesday Thursday Friday Saturday Sunday
Figure 1.5PV System Output for Winter Week
2. Local over-voltage or loading issues on distribution feeders may frequently occur due
to unbalance between power supply and demand. Overvoltage is one of the main
reasons for limiting the amount of active power that can be exported by a microgrid
and injected in a low voltage (LV) distribution system. The well-known tradeoffs used
in medium voltage (MV) feeders need to be revisited considering the fact that the
1 2 3 4 5 6 7 8 9 10 11 12
Month
0 1000 2000 3000 4000 5000 6000
Energy(kWh)
Monthly PV Energy Output
Figure 1.6Monthly Total PV System Energy Output
can be regulated with lower variation of active power than reactive power. The voltage
rise therefore occurs due to excess generated rated active power flowing back to the
distribution transformer, most serious at noon for PV generation and at midnight for
wind turbine when the unbalance between the power supply and demand is at peak.
The penetration of DRERs would primarily be limited by customer voltage rising
Figure 1.71-minute average power and wind speed plot
1.2. Literature reviews have been taken for voltage regulation practice and voltage
stability, which will be detailed described in Section 1.3.
Table 1.2ANSI C84.1 Voltage Range for 120V voltage level
Service Utilization Min Max Min Max Range A (Normal) -5% +5% -8.3% +4.2% Range B (Emergency) -8.3% +5.8% -11.7% +5.8%
for maintaining the regulated frequency. Generator inertia is the energy stored in
rotating masses (rotor, turbine(s) and the shaft). When an imbalance between real
power supply and demand exists on the grid, the frequency will deviate from the
nominal value and part of the stored energy is released to the system and assists
resisting changes of machine speed or system frequency. State of the art wind turbines
and solar generators are both asynchronous. The power generated is independent of
the system frequency (i.e. the frequency droop characteristic is zero). The generated
power is not dispatchable so that variations in power production can have an impact
on system frequency by creating a mismatch between system generation and load.
When decentralized non-synchronous generation units replace a significant part
of the synchronous generation capacity, which is equivalent to a high penetration
of renewable sources integrated, the total inertia of the synchronous generators
is decreased significantly. As a result, the variation in the rotaional speed of the
synchronous generators due to changes in their net load will become much higher
than that at present, which causes large electrical frequency variations that end up in
an unstable grid. The insufficient operation reserve urges the necessity of frequency
stability analysis. Literature reviews have been taken for frequency regulation in
power system, which will be detailed described in Section 1.4.
4. Risk of mass disconnection of DERs generation in the event of frequency or voltage
variation and meshed bidirectional network topology result in system instability, load
shedding and other protection events, threatening both physical or cyber security.
In conventional distribution network, protection systems are designed for radial
discrimi-nation. Distribution networks can then simply be protected with overcurrent-based
protective equipments with appropriate time delay, which incorporate circuit
break-ers with overcurrent relays, reclosbreak-ers, and fuses. The presence of DRER, however,
complicates the power system network with bidirectional power flow and meshed
system structure. The basis for the protection scheme design of conventional
net-works is no longer valid and the protection coordination may not be held. DRER may
cause: mis-coordination between recloser fast operation and fuse downstream of the
recloser when DRER is located between the recloser and fuse; the difficulty in the
grading of overcurrent relay with the decreasing or increasing fault current sensed by
the relay, which causes either the relay does not operate as it should or it operates
when it should not; In common practice, DRER is disconnected before the first
reclos-ing of the feeder to prevent reclosreclos-ing problems, however, when DRER penetration
increases, especially when DRER is needed to meet an increase of load, shutting down
all DRERs every time a fault occurs should not be acceptable. Moverover, more than
80% of the faults in overhead distribution system are temporary. Disconnecting all
DGs every time a temporary fault occurs would make the system very unreliable.
Accordingly, new protection scheme has been proposed with renewed fault current
settings and coordination of overcurrent relays for high penetration DRER integration.
For sympathetic tripping problem, which means the undesirable disconnection of
DRERs when a network fault occurs in the vicinity of DRERs and is not cleared quickly
by the network protection (i.e. before the DRER’s under voltage protection operates.),
low voltage ride through (LVRT) capability has been equipped to DRER controllers.
and reduce the negative impact on frequency stablity, the transient stability may
negatively be affected since the fault clearing action cannot be enlarged due to the
active power from DRERs with LVRT capability.
5. Despite DRER potential environmental and economic benefits, many challenges
re-main in the marketplace for greater adoption of DRERs. The average costs of installed
DRER have fallen quite a bit during the recent years beneficial from the
manufactur-ing, material and efficiency improvement. Wind and solar power plants have already
been an effective cost-competitive source of energy for utilities, and thanks to the
rel-atively fast construction process, could be an essential component of quickly adding
grid capacity. However, for distributed generation, the renewable energy still needs
government subsidies for its higher cost than conventional electricity generation. The
intermittence nature of DRER requires high ramp rate source such as gas turbines
and fuel cells for sufficient operating reserve. High capacity energy storage device
would be required for residential house and business buildings for backup which
greatly increases the equipment costs. Smart meter, protection devices and power
system operation support services would be further required for system stability,
economic and environment optimization. Besides, the manufacturing process for
solar cells and batteries uses toxic chemicals, while the wind power development
has its downside mostly involving land use. The challenges above all limit the greater
adoption of DRERs from economic, environmental and social aspects.
The SSSM, as a power electronics interface, could effectively solve the technical issues
of power intermittence, voltage and frequency stability issues and therefore a significant
1.3
Voltage Quality Issues
Voltage quality issues significantly limit the DRER penetration level in three typical forms,
i.e. voltage rise, voltage sag and voltage flicker.
1.3.1
Voltage Rise
Voltage rise at the point of common coupling (PCC) is a well-known issue associated with
active power feed-in by DRER units. To emphasize, consider the thevenin equivalent of a
typical DRER system connected to power grid as shown in Fig. 1.8.
The value of net injected power is
S = (PD R E R+jQD R E R)−(Pl o a d +jQl o a d) (1.1)
= P +Q
UGis regulated grid voltage voltage.UP C C is the voltage at point of PCC.S, P, Q are the net apparent, active and reactive power injected into the network.PD R E R,QD R E R are
the active and reactive power generated by the DRER unit.Pl o a d,Ql o a d are the active and
reactive power consumed by the load.RL,XL are the resistance and reactance of the line.
IP C C is the current injected to the grid.
IP C C = (S/UP C C)∗=S∗/UP C C∗ = (P−jQ)/UP C C∗ (1.2)
UP C C = UG+IP C C(RL+j XL)
= UG+ (P −jQ)(RL+j XL)/UP C C∗
= UG+ (P RL+Q XL)/UP C C∗ +j(P XL−Q RL)/UP C C∗ (1.3)
∆U =UP C C −UG= (P RL+Q XL)/UP C C∗ +j(P XL−Q RL)/UP C C∗ (1.4)
As shown in Eq. 1.4, the voltage rise problem occurs at some level of active power
injection from DRER to the power grid. The traditional radial configuration of power grid
has not been designed to have injected power from the end users. While in high DRER
energy flows into the grid. The reverse power flow brings up the voltage rise problem at PCC,
especially severe in low voltage (LV) distribution system with high R/X ratio. It depends
on the DRER unit’s power factor, location and distribution network characteristic. Fig. 1.9
shows the phasor diagram of the grid and PCC voltage, which could demonstrate the PCC
voltage in different power factor (PF) cases.
Positive PF indicates that reactive power is generated by DRER and flows back to the
grid, while negative PF indicates the reactive power is consumed by DRER and load at PCC.
Fig. 1.9 demonstrates the contribution of reactive power injection and consumption on the
voltage rise issue. Combining Eq. 1.4, to summarize, the positive PF may deteriorate the
votlage rise while negative PF may be an option to mitigate the issue.
The practical voltage profile with high penetration DRER integration has been
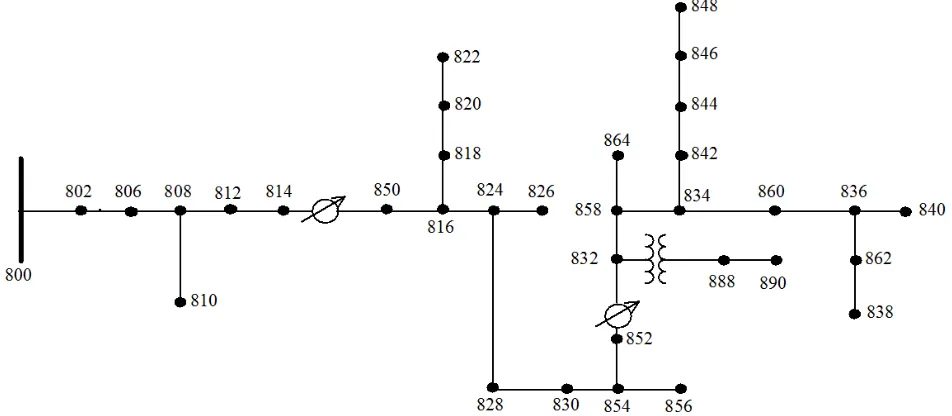
moni-tored in reference papers. Fig. 1.11 shows the IEEE 34 node test feeder (Fig. 1.10) results
from National Renewable Energy Laboratory (NREL) to compare the voltage profile with/
without PV integration at node 840. Note: per unit voltages are referred to the primary, so
all the voltages shown are above 1 p.u. to compensate for voltage drop in the secondary
circuit. The per-unit voltage magnitude is plotted by color (blue denoting lower voltage, red
denoting higher voltage). Fig. 1.11 (a) shows the voltage at node 840 normally stays within a
relatively tight range. The voltage regulators are actively operating due to the load changes
during the day. However in Fig. 1.11 (b), the expected voltage rise at PCC is clearly shown as
a football-shaped region centered on the middle of the day and widest during the summer
when sun angles result in the most PV power production. The added voltage fluctuations
can also be seen as the color changes during a day (on a vertical line trajectory), sometimes
showing dark red colors denoting high voltage and lighter yellow or blue voltages during
the next instance, which would be introduced in section 1.3.3.
In ref[GECJBSt], voltage profiles are described for scenarios with different PV
penetra-tion levels, different power factors and load cases, as shown in Fig. 1.12, Fig. 1.13 and Fig.
1.14. ’BB’ in the figure indicates the busbar at the secondary side of the transformer. T1
Figure 1.10One-line diagram of the IEEE 34 node test feeder
(a) (b)
distance from the distribution transformer. The effect of increasing PV penetration level
can clearly be seen in Fig. 1.12. While it shows slightly low voltage levels in the morning, it
increases with the PV generation and decreases again in the evening as the sun sets. The
voltage profile under 50% PV penetration clearly shows elevated voltage levels compared
to the voltage drops along the feeder with 10% PV penetration level.
(a) (b)
Figure 1.12Voltage profile at peak load with a PV penetration of 10% and 50%
The voltage profiles for reverse power flow are shown in Fig. 1.13. As demonstrated, the
power flow is reversed now and consequently reverses the voltage slope. The voltage along
the feeder increases as the distance from the substation increases. In this case there are
no on-load tap changers installed at the transformer to adjust its tap settings to lower the
voltage at the transformer to permit the reverse power flow. Hence the voltage at the busbar
will not change significantly.
Figure 1.13Voltage profile at zero load with a PV penetration of 50%
converters have the capability of output PF regulation, which might contribute towards
improving the voltage regulation along the feeders. The voltage profiles with different PF
are shown in Fig. 1.14. Terminal voltage at T6 with 0.85 PF may violate the ANSI C84.1
voltage standard in 1.2. Measures should be taken to mitigate the voltage rise issue with
high DRER penetration.
Different methods have been studied and applied so far which can be categorized
into DRER side and Network side approaches. Each main approach had been pursued in
different ways:
•DRER side management
A. Active power control (APC)
For grid connected DRER system, voltage rise can be avoided by controlling the injected
power at high reverse power flow case, such as the high radiation hours for PV at noon
(a) (b)
Figure 1.14Voltage profile at zero load with a PV penetration of 50% at (a) 0.95 PF and (b) 0.85 PF
will affect the Maximum Power Point Tracking (MPPT) thus may not be an attractive
solution from economic point of view. When the voltage rises to a certain level, power
will be reduced in order to avoid inverter switching. Fixed and adapted droop controls
are commonly applied for autonomous voltage regulated power control with no
com-munication needed. To minimize the amount of lost active power, active power control
could be optimized by estimating maximum DRER power available under any weather
conditions, which is hard to acquire when sun radiation changes quickly. Conclusively
the sole idea of active power curtailment is not quite recommended due to the loss
of DRER power which is already pushed to be optimized by MPPT. But as long as it
prevents inverter from switching off, would be worthy to increase the efficiency and
optimize the system, respectively and is recommended to be utilized along with other
techniques in order to mitigate the voltage rise.
For a low DRER penetration level, power grid acts as the energy reservoir for excess or
shortage of DRER generation. As the level of DRER penetration increases substantially
in recent years, energy storage system (ESS) are equipped as the energy buffer, so that
the generated DRER power will not be lost and can be delivered to the grid at peak
load. It allows the DRER system to inject as much active power as possible into the grid
and store excess energy locally during periods of high risk of voltage rise. In Ref[KKp],
the author compared the percentages of battery capacity to the whole installed DRER
system. The comparison represents that for voltage rise mitigation of 30% to 100%, 18%
to 34% of battery capacity is required respectively. Voltage droop based battery charge
and discharge controller is proposed as a simple yet effective way to optimize the system
efficiency. In Ref[GMGJCVJMCn], the hierarchical droop control is helpful for battery
management with multi-layer configuration, however, the communication system is
required for it, which will complicate the system especially when battery cells disperse
at different locations.
C. Reactive power control (RPC)
Importing reactive power may stipulate DRER generation system to operate at leading,
lagging or unity power factor, depending on the X/R ratio of the grid, voltage
regula-tion and local load condiregula-tion. There had been different approaches for reactive power
compensation such as (a) Fixed reactive power (Fixed Q), (b) Fix PF (c) PF in terms of
injected active power or local grid voltage-dependent reactive power. As shown in Eq.
1.4, more reactive power may have to be aborbed in case of high level real power
injec-tion (voltage rise). However, to support accurate and significant levels of reactive power,
be required. Besides of the limit by IEEE 1547 and UL 1741 that only allows DRER system
to operate at a unity power, reactive power control may result in higher current and
losses in the feeder. Especially in LV system where voltage is less sensitive to reactive
power due to a more resistive feeder characteristic. In addition, the apparent power of
DRER inverter might be increased and over-sized inverter is required to absorb reactive
power, which increases the costs of equipments accordingly.
D. Using DRER as STATCOM
DRER inverter could be utilized as STATCOM when inactive at low or zero active power
output, in which case, full rating of apparent power could be used for reactive power
export or import during bus voltage drop and rise. This may be a cheaper choice
com-pared to storage devices and typical STATCOM device, however, utility supervisory is
responsible for its control and data acquisition, which is difficult for dispersed DRER
devices.
E. Inserting a series reactor in service line (ISR)
Considering the resistive nature of LV residential networks having typically high R/X
ratio, specific reactor value can be inserted in series in service line so that the equivalent
amount of reactance would be higher with low admittance, so the R/X will decrease and
this can increase the capability of efficient reactive power control. This method can be
combined with other theories to mitigate the voltage rise.
F. Appliances power control
Load Management can be applied to do load shedding during peak loads and allow some
dryer and washing machine are typical used without significant negative impacts on
customer experience. The load management can prevent injection of current in the low
load duration and respectively reduces the needed storage at peak hours. In this way, the
necessary buffer or injection to create a self-sufficient grid can be reduced significantly.
Also distribution operators can add more DRER clients to the grid. Of course, economic
evaluation must be considered to compensate the participating customers or loads,
which is a drawback for this method.
•Network side management
G. On load tap changer (OLTC)
To prevent voltage rise, on load tap changer and auto-transformers could be inserted to
reduce the secondary voltage of the upstream LV transformer by adjusting the tap. The
main drawback of the method, considering that the tap cannot be changed frequently,
is the possibility of finding an appropriate setting which can be used for rated and no
DRER generation without violating the voltage limits. Communication is required to
send the real-time load current information or end node data back to the controller
center for maintaining voltage profile along the LV feeder within the limits. Economic
analysis and lifetime optimization should also be taken for the tap changer.
H. Active grid voltage control
The grid overvoltage could also be protected by reactive power and active power control
at grid side. Fixed or switched capacitors could be applied for reactive power control,
while the energy storage and fast response generators could be commited for active
with variable load and DRER cases. Addtionally, the costs of supportive devices may
lead to the negative economic impacts on the DRER systems.
I. Re-conductoring the network
In LV power grid, small overhead line conductors have higher impedance than large
conductors. A 70mm2copper conductor has approximately one-third of the resistance and 90% of the reactance of a 16mm2conductor. Thus, upgrading the conductor on an LV overhead line will significantly reduce its resistance and will smooth the voltage
profile along the line, which can be a very effective method of counteracting voltage
rise problem. However, considering the large numbers of feeders to be upgraded in
distribution networks, it will be expensive and would not be reasonable economical,
even worse for underground feeders.
In summary, network side management for voltage rise mitigation is not reasonable
from both economic and control aspects. DRER side management, however, is a more
practical, convenient and cheap option, which is the focus in this report as well.
1.3.2
Voltage Sag
The voltage sag may come with a sudden loss of generation or short circuit fault, the
under-voltage protection embedded in DRER converter may be false triggered, DRER power would
further reduce and worsen the voltage sag in return.
The voltage sag problem could be mitigated by low voltage ride through (LVRT) or
inserting a serial capacitor (SC). However, the former may have negative impact on transient
voltage rise mitigation, voltage sag problem could be regulated by load tap changer (LTC)
transformer, reactive power injection, fixed or switched capacitors and short-term energy
storage.
1.3.3
Voltage Flicker
The intermittence nature of DRER power output, loss of DRER generation due to an
equip-ment trip, starting rush of a machine, arc furnaces or a step change of DRER output may
lead to the voltage flicker problem and transient instability.
Generally, voltage flicker problem could be improved by smoothing the intermittent
DRER output by active power filtering, spatially distributed DRER and short-term storage,
inverter based VAR generators for arc furnace flicker compensation, and reducing the
frequency of equipment actions such as switched capacitors and load tap transformers.
The proposed SSSM, could improve all three mentioned typical voltage quality issues,
with Volt/Var control capability, active power control and energy storage system
1.4
Frequency Stability
DRER’s displacement of conventional synchronous generators worsens the system
fre-quency stability due to its nature of high intermittence, decoupling from system frefre-quency,
less or no inertia response, and no power reserve margin. There is little impact on frequency
stability for small DRER penetration, however, once DRER reaches critical mass, the
cur-rent methodology for generation-based frequency compensation, Automated Generation
Control (AGC), may be insufficient to maintain frequency within the bounds for service
quality.
1.4.1
Frequency Response
Frequency stability is defined as the ability of a power system to maintain the steady-state
frequency following a generation - demand imbalance. Frequency response reflects the
generation (and responsive load) ability to increase output (or reduce consumption) in
response to a decline in system frequency and decrease output (or increase consumption)
in response to an increase in system frequency. It could be examined by the changing trends
in system frequency behavior of a power system following the loss of the largest generator.
Three important security indices of dynamic system frequency performance, namely the
maximum rate of change of frequency (ROCOF), minimum value of frequency recorded,
the nadir and steady state frequency deviation are used to quantify the frequency stability.
Frequency stability has been significantly affected by high DRER penetration mainly
for the following reasons.
and demand imbalance. Improvements in DRER technology and forcasting tools
make it possible to estimate DRER generation to within 10-15%. While a vast
im-provement over prior levels of uncertainty, this is still much larger than the 1-2%
uncertainty expected from demand.
2. DRER generation, whether wind or solar energy, is decoupling from grid frequency by
the converters. Phase locked loop (PLL) synchronizes DRER output frequency with
grid frequency.
3. Generator inertia is the energy stored in rotating masses (rotor, turbine(s) and the
shaft). During the frequency disturbance caused by a loss of the generator, a part of
the stored energy is released to the system and it assists resisting changes of machine
speed or system frequency. This relationship can be expressed mathematically as
follows:
Es t o r e d =1
2Jω 2
n (1.5)
whereEs t o r e dis the energy stored in rotating mass,[Ws]; J is the inertia of the machine,
[kg•m2]; andω
n is the rotational velocity of the machine[rad/s].
The inertia constant H can then be defined as the stored energy at synchronous speed
per volt-ampere of the rating of the machine:
H=Es t o r e d
S =
Jω2 n
2S (1.6)
an indication of the duration a generating unit is able to supply nominal power by
using the energy stored in its rotating mass only. For system inertia of a power network,
it influences the available inertial response following a generator outage. The average
inertial constant for a system is calculated as follows:
Hs y s= n
P
i=1
HiSi
n
P
i=1
Si
(1.7)
H, S and n denotes the inertial constant of each generator, the generator MVA rating
and the number of generators in the system respectively. In power system analysis, the
frequency stability is mainly based on the synchronous machine rotor’s mechanical
characteristic, which is called swing equation, expressed as Eq. 1.8:
Jdωr
d t +D(ωr−ωg) =Tm−Te (1.8)
The rate of change of frequency (ROCOF) is defined as Eq. 1.9.
d f d t =
∆P f
2H •M V A (1.9)
where d fd t is the rate of change of frequency in Hz/s,∆P is the load or generation lost
in MW and H is the total system inertia in MWs/MVA.
Different from the large mass of flywheels that stores the kinetic energy for inertia
response, low or zero inertia constant could be supported by DRER converter with
significant part of the synchronous generation capacity, the total rotational inertia of
the synchronous generators is decreased significantly. As a result, the variation in the
rotational speed of the synchronous generators due to changes in their net load will
become much higher than at present.
4. For best economic benefits, in conventioanl DRER converter control, MPPT is
al-ways implemented for DRER generation thus having no up and down power reserve
support.
The frequency response with high DRER penetration has been reported in ref papers
[GECJBSt]. Table 1.3 presents the main characteristics of 4 different PV penetration
scenar-ios in a small isolated 60 Hz system with a current peak load of 2200 MW. The system is
characterized by a pure thermal generation mix with a total installed capacity of 4500 MW
based on coal, oil and natural gas. The system load is characterized by 90% industrial load,
and the remaining 10% corresponds to residential customers.
Table 1.3Characteristics of the Scenarios
Scenario Power Injections of Conventional Generators (MW)
Power Injections of PV (MW)
PV Penetra-tion Level: PV/Demand %
Average Inertia Constant (s)
S0 2219 0 0 4.50
S1 1811 401 19 3.96
S2 1377 839 39 3.41
Fig. 1.15 shows the frequency response for different PV penetration scenarios by the loss
of the largest generator (180 MW at t=0.5s) and Table 1.4 summaries the security indices in
all cases.
Table 1.4Frequency Security Indices for different PV penetration scenarios
Scenario Initial rate of change of fre-quency (ROCOF) Hz/s
Frequecy Nadir Hz
Steady State Frequency Deviation Hz
S0 -0.29 59.21 59.55
S1 -0.34 59.17 59.56
S2 -0.39 59.04 59.42
S3 -0.53 58.86 59.23
As expected, the system performance decreases as the PV penetration level increases,
confirming the detrimental effect of PV generation without frequency regulation. It can be
observed that for low PV penetration levels (scenario S1, PV/Demand=19%), no significant
effects arise on the system frequency response when compared with the base scenario S0.
In contrast, when PV penetration level is approximately 50% (scenario S3), the obtained
frequency nadir may lead to the activation of load shedding or generator trips that further
worsens the system operation. The reduction of system inertia due the replacement of
conventional synchronous generators by PV units is confirmed by inspection of the initial
rate at which the frequency falls (ROCOF) and the initial frequency nadir. The steady state
frequency deviation is also deteriorated as the PV penetration increases, reaching a lowest
steady state value of 59.23 Hz in scenario S3.
1.4.2
Frequency Regulation
Various measures have been taken to mitigate the frequency response issues caused by
high DRER penetration integration, summaried in Table 1.5 from utility, DRER and demand
side management. The third column shows the advantages (in blue) and disadvantages (in
red) of each method.
The utility currently claims the major contribution for frequency regulation with its
capability to dispatch all conventional units in power system including spinning and
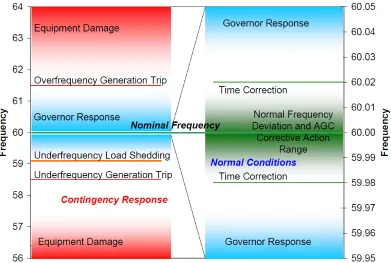
non-spinning reserve, load, and protection equipments. Fig. 1.16 shows the current three-stage
conventional frequency control from utility side management under normal conditions
and coordinated under all conditions, i.e. Primary control, Secondary Control and Tertiary
the control sequence and coordination of the three stages. Primary control is provided
by governor action that senses the change in speed and adjusts the energy input into the
generators’ prime mover, and load shedding action at under-frequency case. The secondary
control includes the balancing services deployed in the ’minutes’ time frame and is used to
restore frequency to its scheduled value, i.e. 60Hz, following a disturbance. It is provided by
both spinning and non-spinning reserves through Automatic Generation Control (AGC).
AGC observes the frequency data, then computes and automatically determines the most
economical output for generating resources. The tertiary control encompasses actions
taken to get resources in place to handle current and future contingencies with reserve
deployment and restoration.
Figure 1.17Sequence and Coordination of Utility Frequency Control Stages
DRER side management, is an effective source for frequency regulation since it could
di-rectly improve the inertia response or DRER variation issues that lead to frequency instablity
for high DRER penetration.
Virtual synchronous generator (VSG), in Ref[ZWr]and[AMr b], is a novel concept and it
has been proposed as a control strategy to tackle stability issues in power systems with high
DRER penetration. The VSG control algorithm emulates a virtual inertia via power injection
from/to the energy storage system (ESS) to support the inertial response for high DRER
penetration system. With virtual inertia control contribution to increase the natural inertial
response of the system, the ROCOF and frequency nadir have been improved. However, in
time and more oscillartory, which asks for more damping effects for system stability. More
work should point to obtain some guidelines in order to specify the ESS ratings according
to the requirements of the virtual inertia algorithm.
GE Energy is the only manufacturer supplying variable speed wind turbines with the
inertia control loop. While the GE 1.5 MW series wind turbine is the most commonly used
wind turbine in the world, GE’s market share only accounts for 18% of the overall market,
majority of wind turbines that are currently in use in the U.S., Europe and Australia do
not have an inertia response capabilities. For large under-frequency events, the inertial
control feature temporarily increases the power output of the wind turbine by about 5% to
10% of rated power, for several seconds.The inertial response is essentially energy neutral,
meaning that the period of increased power is followed by a period of decreased power.
Below rated wind, stored kinetic energy from the turbine-generator rotor is temporarily
donated to the grid, but is recovered later. At higher wind speeds, pitch control is used to
increase the captured wind power, and to temporarily exceed the steady state rating. Under
these conditions, the decline in rotor speed is less and the energy recovery is minimal.
The inertia response could improve the ROCOF and frequency nadir during first several
seconds after a system contingency. However, it is not a substitute for primary control.
Governor-like control is possible to implement for DRER generation that provides active
power control similar to governor response in conventional synchronous generators. It
responds to significant deviations in grid frequency, increasing or decreasing power output
in response to low or high frequency events, respectively. The control alters the active power
control reference rather than MPPT control normally adopted by DRER units implemented
active power control effectively improves the frequency response, it is not economic friendly
due to the loss of maximum power harvest. For up-reserve, ESS may be utilized, which
increases the cost of the whole DRER system.
Some measures could be taken from the protection side, such as setting a large window
and long tripping delay, or low frequency ride through capability. The DRER generator
will delay to trip at frequency contingency, however, this mechanism may lead to negative
transient stability issues, especially when the fault occurs near the high DRER penetration
area, which should be paid more attention.
ESS, including pumped hydro, flywheels, batteries and ultra-capacitor helps to smooth
DRER intermittence and offer fast operation reserve to mitigate the imbalance of demand
and supply. However, the improved performance increases the system cost and volumn.
ESS may also require controller to implement optimum for both economic and technical
benefits.
The imbalance between power supply and demand could also be mitigated by demand
side management. Energy based loads such as heat and cooling appliances could apply for
peak shaving. However, the regulation is discrete and the participating loads are required to
compensate. Load terminal voltage could be regulated only if it is within the secure range
to vary the power consumed by the loads. The system voltage limit, however, restricts the
capacity of the reserve support. Load shedding is also a normal practice in under-frequency
case. The demand side management requires the evaluation of economic and impact factor
of the load change to guarantee the QOS. The communication delay should not be ignored
for its accuracy and stability.
the autonomous control of ESS system. It mimics the behavior of a synchronous machine,
with a virtual inertia constant. Besides, the ESS could implement the up-reserve and
down-reserve for DRER system without the loss of MPPT. The frequency stability could be greatly
improved by SSSM, with lower ROCOF, higher frequency nadir and steady state frequency
following the trip of generators. The benefits provided effectively mitigate the frequency
instability issues under high DRER penetration.
1.5
Outline
In Chapter 2, the overall architecture of the SSSM based DRER system will first be described.
The detailed hardware system including SSSM, DESD and DRER will be presented. The
control and operation of the system will be introduced from frequency regulation,
Volt-Var regulation and dual droop control perspectives supporting the features SSSM could
provide.
In Chapter 3, the small signal model of SSSM based DRER system will be built first. The
stability analysis will be presented focusing on the impact of virtual inertia, DESD and
DRER. A controller that emulates the power system stabilizer (PSS) will be discussed to
enhance the SSSM’s stability that adds the system damping and decreases the low frequency
oscillations.
In Chapter 4, design of SSSM based DRER system will be introduced by a flowchart, that
includes all hardware and controller parameters. The virtual impedance will be introduced
to decrease the requirement of the line impedance due to the inherence of the voltage
source inverter of SSSM. The capacity requirement for DESD system will be designed for