ABSTRACT
BUCKELEW, JULIANA KIRSTEN. Orchard Floor Management in Young Peach [Prunus persica (L.) Batsch.]: Effects of Irrigation, Vegetation-free Width, and Certain PRE
Herbicides. (Under the direction of David W. Monks).
A hindrance to peach culture in the southeastern U.S. is orchard floor vegetation in which weeds can compete for water and nutrients. Young orchards may take longer to come into production if infested with weeds. The common orchard floor management system in the southeastern U.S. is a 3.0 to 3.6 m wide vegetation-free strip in the tree row with an orchard cover of volunteer weedy vegetation. However, reduction of the strip width may be possible through the use of irrigation which could reduce herbicide use. Thus, the objective of this study was to determine the optimum vegetation-free strip for irrigated peach with a weedy groundcover. Research was conducted in 2006 to 2008 to determine the optimum vegetation-free strip for irrigated peach with a weedy groundcover, and to evaluate PRE-emergence directed control of weeds that infest peach in North Carolina.
the nonirrigated trees, presumably due to leaching of NO3 by irrigation. Foliar N, SPAD
measurements, soil moisture, and growth responses were positively related to VFW at Jackson Springs therefore growth responses there were probably due to water and N
competition with vegetation. In contrast, foliar N concentration was not different by VFW at Clayton. However, growth responses were positively related to VFW. SPAD measurements increased with VFW so vegetation had some effect on nitrogen. For the first two years of the study, VFW did have an effect on soil moisture at 30 cm depth. Data suggest that a 1.5 m VFW combined with proper irrigation and fertilization will produce tree growth and yield in volunteer weedy vegetation similar to the current grower standard.
The second set of experiments was conducted to determine newly planted peach tolerance to sulfentrazone herbicide applied PRE at various rates and to determine the effect of
sequential sulfentrazone when tank mixed with other PRE herbicides (norflurazon, oryzalin, terbacil, rimsulfuron, or flumioxazin). Sulfentrazone PRE did not injure newly planted peach trees. Sulfentrazone alone controlled several broadleaf weeds however it did not adequately control large crabgrass and yellow foxtail. Control of these grasses increased with the addition of norflurazon or oryzalin.
The third set of experiments was conducted to determine tolerance to halosulfuron, mesotrione, and rimsulfuron applied at various rates on newly planted peach. No herbicide reduced TCSA or winter pruning weight relative to the nontreated check. In 2006, some foliar injury from halosulfuron occurred at the higher rates. No visual injury symptoms occurred in 2007 for any study.
Orchard Floor Management in Young Peach [Prunus persica (L.) Batsch.]: Effects of Irrigation, Vegetation-free Width, and Certain PRE Herbicides
by
Juliana Kirsten Buckelew
A dissertation submitted to the Graduate Faculty of North Carolina State University
in partial fulfillment of the requirements for the Degree of
Doctor of Philosophy
Horticultural Science
Raleigh, North Carolina 2009
APPROVED BY:
Dr. Michael Parker Dr. Randy Wells
Dr. David Monks Dr. Michael Burton
Chair of Advisory Committee
ii
DEDICATION
iii BIOGRAPHY
Juliana Beiwel Buckelew is the third child of Ferenc and Marian Beiwel. She grew up in Davenport, Iowa and graduated from Davenport West High School in 1991. She graduated from Iowa State University in 1997 with a Bachelor of Science Degree in Horticultural Science. After graduation she was employed by Seed Savers Exchange in Decorah, Iowa. After marrying Lamar Buckelew in 1998, they moved to Milwaukie, Oregon. There she worked for Oregon State University as an ornamental nursery production research technician at North Willamette Research and Extension Center. In spring of 2002, she began her
iv
ACKNOWLEDGMENTS
I would like to thank Dr. David Monks for his advice and patience. I also thank Drs. Mike Burton, Michael Parker, and Randy Wells for serving on my graduate committee. I would like to thank Dr. Katie Jennings for her encouragement.
v
TABLE OF CONTENTS
Page
LIST OF TABLES………. vii
LIST OF FIGURES………... ix
EFFECTS OF VEGETATION-FREE WIDTH AND IRRIGATION ON NEWLY PLANTED PEACH [Prunus persica (L.) Batsch.] Abstract………. 1
Introduction………... 2
Materials and Methods……….. 5
Results and Discussion……….. 11
Literature Cited……….. 42
WEED CONTROL AND PEACH [Prunus persica (L.) Batsch.] RESPONSE TO SULFENTRAZONE HERBICIDE SYSTEMS Abstract………. 78
Introduction………... 79
Materials and Methods……….. 80
Results and Discussion……….. 82
Literature Cited……….. 85
RESPONSE OF NEWLY PLANTED PEACH [Prunus persica (L.) Batsch.] TO CERTAIN PRE HERBICIDES Abstract……….. 89
Introduction……….... 90
Materials and Methods……….. 91
Results and Discussion……….. 92
Literature Cited……….. 94
APPENDICES………... 96
Appendix Table 1. Precipitation and irrigation data, Clayton, NC, 2006 - 2008 ……… 97
Appendix Table 2. Precipitation and irrigation data, Jackson Springs, NC, 2006 - 2008……… 98
vi Table of Contents (Continued)
vii
LIST OF TABLES
Page EFFECTS OF VEGETATION-FREE WIDTH AND IRRIGATION ON NEWLY
PLANTED PEACH [Prunus persica (L.) Batsch.]
Table 1 Parameter estimates and equivalent irrigated VFW to 3.0 m nonirrigated for peach trunk cross sectional area as affected by vegetation - free area (VFW) and irrigation, Clayton and Jackson Springs, NC, 2006 to 2008.…………... 48 Table 2 Comparisons of mean peach trunk cross-sectional area of various combinations of
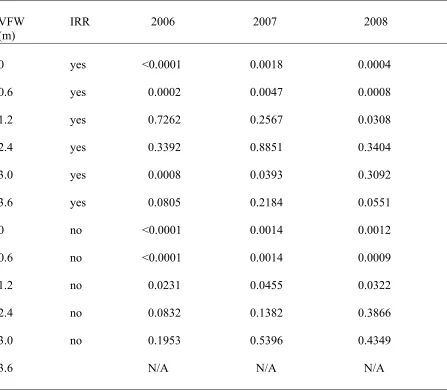
vegetation free widths (VFW) and irrigation levels (IRR) with the 3.6 m VFW, nonirrigated treatment, Clayton, NC……….………... 55 Table 3 Comparisons of mean peach trunk cross-sectional area of various combinations of
vegetation free widths (VFW) and irrigation levels (IRR) with the 3.6 m VFW, nonirrigated treatment, Jackson Springs, NC…….………..………… 56 Table 4 Comparisons of peach trunk cross sectional areas of irrigation levels within
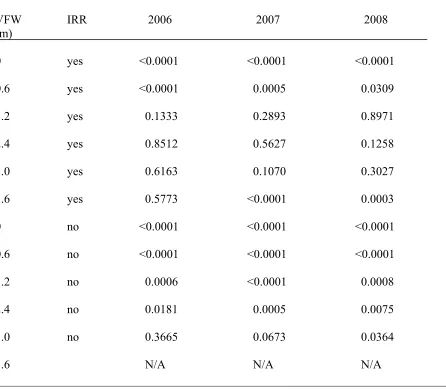
vegetation free widths (VFW), Clayton, NC……… 57 Table 5 Comparisons of peach trunk cross sectional areas of irrigation levels within
vegetation free widths (VFW), Jackson Springs, NC……….. 58 Table 6 Parameter estimates and equivalent irrigated VFW to 3.0 m nonirrigated for peach
tree winter prunings as affected by vegetation - free area (VFW) and irrigation, Clayton and Jackson Springs, NC, 2007 and 2008……..….………... 59 Table 7 Parameter estimates for peach harvest as influenced by vegetation - free width
(VFW) and irrigation, Jackson Springs, NC, 2008……….……... 62 Table 8 Regression analyses for peach harvest as influenced by vegetation - free width
(VFW) and irrigation, Clayton, NC, 2008……….……….…... 63 Table 9 Regression analyses of total dry weight (kg ha-1) of herbaceous vegetation as
influenced by vegetation - free width (VFW) and irrigation for various sampling
dates……….…... 73 Table 10 Percent (averaged over three reps) of total dry weight of total herbaceous
vegetation for winter grasses and forbs by irrigation and VFW, Clayton, NC, 2007
viii
Table 11 Percent (averaged over three reps) of total dry weight of total vegetation for summer grasses and forbs by irrigation and VFW, Clayton, NC, 2007 and 2008
………..….…... 75 Table 12 Percent (averaged over three reps) of total dry weight of total vegetation for
winter grasses and forbs by irrigation and VFW, Jackson Springs, NC, 2007 and
2008.……..……….…... 76 Table 13 Percent (averaged over three reps) of total dry weight of total vegetation for
summer grasses and forbs by irrigation and VFW, Jackson Springs, NC, 2007 and
2008.…………..….…... 77 WEED CONTROL AND PEACH [Prunus persica (L.) Batsch.] RESPONSE TO
SULFENTRAZONE HERBICIDE SYSTEMS
Table 1 Common name, trade name, formulation, and application rates of herbicides used in sulfentrazone systems study ………... 86 Table 2 The effect of various PRE herbicides on peach trees, weeds, and percent
bareground, Vale, NC, 2007… ………... 87 Table 3 Precipitation records (cm) for Clayton and Vale, NC, 2006 and 2007.. 88 RESPONSE OF NEWLY PLANTED PEACH [Prunus persica (L.) Batsch.] TO CERTAIN PRE HERBICIDES
ix
LIST OF FIGURES
Page EFFECTS OF VEGETATION-FREE WIDTH AND IRRIGATION ON NEWLY
PLANTED PEACH [Prunus persica (L.) Batsch.]
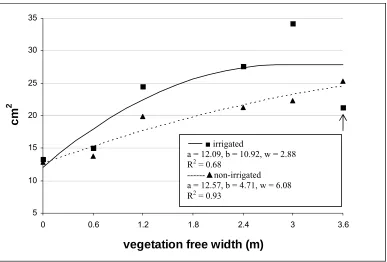
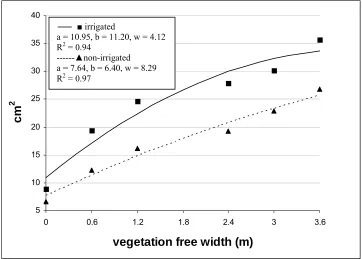
Figure 1 Effect of irrigation and vegetation - free width (VFW) on trunk cross - sectional area (TCSA), Clayton, NC, December 30, 2006……….. 49 Figure 2 Effect of irrigation and vegetation - free width (VFW) on trunk cross - sectional
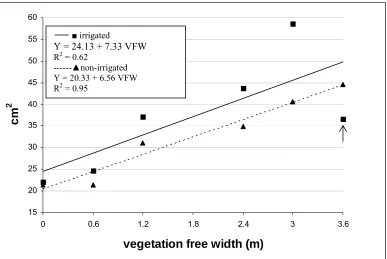
area (TCSA), Clayton, NC, December 13, 2007………... 50 Figure 3 Effect of irrigation and vegetation - free width (VFW) on trunk cross - sectional
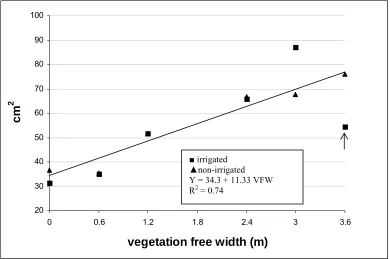
area (TCSA), Clayton, NC, January 3, 2009………. 51 Figure 4 Effect of irrigation and vegetation - free width (VFW) on trunk cross - sectional
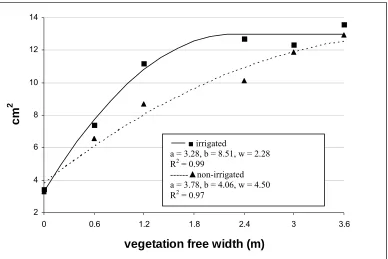
area (TCSA) of newly planted peach, Jackson Springs, NC, February 3, 2007
………..………. 52
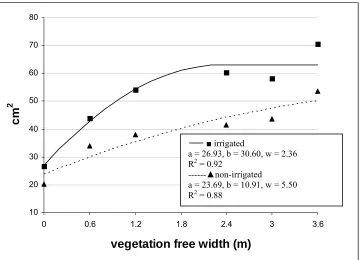
Figure 5 Effect of irrigation and vegetation - free width (VFW) on trunk cross - sectional area (TCSA) of newly planted peach, Jackson Springs, NC, November 20, 2007
………..………. 53
Figure 6 Effect of irrigation and vegetation - free width (VFW) on trunk cross - sectional area (TCSA) of newly planted peach, Jackson Springs, NC, January 3, 2009
……… 54 Figure 7 Effect of irrigation and vegetation - free width (VFW) on SPAD value of newly
planted peach, averaged across four sampling dates, Clayton, NC………… 60 Figure 8. Effect of irrigation on SPAD value by vegetation - free width (VFW) at various
sampling dates, Jackson Springs, NC.………... 61 Figure 9 Effect of irrigation and vegetation - free width on percent first harvest of
season total, Jackson Springs, NC, 2008………... 64 Figure 10 Effect of irrigation and vegetation - free width on yield season total, Jackson
Springs, NC, 2008………... 65 Figure 11 Effect of irrigation and vegetation - free width (VFW) on yield season total
x
Figure 12 Effect of irrigation and vegetation - free width (VFW) on soil water tension at various sampling dates, Jackson Springs, NC, 2006... 67 Figure 13 Effect of irrigation and vegetation - free width (VFW) on soil water tension at
various sampling dates, Jackson Springs, NC, 2007... 68 Figure 14 Effect of irrigation and vegetation - free width (VFW) on soil water tension at
various sampling dates, Jackson Springs, NC, 2008... 69 Figure 15 Effect of irrigation and vegetation - free width (VFW) on soil water tension at
various sampling dates, Clayton, NC, 2006………... 70 Figure 16 Effect of irrigation and vegetation - free width (VFW) on soil water tension at
various sampling dates, Clayton, NC, 2007………... 71 Figure 17 Effect of irrigation and vegetation - free width (VFW) on soil water tension at
1 Received for publication date and in revised form date.
2 Graduate student and professor, Department of Horticultural Science, North Carolina State University, Raleigh, NC 27695.
1
Effects of vegetation - free width and irrigation on newly planted peach1. JULIANA K. BUCKELEW and DAVID W. MONKS2
Abstract: Field experiments were conducted to determine the optimum vegetation-free strip
for irrigated peach with a weedy groundcover. The experiment included two factors,
vegetation-free widths (VFW) of 0, 0.6, 1.2, 2.4, 3, and 3.6 m and irrigation (either irrigated
or nonirrigated). At Jackson Springs, NC, the irrigated vegetation-free width (VFW) which
would produce the same yield season total (kg/ha) as the grower standard (3.6 nonirrigated)
is 1.16 m, based on results from regression. (For maximum season total, the VFW needed to
be 3.6 m.) The irrigated VFWs which would produce the same tree cross-sectional area as
the grower standard was 1.5, 1.3 and 0.8 m for trees aged one, two, and three years old,
respectively. At Clayton, NC, trunk cross-sectional area in 2007 and 2008 and harvest
season totals were not different by irrigation, but did increase linearly with VFW. At both
locations, water and nitrogen were probably the limiting factors. Similar across locations,
leaf nitrogen concentrations were lower but not deficient in the irrigated trees than the
nonirrigated trees, presumably due to leaching of NO3 by irrigation. Foliar N, SPAD
measurements, soil moisture, and growth responses were positively related to VFW at
Jackson Springs therefore growth responses there were probably due to water and N
2
Clayton. However, growth responses were positively related to VFW. SPAD measurements
increased with VFW so vegetation had some effect on nitrogen. For the first two years of the
study, VFW did have an effect on soil moisture at 30 cm depth. Data suggest that a 1.5 m
VFW combined with proper irrigation and fertilization will produce tree growth
and yield in volunteer weedy vegetation similar to the current grower standard.
Nomenclature: paraquat, flumioxazin, Prunus persica (L.) Batsch. ‘Contender’.
Additional index words: orchard floor management, Prunus persica, competition,
vegetation, weed control, nutrition, irrigation.
Introduction
Peach production in North Carolina totaled 5090 metric tons and $5.6 million in crop value
in 2008 on 486 ha (Anonymous 2009). A hindrance to peach culture in the southeastern U.S.
is orchard floor vegetation in which weeds can compete for water and nutrients (Glenn and
Welker 1991). Weeds can have the greatest impact on stone fruit trees during the first 3 to 4
yr after establishment (Anonymous 1999). Young orchards may take longer to come into
production if infested with weeds. Orchards are also more likely to suffer frost damage if
infested with weeds because their presence can reduce soil temperature by a few degrees, as
compared with moist, vegetation-free soil. Weed suppression can increase resistance of bark
and wood tissue on dormant scions to cold injury. Decreased available photosynthate related
to reduced growth may contribute to lowered cold hardiness (Marriage and Quamme 1980).
Removal of all vegetation with herbicides over the total orchard floor or only in tree rows
significantly reduces vole and northern pocket gopher populations and their damage
3
vascular tissues of stems, roots and underground bark. The weeds that make up an orchard
ground cover, if not controlled, can harbor catfacing insects like tarnished plant bug and stink
bugs (Meyer 1984; Killian and Meyer 1984). Likewise, spider mites may become
problematic to the peach in midsummer when they migrate from senescing winter weeds
(Meagher and Meyer 1990) Those trees grown in weedy or sod floor will have fewer total
roots and fewer deep roots, with limited lateral spread as compared to bareground (Parker et.
al 1993, Parker and Meyer 1996). Glen et al. (1996) found that a sod barrier restricted the
growth of peach trees by reducing the size of the root system. Weller et al. (1985) found
fewer fibrous peach tree roots in the top 15 cm of soil and reduced fibrous roots 15 to 30 cm
deep when subjected to bermudagrass competition, compared to weed-free conditions.
To counter these negative effects of weeds, weed management methods target vegetation
around tree trunks (basal weed control), vegetation in tree rows (strip weed control), or all
vegetation on the orchard floor (total orchard floor control). Strip weed control involves
maintaining a weed-free strip and causes minimum soil compaction by equipment used for
cultivation because it eliminates mowing or cultivation between trees. This production
system allows access to the orchard during wet weather and reduces erosion on sloped land,
compared to total orchard floor control. Trees grown in a strip weed control pattern
compared to a basal weed control pattern had greater TCSA (trunk cross sectional area)
starting the third year after planting (Welker and Glenn 1991). The use of herbicides for
vegetation control results in greater tree growth than when vegetation is controlled by
4
Concerning timing of weed control, a critical weed- free period from bloom to 12 wk after
bloom provides the largest fruit size, total yield and fruit number in peach (MacRae et. al
2007). Huffman (2006) found that the critical weed-free period for young fruit trees in
Ontario is May to July to maintain trunk diameter growth, while for bearing fruit trees is
from bud break to 30 d after bloom to maintain greatest yields.
Various studies have measured optimal strip width in peach. In studies with tall fescue as
orchard floor cover in non-irrigated peach, tree growth and fruit yield was proportional to
size of the vegetation free area but plateaued at 9 m2 with soil nitrogen as the limiting factor (Welker and Glenn 1985, 1989).
The preferred orchard floor management system by growers in the southeastern U.S. is a
3.0 to 3.6 m wide vegetation-free strip in the tree row (Mitchem 2005). However, herbicide
volume per acre for strip maintenance may be reduced if strips are narrowed. Reduction of
the strip width may be possible through the use of irrigation. If irrigation can decrease the
effect of peach/weed competition that occurs with narrow vegetation-free strips, herbicide
active ingredient per acre could be reduced which would be cost saving to the grower and
reduce potential impacts to the environment. Trickle irrigation was effective in overcoming
the added competition imposed by permanent creeping red fescue sod strips in row middles
(Layne and Tan 1988). Irrigation of newly planted peach trees maintained in a 3.0 m wide
strip in a cover of crabgrass and brome, had larger TCSA than non-irrigated trees by the
second growing season (Huslig et. al 1993). By reducing the strip width even lower, optimal
5
Competition studies involving vegetation-free area have primarily used fescue sod as an
orchard ground cover (Belding et al. 2004; Welker and Glenn 1989; Welker and Glenn
1985). These studies were located in climates conducive for fescue growth. However, in
South Carolina, Georgia, and central North Carolina, the orchard cover is often volunteer
weedy vegetation as the climate is not conducive for fescue. Thus, the objective of our study
was to determine the optimum vegetation-free strip for irrigated peach with a weedy
groundcover.
Materials and Methods
Field experiments were conducted from 2006 to 2008 at two sites. The first site was
Central Crops Research Station in Clayton, NC (35.65degrees N, 78.46 degrees W). Soil
was Norfolk loamy sand (fine-loamy, Kaolinitic, thermic Typic Kandiudults) with pH 6.1
and humic matter 0.41%. The second site was the Sandhills Research Station in Jackson
Springs, NC (35.21 degrees N, 79.63 degrees W). Soil was Candor Sand (sandy, Kaolinitic,
thermic Grossarenic Kandiudults) with pH 5.8 and humic matter 0.60%. Dolomitic lime was
also applied at both locations pre-plant at 1123 kg ha-1. At Jackson Springs, the field was
fumigated with 331 kg ha-1 of 1,3-dichloropropene. At both sites, the tree row and swathes 90 degrees to the tree row where the trees would be planted were chisel plowed and then
disked. In both studies for 2006 and 2007, fertilization schedules were followed as
recommended by Georgia Cooperative Extension Service for newly planted trees (Lockwood
et al. 2005). In 2008 (bearing year) fertilization was broadcast-applied with 45 kg each of N
6
Peach trees 61 to 76 cm tall were hand planted in April 2005 in Clayton and January 2006
in Jackson Springs. At planting the bottom 30 cm of each tree was painted with white latex
paint for protection from contact herbicide. Plots were four tree plantings of ‘Contender’
(freestone fresh-market type) on ‘Guardian’3 rootstock. Plot size was 21.9 by 3.7 m. Tree spacing was 5.5 m in rows 6.1 m apart (298 trees ha-1). Of the four plants per plot, the middle two were used for data measurements and the outer two on each end were buffer
trees.
The experimental design was a randomized complete block design replicated six times at
Jackson Springs and four times at Clayton. The experiment had two factors, vegetation-free
widths (VFW) of 0, 0.6, 1.2, 2.4, 3, and 3.6 m and irrigation (either irrigated or nonirrigated)
as factors. Strips were chemically maintained with flumioxazin at 213.3 g ha-1 active ingredient for PRE weed control, and paraquat at 0.67 to 1.0 kg ha-1 active ingredient with non-ionic surfactant4 at 0.25% volume per volume for POST weed control. A graminicide (fluazifop, sethoxydim or clethodim) was used as needed for perennial grass control.
Application equipment was a CO2 backpack sprayer pressurized at 220-234 kPa using a flat
fan 8002XR nozzle to apply 187 L/ha spray volume. Single, double, and triple nozzle booms
were used according to the strip width being sprayed. Orchard mowers maintained the floor
vegetation between tree rows up to 0.6 m on each side of the trees by cutting to
approximately 10 to 13 cm tall. Trees were pruned each spring in an open-center form
(Lockwood and Myers 2005).
Soil moisture was measured twice weekly May through August (after harvest) with
7
replications per study location. These sensors were set at the second tree in each plot 46 cm
from the tree trunk. Microsprinklers were set 15 cm on the other side of the tree trunk and 76
to 91 cm from the sensor, so that the sensor, trunk and microsprinkler were in a triangular
arrangement. The irrigated plots were watered when the soil moisture readings of the
irrigated standard 3.0 m strip treatment was 20 centibars (cb) or above, as measured by the
granular matrix sensors. (The exception was when the watering did not fit into station
irrigation scheduling or sensors could not be read in time to request for irrigation, both of
which were rare.) (Appendix Tables 1 and 2) Irrigation at Clayton did not begin until spring
of 2006, one year after tree planting. The optimum soil water tension for a particular crop
depends primarily on soil texture. Field capacity is 10 cb or less for a sand (Gary Grabow,
personal communication) and the irrigation range for peach trees in the southeastern U.S. is
20 to 60 cb (Taylor and Rieger 2005), therefore 20 cb was chosen for the threshold. Inside
the sensors is salt dissolved from gypsum that conducts an electrical current based on water
amount present. As the soil dries out, soil resistance increases, and is converted to soil
tension units (cb). The microsprinklers delivered 70 liters per hour in a 6.0 m diameter, 300
degree swathe pattern around the tree. Water in the amount of 2.54 cm was applied at each
irrigation. Precipitation and irrigation records are listed in Appendix Tables 1 and 2.
Trunk cross-sectional area (TCSA) was measured 30 cm above the soil line during the
dormant season. Winter prunings were cut and weighed on March 5 and 6, 2007, and March
3 and 10, 2008 in Clayton and Jackson Springs, respectively. Winter prunings from two trees
per plot were weighed, then the total was divided by two to get winter pruning weight per
8
Jackson Springs by randomly selecting ten leaves per tree. Leaf area was measured with a
LI-COR LI-3100 area meter.6 SPAD measurements measurements were recorded on July 5, 2007, July 2 and 4, and August 22, 2008 in Clayton and July 5, 2007, July 1 and 3, and
August 20, 2008 in Jackson Springs using a SPAD 5027 meter. The average of five readings per tree was recorded from new, fully expanded leaves, approximately the sixth to eighth leaf
from each shoot tip.
Peach leaves were sampled in late July of every year for determination of concentration of
nitrogen, phosphorous, potassium, calcium, magnesium, manganese, iron, copper, sodium,
sulfur, zinc, and boron.
Orchard floor vegetation was harvested May 21 and August 13, 2007, and April 22 and
September 8, 2008 at Clayton, and May 16 and August 10, 2007, and May 22 and September
15, 2008 at Jackson Springs. One 0.37 m2 quadrate was randomly sampled around one of each plot’s buffer trees in three reps. Total vegetation per tree per 3.6 m swathe was
extrapolated from these sample quadrates, with 3.6 m VFWs having values of zero, and
therefore were excluded from statistical analyses. In plots with VFWs of 0 and 0.6 m,
mowing left approximately a 0.6 m nonmowed swathe on each side of the tree, so these
nonmowed areas were sampled additionally, and taken into account when calculating the
total vegetation. From each quadrate, species were separated and dried at 60 C until weight
was constant. Dry weight of each species was recorded. Species at each date and irrigation
level were then tested for percent content of nitrogen, phosphorous, potassium, calcium, and
9
Fruit were thinned on May 9, 2008 at Clayton and May 13, 2008 at Jackson Springs to one
fruit per 18 cm of shoot. Hand harvest began when approximately 5% of total fruit were a
yellow or gold background color. Harvestable fruit were those with this coloring. The final
harvest consisted of all fruit regardless of color. Fruit were picked from each of the two data
trees per plot. Harvests at Jackson Springs were July 17, 21, 24, and 29, 2008 and at Clayton
were July 16, 21, 23, and 25, 2008. Ten random fruit (approximately five from each tree,
when available) were weighed to obtain average weight per fruit. These ten were then laid
on their sides, touching side to side in a row, with suture facing up. This measurement when
divided by ten provided average fruit width. These ten were then turned 90 degrees,
touching tip to tip, with suture facing up. This measurement when divided provided average
fruit length. When ten were not available due to small harvests per plot, the smaller number
was measured for each parameter. A weighted index of individual fruit weight, fruit width,
and fruit length was created for each treatment combination by first figuring the percent
weight of total season’s harvest for each harvest date. This percent was then multiplied by
each date’s harvest parameter of weight, width or length, as mentioned above. The four
figures (representing four harvest dates) were then added together. The third harvest of the
four total harvests at each site was sampled to test for soluble solids (degree Brix) with a
digital refractometer8 and fruit firmness.
Data were subjected to ANOVA with VFW and irrigation as factors. Year, date, and
location were tested using appropriate error terms for significant interaction with VFW and
irrigation to see if data could be combined where appropriate. When VFW was significant at
10
was regressed separately on VFW for each irrigation level (if the irrigation factor was
significant). In certain cases, the interaction of VFW and irrigation was not necessarily
significant; however, separate regressions were still fit because intercepts were different and
both irrigation conditions were of interest in this study. The ANOVA for testing of linear,
lack of fit to linear, quadratic relationship, and cubic relationships (and interactions with
irrigation for each of these) determined the type of regression or trend line. When linear
relationships were significant, dependent variables as a function of VFW were described
through regression with the REG procedure of SAS (SAS 1998). When cubic and quadratic
relationships were significant, relationships were described with the NLIN procedure of SAS
to fit a quadratic plateau model of the form:
Y = a + bV+ cV2 if V < w [1] or Y = P, if V ≥ w
where Y is the dependent variable, a is the y intercept, b and c are coefficients defining the
slope of the line, and V = the width (m) of the vegetation-free strip. The constants a, b, and c
are constrained so that the entire function is unique at all rates of V. The constant w is the
join point (i.e. the VFW at which the quadratic and the plateau portions of the function are
joined). The constant P is the plateau value of the dependent value (Wold 1974). The model
is often used for growth responses to single nutrient fertilization doses (Bullock and Bullock
1994). When the estimate of w is higher than 3.6 m, the response is similar to linear because
it has not leveled off at the highest VFW of 3.6 m. In this case, the w estimate is not reliable;
11
w is within the scope of the data, the quadratic plateau has a better fit compared to the linear
model (Cavell Brownie personal communication).
For TCSA, winter pruning, and harvest data, irrigated VFWs were computed that were
equivalent to the nonirrigated 3.0 m VFW. For TCSA data, effect slices within VFW
compared means of irrigated and nonirrigated plots, and the PDIFF option of PROC GLM in
SAS compared means of each treatment with the 3.6 m nonirrigated treatment. Vegetation
nutrient data were regressed on VFW by irrigation level where appropriate. These data were
also analyzed by protected lsd comparisons across all dates (Appendix Tables 3 and 4).
Results and Discussion
Trunk cross sectional area. Strong interactions were found for study location and tree age,
so studies and years were analyzed separately. (TCSA for two year old trees from each
location could not be combined, and TCSA of three year old trees from each location could
not be combined.) The drought conditions of 2007 and the trees being planted with one year
difference made data combination not possible. The standard factorial ANOVA for TCSA
showed the factors VFW and irrigation to be significant (p≤0.05), with the exception of
Clayton 2007 and 2008. In Clayton 2007, irrigation was significant at level p=0.0784. At
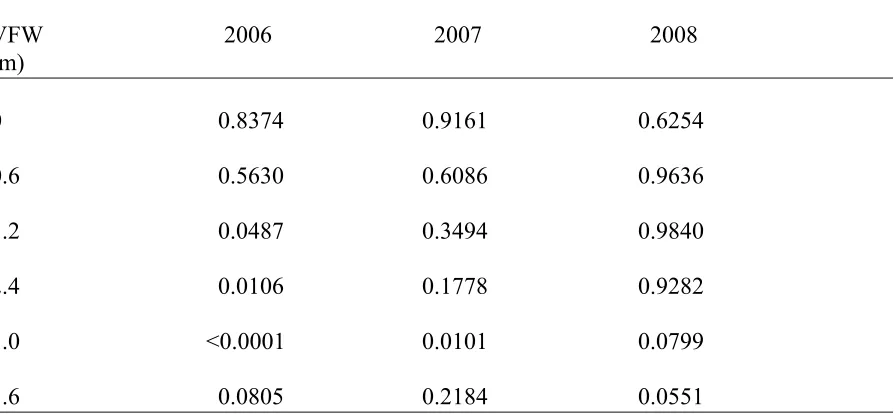
Clayton 2008, only VFW was significant (Table 1). Quadratic plateaus of TCSA on VFW
were fit separately to each irrigation level at each of Clayton (Figure 1) and Sandhills
locations (Figure 4 to 6), with the exception of Clayton 2007 (Figure 2), where simple linear
regression described the data, and Clayton 2008 (Figure 3) where a linear fit described both
12
1 to 3), but was not an outlier when residuals were plotted. When dropped from the data set,
TCSA response to VFW for the irrigated plots would be linear: Y = 13.1 + 6.7 VFW (R2 = 0.93) for 2006, Y = 20.5 + 11.4 VFW (R2 = 0.94) for 2007. TCSA for both irrigation levels combined for 2008 would be described by Y = 32.1 + 13.8 VFW (R2 = 0.90). However, no justification was found for the dropping of this data point from the data set, therefore it was
retained. The predicted join point ‘w’ for the irrigated fitted regressions, i.e. the predicted
VFW at which the TCSA is maximized and starts to plateau, ranges from 2.28 to 4.12,
smaller than their companion nonirrigated fitted regressions, ranging from 4.5 to 8.29 (Table
1).
Without regression and comparing means, at Clayton and Jackson Springs, the TCSA of
trees in irrigated zero and 0.6 m VFWs were smaller than those in the nonirrigated 3.6 m
VFW (Tables 2 and 3). Likewise, the irrigated 1.2 and 2.4 m VFW at both locations (with
the exception of Clayton 2008 1.2 m) were not different from the 3.6 m, nonirrigated VFW.
This observation can be interpreted that irrigation allows reduction of herbicide strip width
down to 1.2 m without reduction in TCSA. Within nonirrigated plots, TCSA of trees in 0,
0.6, and 1.2 m VFWs were smaller than those in the 3.7 m VFW (Tables 2 and 3).
The nonirrigated regressions have smaller slopes (parameter b) than the irrigated
regressions i.e. the benefit of irrigation is large due to the rapid increase in TCSA (Table 1).
However, there is no difference between irrigated and nonirrigated plots at 0 VFW (Table 4
and 5). This observation means irrigation could not lessen the impact of weed competition at
the most intense competitive impact of the 0 VFW treatment. At Jackson Springs in the
13
same VFW in VFWs of 0.6 m and wider (Tables 5), but at Clayton, irrigated trees were not
different from their nonirrigated counterpart of the same VFW, except for the 2007 3.0 m
VFW (Table 4).
The effect of the drought may have slowed tree growth because for trees of the same age,
the predicted join points (parameter w) are larger and tree size (represented by y - intercepts
or parameter a) is smaller for the trees at the end of 2007. For example, the predicted join
points are 4.12 and 8.29 and the y - intercepts are 10.9 and 7.64 (irrigated and nonirrigated)
for Jackson Springs 2007 compared to 2.88 and 6.08 and the y - intercepts 12.09 and 12.57
(irrigated and nonirrigated) for Clayton 2006 (Table 1). Likewise, for the three year old
trees, the y - intercepts are 26.93 and 23.69 (irrigated and nonirrigated) for Jackson Springs
2008 compared to 24.13 and 20.33 (irrigated and nonirrigated) for Clayton 2007 (Table 1).
Interestingly, the equivalent irrigated VFWs to 3.0 m nonirrigated is the same for two year
old trees: 1.32 m (Table 1). It ranges from 0.8 to 2.17 for all tree ages at both locations. The
0.8 m equivalent irrigated VFW for Jackson Springs 2008 was low because the slope of the
irrigated trees was almost three times greater than that of the nonirrigated trees i.e. irrigation
benefit was high in this case (Table 1). This difference in magnitude may be due to trees
getting larger and water needs increasing. The Clayton 2007 and 2008 tree response was best
described by a simple linear regression. TCSA at Jackson Springs seemed to increase more
rapidly with VFW i.e. the benefit of weed control was great, resembling a quadratic fit rather
than linear. Therefore, the effect of competition may have been greater at Jackson Springs
because for all three years a quadratic trend fit the data. The point at which a linear response,
14
not tested in the scope of this data set. By 2008 in Clayton, there was no difference in
irrigation levels (Table 1) which suggests another factor of influence.
Winter prunings. All data were subjected to ANOVA. At Jackson Springs, the standard
factorial ANOVA for winter prunings showed the factors VFW and irrigation to be
significant (p≤0.05). At Clayton, however, irrigation effect was not significant but the
ANOVA testing linear and lack of fit to linear responses showed VFW*VFW*irrigation to
be significant (p = 0.0311), so separate trends were fit. Winter prunings on VFW followed a
quadratic plateau for irrigated plots, while nonirrigated increased linearly with VFW (Table
6) for Clayton 2007. By 2008, the trees were combined into one regression trend because
they varied similarly with VFW. This trend is similar to results above for TCSA. At Jackson
Springs, winter prunings displayed quadratic plateaus for both years and irrigation levels
(Table 6), also similar to results for TCSA.
In 2007 the equivalent irrigated VFW to grower standard (3.0 m VFW, nonirrigated) was
2.17 m for Clayton (Table 6), and for TCSA 2006 was 1.32 (Table 1) (both reflect 2006
growing season). These figures are similar. In Jackson Springs for consecutive years 2007
and 2008, the equivalent irrigated VFW was 1.53 and 1.60 for winter prunings (Table 6) and
1.52 and 1.32 for TCSA (Table 1) (both reflect 2006 and 2007 growing season). These
figures are also similar.
Individual leaf area. As mentioned above, leaf area was measured one time, in spring of
2008 when trees were three years old at Jackson Springs and four years old at Clayton. At
Clayton, leaf area increased with VFW for irrigated and nonirrigated trees, and nonirrigated
15
VFW (R2 = 0.70) and Y = 15.18 + 1.24 (R2 = 0.84), respectively. The mean area of irrigated trees’ leaves was 13.98 cm2 while that of nonirrigated trees’ leaves was 17.45 cm2 (p < 0.0001). At Jackson Springs, leaf area displayed a quadratic relationship with VFW for
irrigated trees, with no effect of VFW for the nonirrigated trees. Irrigated trees followed the
trend Y = 11.95 - 2.91VFW + 0.74 VFW.2 The mean area of irrigated trees’ leaves was 10.39 cm2 while that of nonirrigated trees’ leaves was 14.42 cm2 (p< 0.0001). Visual observation of lighter green leaves of the irrigated trees compared to the nonirrigated trees
was noted.
SPAD measurement. SPAD measurements reflect leaf chlorophyll nitrogen, and are used
as a measure of relative foliar nitrogen content between treatments because leaf chlorophyll
content and leaf nitrogen content are closely linked (Bullock 1994). The meter quickly
measures nitrogen status by emission of wavelengths in the infrared and red ranges that
transmit through the leaf according to the chlorophyll content, since chlorophyll transmits
those in the infrared and absorbs those in the red ranges (Anonymous 2007). The readings
allow for more “snapshots” of nitrogen status than the traditional annual foliar sample
subjected to laboratory testing. Relatively higher chlorophyll nitrogen in leaves is reflected
by darker leaves than those with relatively lower chlorophyll nitrogen, which have lighter
leaves. For the purposes of the following discussion, leaves may be referred to as “darker or
lighter” for brevity.
At Clayton, the ANOVA test of main effects, VFW and irrigation, were significant. Date *
irrigation was also significant (p < 0.0001). Effect slices of irrigation at each date showed
16
significance was due to differences in magnitude. So, all dates were combined for analysis
between irrigation levels, averaged across date. The average of irrigated plots (36.7) was
lower than the average of nonirrigated plots (39.6) (p < 0.0001). Irrigation on July 3, 2008
did not change leaf color in irrigated plots, as shown by a contrast statement investigating
mean value for irrigated plots, averaged over VFW, for July 2 and July 4, 2008 (P=0.2327).
Separate regressions were fit for each irrigation level: quadratic plateaus of SPAD on VFW.
The irrigated predicted parameters are: a = 34.31, b = 2.38, w= 3.07 (R2 = .99). The
nonirrigated predicted parameters are: a=38.06, b=3.42, w=1.16, (R2 = 0.82) (Figure 7). The nonirrigated trees were darker at wider VFWs, therefore had reached maximal darkness at
1.16 m VFW, compared to maximal darkness for the irrigated at 3.07 m. On August 22,
2008, the fourth date, nonirrigated trees were still 1.2 units darker green than irrigated trees
(p = 0.0378), but this difference is less than the average across all dates (3.1) as mentioned
above. As the season progresses, the darkening of leaves is expected as leaves age (Michael
Parker, personal communication). As the season progressed in 2008, the difference in color
narrowed between irrigation levels, as irrigated leaves became darker with season
progression, and nonirrigated leaves were already dark. Across all dates and only comparing
means (without regression), SPAD means of all treatments were compared to the 3.6 m,
nonirrigated treatment. Irrigated trees of 0 and 0.6 VFW were lighter green than the 3.6 m
VFW, nonirrigated (P=.0040 and 0.0196, respectively), while other VFWs (1.2, 2.4, and 3.0
m) of both irrigation types were not different from the 3.6 m VFW, nonirrigated treatment.
At Jackson Springs, the ANOVA test of main effects, VFW and irrigation, with
17
date, and the triple interaction between VFW, irrigation and date were significant, so
irrigation was analyzed separately by date and VFW. Across all dates and VFWs, the
average SPAD of irrigated plots (36.5) was lower than the average of nonirrigated plots
(40.6) (p<0.0001), which are similar to results from Clayton.
When VFW 0 to 1.2 were combined, VFW*irrigation*date was not significant, however,
VFW*irrigation, with block*VFW*irrigation used as the error term, was significant
(p=0.0086), so these VFWs were not combined. For VFW 0, irrigated (41.96) and
nonirrigated (40.93) were not different for the fourth date August 20, 2008 (p=0.3577)
(Figure 8a). Similar to Clayton, the difference in color narrowed between irrigation levels
later in the season. Here, stressed irrigated tree leaves appeared not to be darkening as much
as those of wider VFWs (Figure 8b and 8c), and nonirrigated dark leaves actually appeared to
be becoming lighter. Irrigation on July 2, 2008 did not affect leaf color as measured by a
contrast statement comparing leaf color the day before irrigation to the day after irrigation
(p= 0.4620).
For VFW 0.6 and 1.2 at date 4, however, the irrigated tree leaf color (43.35) had surpassed
the nonirrigated tree leaf color (40.41) and was actually darker (P=0.0001) (Figure 8b). The
irrigated tree leaves were darkening as expected while the nonirrigated leaves appear to be
lightening from July to August 2008, and surpass the nonirrigated in darkness. Across VFW
0.6 to 1.2, leaf color did not change the day before to the day after an irrigation for irrigated
or nonirrigated, as shown by contrast statements investigating mean value, averaged over
18
VFW 2.4 to 3.6 were combined, because VFW*irrigation*date was not significant
(P=0.6475). Leaf color was lighter in irrigated plots compared to nonirrigated plots for early
July of 2007 and 2008 (P<0.0001) but by August 20, 2008, leaves were the same as
nonirrigated plots (Figure 8c). The normal pattern of darkening leaves from July to August
2008 was seen for both irrigation levels to the point where they became the same color. Leaf
color did not change in nonirrigated plots on July 1 to July 3, 2008, as shown by a contrast
statement investigating mean value for nonirrigated plots, averaged over VFW (P=0.7127).
However, leaf color did change from the day before to the day after an irrigation in irrigated
plots, as shown by a contrast statement investigating mean spad value for irrigated plots,
averaged over VFW (P=0.0341). However, the leaves became darker not lighter. Since
nonirrigated leaves are darker than irrigated, one would expect irrigation to have a lightening
effect if it were the cause. This phenomena is probably not due to the irrigation event, but
because the leaves were darkening in color with season progression.
In summary, leaf color was darker in nonirrigated plots at both locations in July of 2007
and 2008, However as the season progressed in 2008, the difference in color narrowed
between irrigation levels, as irrigated leaves became darker with season progression. At
Jackson Springs in 2008 the nonirrigated trees in the 0, 0.6, and 1.2 m VFW appeared to
getting lighter with season progression.
Harvest. None of the following fruit parameters had interactions between VFW and
irrigation factors, but regressions were fit separately for irrigation level to answer the
objective of this study which was to determine equivalent values for dependent variables
19
VFWs seemed to have ripe fruit sooner. This observation was magnified in the nonirrigated
plots. The mean percent of first harvest of total harvest (a measure of earliness) of the
irrigated plots (9%) was lower than that of the nonirrigated plots (19%) (p < 0.0001). Percent
of first harvest of total harvest followed a quadratic plateau trend for the nonirrigated, with
the predicted join point of 1.04 m VFW (R2 = .82) (Table 7 and Figure 9). The irrigated plots showed no regression trend, but the irrigated 0 m VFW (33%) was higher than the
average of the other irrigated VFWs (5%) (p < 0.0001). The y-intercept is larger for all
parameters in the irrigated plots vs. nonirrigated plots (Table 7). Fruit length displayed
quadratic plateau trends for both irrigated and nonirrigated. It was the largest at VFW 1.89 m
(and above) in irrigated plots and 0.84 m (and above) in nonirrigated plots (Table 7). Mean
fruit length was 7.15 cm and 6.68 cm for irrigated and nonirrigated respectively (p < 0.0001).
Fruit width displayed quadratic plateau trends for irrigated, but nonirrigated displayed a
quadratic trend. Irrigated tree fruit width was the widest at VFWs 2.33 m and above (R2 = .93). Mean fruit width was 7.29 cm and 6.81 cm for irrigated and nonirrigated respectively
(p < 0.0001). Individual fruit weight (g) on VFW displayed a quadratic plateau for both
irrigated and nonirrigated. It was the largest at VFW 2.83 (and above) in irrigated plots and
1.96 (and above) in nonirrigated plots (Table 7). Mean individual fruit weight was 49.05 g
and 41.43 g for irrigated and nonirrigated respectively (p < 0.0001). Harvest season totals
(1000 kg ha-1) displayed quadratic plateau trends for both irrigated and nonirrigated (Figure 10). The predicted join points (w) for the fitted regressions, i.e. the predicted VFW at which
the yields are maximized and start to plateau is outside the scope of the data, but is higher for
20
(1000 kg ha-1) was 4.39 and 3.03 for irrigated and nonirrigated respectively (p = 0.0005). Fruit soluble solids increased linearly with VFW for nonirrigated trees: Y = 12.37 + 0.139
VFW, R2 = 0.71, and the mean soluble solids for irrigated trees was lower at 11.8 vs 12.6 for nonirrigated (p < 0.0001) (Appendix Figure 1). Treatment differences were not found for
fruit firmness (Appendix Figure 2).
At Clayton, no treatment differences were found for percent of first harvest of total harvest.
As with TCSA, winter pruning, and leaf area, harvest parameters followed linear responses.
Nonirrigated trees produced longer fruit, wider fruit, heavier individual fruit, and greater
yield (kg ha-1), although the yield difference was only marginally significant. The y-intercept is smaller for all parameters in the irrigated plots vs. nonirrigated plots (Table 8). Fruit
length increased linearly with VFW with separate trends for irrigated and nonirrigated plots
(Table 8). The mean length for irrigated plots was 6.7 cm versus 7.0 cm for nonirrigated
plots (p < 0.0001). Fruit width increased with VFW with separate trends for irrigated and
nonirrigated. Fruit width displayed a quadratic plateau trend for irrigated, but nonirrigated
displayed a linear trend. Irrigated tree fruit width was the widest at VFWs 3.6 (R2 = 0.78). Mean fruit width for irrigated trees was 7.0 cm versus 7.3 cm for nonirrigated trees (p =
0.0004). Individual fruit weight (g) increased linearly with VFW with separate trends for
irrigated and nonirrigated plots (Table 8). The mean individual fruit weight for irrigated
plots was 43.5 g versus 49.5 g for nonirrigated plots (p = 0.0002). Harvest season totals
(1000 kg ha-1) on VFW displayed linear trends for each irrigation level but the difference in irrigation levels was marginally significant at p = 0.0573 (Table 8 and Figure 11). The mean
21
soluble solids were not different by VFW, but irrigation factor was significant (P=0.0033),
with the mean soluble solids of irrigated plots (11.99) being higher than nonirrigated plots
(11.51) (Appendix Figure 3). Treatment differences were not found for fruit firmness
(Appendix Figure 4).
Results for fruit quality were inconclusive. Soluble solids were greater in fruit of irrigated
trees versus nonirrigated trees at Clayton, but the reverse was true at Jackson Springs with no
consistent effect of VFW. Tworkoski et al. (1997) found similar results in a nonirrigated
situation in that size of vegetation-free area within a cover of grasses had no effect on
concentration of soluble solids in peach fruit.
Soil moisture. Plotting the residuals showed a square root transformation to correct for
nonhomogeneity of variance. Repeated measures ANOVA was run on all data by location
and year. The irrigation factor was very strong, so comparisons for VFW were by irrigated
and nonirrigated. A test of effect slices by each day showed for which days soil moisture
was different by VFW, and the maximum lsd was recorded.
Soil moisture was less among non-irrigated plots compared to irrigated plots, but there
were few differences between VFWs within each irrigation level later in the season (Figures
12 to 14). In a few instances (Jackson Springs irrigated trees 2007 and nonirrigated trees
2008), the larger VFWs dried out faster than the other VFWs. These trees were larger with
higher water demand. There was however, a trend of differences between VFWs within each
irrigation level early in the season, from the start of measurement to days 144 to 163 (Figures
12 to 14), and to days 163 to 177 for Clayton (Figures 15 to 17): competition from vegetation
22
in full bloom stage on day 91 (April 1, 2008) at Clayton and on day 93 (April 3, 2008) at
Jackson
Springs. The cell division stage of fruit development would last until approximately day 143.
On day 178 approximately, final swell would begin based on harvest beginning on day 199
(July 17, 2008). Based on these approximate periods of fruit development, the dryness
caused by the vegetation would coincide with cell division and pit hardening, stages one and
two of fruit development.
The first irrigation of each year was day 174, day 145, and day 154 for 2006, 2007, and
2008, respectively, at Jackson Springs, and was day 195, day 144, and day 158 for 2006,
2007, and 2008, respectively, at Clayton, which would miss these earlier soil moisture
differences due to vegetation. As mentioned above, irrigation scheduling was based on the
threshold for the 3.0 m irrigated so irrigation would not have occurred anyway if only the
smaller VFWs were dry. From these data, the period of competition for water caused by the
vegetation actually occurs before days 144 to 163 (Jackson Springs) and before days 163 to
177 (Clayton). These results agree with MacRae et al. who found that a weed-free interval of
12 wk after bloom (approximately day 177) resulted in the greatest fruit size, total yield, and
fruit number in mature trees. In a study by Huslig et al., with trickle irrigation and 3.0 m
VFW, peach trees were irrigated according to the following treatments: no irrigation,
irrigation budbreak to October, budbreak to harvest, stage III fruit growth (final fruit swell)
to October, and stage III fruit growth to harvest. Irrigation before stage III fruit growth did
not affect fruit yield, size, or pruning weights compared to trees irrigated at the onset of stage
23
to 70 mm (large fruit) than non-irrigated. Earlier irrigation timing during cell division and pit
hardening stages of fruit development may help mitigate the negative effects of floor
vegetation. Current extension recommendations advise that dryness during the 4 to 6 wk
preceding peach maturity is significantly detrimental to yield and fruit quality (North
Carolina State University Cooperative Extension Service 1999) but results from this study
suggest this period may start earlier. In 2006 and 2007, during the early non-bearing years,
peach root growth may have been restricted by the vegetation. New white root growth
occurs in young, nonbearing trees throughout the growing season, while mature trees produce
new white roots only in March to June, and resume following fruit removal in August and
persist through January (Glenn and Welker 1993a). In greenhouse studies, Glenn and
Welker (1993b) showed that peach fine root development in sod is restricted when water is
limiting and could account for differences in growth. However, in the oldest trees in our
study (Clayton 2008) no differences in soil moisture were found within irrigated or
nonirrigated trees. As the trees aged in our study, detecting soil moisture differences of
VFW at the 30 cm depth (that was used in this study) may have become more difficult due to
deeper root development. This idea is supported by the findings of Glenn and Welker
(1993a) who found a lack of correlation between plant available water and peach root density
within 1 m of the tree and to a depth of 90 cm, suggesting that deep roots help maintain the
surface root system when the soil dries. This idea is also supported by the findings of Smith
et al. (2002) who found that soil moisture differences due to vegetation-free area were greater
24
differences in this study due to VFW were probably occurring deeper than 30 cm as trees
became larger and deeper rooted.
Foliar element concentrations. Since 2007 (year 2) was a very dry year, there are many
interactions by year. For nitrogen (%), at Jackson Springs, an interaction was present for
year * VFW and year * irrigation, so years were analyzed separately. All years had
significant irrigation effects, with nonirrigated trees (4.01, 3.46, and 3.94) having higher % N
than irrigated (3.69, 2.78, and 3.44), (p = 0.0021, < 0.0001, < 0.0001), for 2006, 2007 and
2008, respectively. In 2006 and 2007, nitrogen of irrigated trees increased along a quadratic
plateau with VFW. In 2006 the parameters were a = 2.5, b = 1.99, and w = 1.54 (R2 = 0.90) and in 2007 were a = 2.29, b = 1.01, w = 1.23 (R2 = 0.96). The increase of nitrogen with VFW was probably related to the competition for nitrogen with the vegetation. Similarly,
Haynes (1980), and Welker and Glenn (1985, 1988) reported that foliar N concentration
increased when trees were grown in bareground compared to grass sod and Welker and
Glenn (1991) reported higher soil NO3 and P when peaches were grown on bare soil
compared to growing with a living fescue sod. The irrigated trees may have been more
susceptible to vegetation effect if soil N was lower due to leaching caused by the additional
water received through irrigation compared to the nonirrigated trees. In 2008, the nitrogen in
nonirrigated trees decreased linearly with VFW: Y = 4.49 - 0.30 VFW, (R2 = 0.96). The negative trend in nonirrigated trees could be due to increased nitrogen cycling by the
vegetation without leaching being as dominant a factor as the irrigated situation. Nitrogen
cycling is centered in the relationship of the less bare ground, the more organic matter
25
microbes that utilize nitrogen, reducing leachability of nitrogen. Soil microbes decompose
organic matter (mineralization) releasing nutrients to the tree. Also the plants take up
nitrogen, reducing the leachable nitrate nitrogen in the soil. (Edson 2003). At Clayton, the
effect of irrigation on nitrogen (%) was different by years but VFW had no effect for any
year. Leaf nitrogen concentration was not affected by VFW, indicating that tree competition
for nitrogen with the vegetation was minimal. Percent nitrogen was not different among
treatments in 2006, but it was higher in nonirrigated trees (3.34) than irrigated trees (3.01%)
in 2007 and 2008 (p < 0.0001).
The common trend between locations is that nonirrigated trees had higher percent nitrogen.
NO3 is leachable and probably leached from the irrigated plots. However, nitrogen is
deficient under 1.7% (Lockwood et al. 2005), so no deficiencies were present at the time of
sampling. Warren (1986) postulated that seasonal oscillations with decreased NO3 levels in
the spring and elevated levels in the fall occured due to a rise in soil temperature (and in turn
microbial activity) so it may be possible that deficiencies in the springtime would not have
appeared in foliar testing of late July. Gupta and Rorison (1975) have confirmed the
occurrence of seasonal flushes in the availability of nitrogen (and phosphorous) in
noncultivated soil. Taiz and Zeiger (2002) describe nitrogen deficiency symptoms as
chlorosis, especially of older leaves, which can become completely yellow and fall from the
plant. Younger leaves can become light green in color while older leaves become yellow or
tan. These symptoms were evident in this study. Symptoms of nitrogen differences may
have been the lighter green leaves of the irrigated trees as measured by the SPAD meter (as
26
defoliation of older leaves of the irrigated trees in October 2008 compared to the nonirrigated
trees. Leaf size as measured after budbreak in spring 2008 showed smaller and lighter green
leaves of irrigated trees compared to the nonirrigated (as mentioned previously). Companion
research in this experiment studied the Jackson Springs site soils. The nonirrigated plots had
higher soil available nitrogen compared to the irrigated, and the 0 m VFW had higher
microbial carbon content compared to the 3.6 m VFW (which reflects microbial activity)
(Wang Liang Ju personal communication). This finding would support these nitrogen foliar
concentration findings.
For phosphorous (%) at Jackson Springs, interactions were present for VFW*year,
irrigation*year, and VFW*irrigation*year. In 2006 and 2007, irrigated trees had higher
phosphorous (0.26 and 0.19%) versus 0.18 and 0.15% in nonirrigated trees (p<0.0001 and p
= 0.0021), respectively. However in 2008, irrigated trees had lower phosphorous (0.20%)
versus 0.23% in nonirrigated trees (p < 0.0001). These levels are adequate based on
deficiency ranges below 0.11% (Lockwood et al. 2005). In 2006 and 2008, phosphorous
increased with VFW in irrigated trees: The trend for 2006 was Y = 0.21 + 0.03 VFW (R2 = 0.89). The trend for 2008 was a quadratic plateau with parameters: a = 0.19, b = 0.02, and xo
= 1.99 (R2 = 0.95). In 2007 and 2008 the phosphorous in nonirrigated trees decreased linearly with VFW: Y = 0.16 - 0.006 VFW (R2 = 0.74) and Y = 0.289 - 0.03 VFW (R2 = 0.93), respectively. At Clayton, the effect of irrigation on phosphorous (%) was different by
years. In 2006, irrigated trees had higher phosphorous (24%) versus 19% in nonirrigated
trees (p < 0.0001). Phosphorous increased with VFW in irrigated trees following a quadratic
27
significant in 2007. In 2008, irrigated trees had lower phosphorous (19%) versus 21% in
nonirrigated trees (p = 0.0025). Also in 2008, phosphorous decreased linearly with VFW in
nonirrigated trees, following the trend Y = 0.22 - 0.006 VFW (R2 = 0.80).
At both locations, the trends of phosphorous closely resemble those of nitrogen as above:
irrigated trees had more phosphorous in the early years, but by 2008 had less phosphorous
compared to nonirrigated trees, phosphorous increased with VFW in irrigated trees, but
decreased with VFW in nonirrigated trees. Soil N and P in noncultivated soils have been
shown to be positively related and was attributed to mineralization of organic P being
positively correlated with mineralization of organic N (Gupta and Rorison 1975). Haynes
(1980) reported that foliar P, K, and Ca concentrations decrease in bareground compared to
foliar P, K, and Ca concentrations in a grass sod. Phosphorus apparently accumulates near
the soil surface in bare ground compared to a grass sod which is a consequence of surface
compaction and resulting poor infiltration properties. This work agrees with the negative
trend of foliar P in nonirrigated trees by the end of our study. In the companion paper (Wang
Liang Ju personal communication.) mentioned above, preliminary soil testing results also
showed that irrigated trees had higher vesicular arbuscular mycorrhizal fungi infection than
nonirrigated trees. This symbiosis is known to aid in phosphorous uptake (Smith et al. 1997).
However, phosphorous was decreased in the irrigated trees.
For potassium (%) at Jackson Springs, the effect of irrigation was different by year. For
2006 and 2007, irrigated trees had less potassium (1.67 and 1.10%) versus 2.22 and 1.21% in
nonirrigated trees (p < 0.0001 and p = 0.0063). By 2008, the irrigated trees had more
28
adequate over 1.2. In 2006 and 2008, the nonirrigated tree potassium decreased linearly with
VFW: Y = 2.49 - 0.15 VFW (R2 = 0.86), and Y = 1.41 - 0.06 VFW (R2 = 0.83), respectively. Percent leaf potassium showed no treatment differences at Clayton. Potassium leaches
readily (Lockwood et al. 2005) and decreased with VFW presumably due to reduced water
movement through the vegetation or vegetation uptake thereby reducing leaching.
For calcium (%) at Jackson Springs, irrigation and VFW effects were different by year.
Irrigated trees had lower calcium in 2006 (0.70%) compared to the nonirrigated trees (0.78%)
(p = 0.0015), but in 2007 irrigated trees had higher calcium (1.11%) than nonirrigated trees
(0.90%) (p < 0.0001). No irrigation effect was found in 2008, but calcium in the nonirrigated
trees increased with VFW: Y = 0.71 + 0.06 VFW (R2 = 0.70). The average percent calcium for irrigated plots was 0.81, and for nonirrigated was 0.82, which do not differ from each
other, but are important because both are deficient levels. However, no calcium deficiency
symptoms were observed for any location or year. The adequate range is 1.0% or over. At
Clayton, the effect of irrigation on calcium (%) was different by years. While calcium was
not different among treatments in 2006 and 2007, irrigation did have a significant effect in
2008. Irrigated trees had higher calcium content at 1.09% versus 0.81% of nonirrigated trees.
Calcium in irrigated trees decreased linearly with VFW (Y = 1.2 - 0.07 VFW, R2 = 0.54). This result agrees with Haynes (1980) who reported foliar Ca concentrations decrease in
bareground compared to foliar Ca concentrations in a grass sod, and Haynes and Goh (1980)
who found less soil Ca from bare ground plots compared to grassed and suggested this was
due to increased leaching. The positive effect of VFW in the nonirrigated trees by the third
29
and vegetation uptake decreased with increasing VFW (less competition), making more
calcium available to the tree.
Magnesium (%) at Jackson Springs varied by year for VFW and irrigation. In 2006,
magnesium in irrigated trees was 0.38 versus 0.41 in nonirrigated trees (p = 0.0003). In
2007, no treatment differences were found. In 2008, magnesium of nonirrigated trees
followed a linear regression trend of the form Y = 0.29 + 0.03 VFW (R2 = 0.89). Irrigation was not significant in 2008. At Clayton, magnesium displayed triple interaction by
irrigation, VFW, and year therefore years were analyzed separately. Both irrigation and
VFW affected magnesium in 2006. Irrigated trees had lower magnesium content at 0.32%
versus 0.35% of nonirrigated trees (p = 0.0377). Magnesium decreased linearly with VFW in
irrigated trees (Y = 0.35 - 0.02 VFW, R2 = 0.82 and in nonirrigated trees (Y = 0.37 - 0.01 VFW, R2 = 0.52). Welker and Glenn (1985) also reported that leaf Mg decreased as vegetation-free area increased. Irrigation did not have an effect in 2007, but magnesium in
nonirrigated trees decreased linearly with VFW (Y = 0.50 - 0.01 VFW, R2 = 0.76). By 2008, irrigated trees had higher magnesium content of 0.45% versus 0.35% in nonirrigated trees (p
< 0.0001). Magnesium in irrigated trees decreased linearly with VFW (Y = 0.49 - 0.03
VFW, R2 = 0.76). Magnesium is sufficient over 0.25. The lower magnesium content of irrigated trees in 2006 at both sites was probably due to leaching. The negative trend of
decreased Mg with VFW in the irrigated trees is probably related to increased leaching with
wider VFWs. Haynes and Goh (1980a, 1980b) found that exchangeable Ca and Mg in the
surface soil under sod compared to bare ground was higher indicating less leaching under
30
fact, by the last year of the study, irrigated trees generally had more of each cation
concentration (more potassium at Jackson Springs, more calcium at Jackson Springs 2007,
and more calcium and magnesium at Clayton) compared to the nonirrigated trees, when one
would expect these leachable ions to be less concentrated in irrigated trees than nonirrigated
trees. Bould and Jarrett (1962) found that the negative correlation between K and N
concentrations in trees resulting from various orchard management systems stemmed from
the lower N content and reduced leaf growth consequently increasing concentration of K in
the tree as a whole. This concentration effect was also suggested by Shribbs and Skroch
(1986) to explain high phosphorous concentration in apple. This could be the case for K as
well as each of the other cations.
Vegetation element content. For this discussion, sampling dates in spring of 2007, summer
of 2007, spring of 2008 and summer of 2008 are referred to as sampling dates 1, 2, 3, and 4,
respectively. Common to all of the sampling dates is a linear decrease in total aboveground
shoot biomass with increasing VFW, and common to all of the following elements is a linear
decrease in kg ha-1 with increasing VFW.
At Jackson Springs, total weight of vegetation decreased with VFW for all dates with no
significant differences by irrigation (Table 9). Forbs made up 83 to 100% of winter
vegetation dry weight, while 0 to 17% consisted of grasses and sedges (Table 12). Forbs
made up 17 to 66% of summer vegetation dry weight, while 34 to 83% consisted of grasses
and sedges (Table 13). A difference in makeup of forbs and grasses between irrigated and
nonirrigated treatments was not apparent for any sampling date. Winter vegetation consisted
31
horseweed, Carolina geranium, Virginia pepperweed , catsear falsedandelion, Florida pusley
(Richardia scabra L.), yellow woodsorrel, narrowleaf vetch, and red sorrel. Summer
vegetation included large crabgrass, Florida pusley, carpetweed (Mollugo verticillata L.),
poorjoe, horseweed, Virginia pepperweed, cutleaf evening primrose, pink purslane, catsear
falsedandelion, yellow nutsedge (Cyperus esculentus L.), and longspine sandbur (Cenchrus
longispinus (Hack.) Fern).
At Clayton, total weight of vegetation decreased with VFW for all dates with no significant
differences by irrigation, except summer of 2007, for which irrigation effect was significant
(Table 9). This sample date coincided with a statewide drought that probably translated into
reduced shoot biomass in the nonirrigated plots. For this sample date, the irrigated plots
contained on average 739.0 kg ha-1 dry weight while nonirrigated plots contained on average 368.2 kg ha-1 (p = 0.0006). Forbs made up 98 to 100% of winter vegetation dry weight, while 0 to 2% consisted of grasses and sedges (Tables 10). Forbs made up 0 to 29% of
summer vegetation dry weight, while 71 to 100% consisted of grasses and sedges (Table 11).
A difference in makeup of forbs and grasses between irrigated and nonirrigated treatments
was not apparent for any sampling date. Winter vegetation included purple cudweed
(Gnaphalium purpureum L.), cutleaf evening primrose (Oenothera laciniata Hill), horseweed
(Conyza canadensis (L.) Cronq.), Carolina geranium (Geranium carolinianum L.), Virginia
pepperweed (Lepidium virginicum L.), catsear falsedandelion (Hypochoeris radicata), yellow
woodsorrel (Oxalis stricta L.), narrowleaf vetch (Vicea villosa Roth), Carolina
falsedandelion (Pyrrhopappus carolinianus (Walt.) DC), buckhorn plantain (Plantago