Optimization Shape of Compressor Disc
D.Jyoshna1, D.Krishnaiah2
PG Student, Dept. of ME, Siddartha Institute of Engineering & Technology (SIETK), Putur, AP, India1 Assistant Professor, Dept. of ME, Siddartha Institute of Engineering & Technology (SIETK), Putur, AP, India2
ABSTRACT: The Optimization of various aero engine components has a very big role in effective development of modern aircrafts. In the current project, the rotating compressor disk is the component chosen for shape optimization. The problem of this study is that consideration of aero engine disc that works with a high rotational velocity at elevated temperatures. The compressor disk is analyzed in ANSYS APDL tool to get stress outputs and the results are calculated analytically. The FEA model of the disc is modeled in an analysis tool ANSYS and analysis is carried out to get stress output. Calculating the burst margin for every result output. Selecting the best optimum result by consideration of minimum disk mass and burst margin increment obtained during the analysis.
KEYWORDS: Aircraft Engine, Shape Optimization, ANSYS APDL, Compressor Disc.
I. INTRODUCTION
A compressor disc is a very important component in an aircraft engine. The work of the compressor is to convert the kinetic energy of the fluid or air passing through it to potential energy, this process is done by compressing the fluid passing through it. After compression the fluid is made to pass to the combustion chamber where the fuel is burnt in the engine and the hot gases flows through turbine blades to rotate it. In the operation the aero engine must sustain a huge load. Due to a very high rotary sped and high temperatures of about 300°- 500° Celsius. These various loads imposes huge amount of stresses in the engine parts and also the compressor disc. At first the initiation of static cracks takes place in the disc and then the cracks grow vigorously resulting in failure the of compressor disc. The bursting of the compressor disc may lead to failure of the aircraft engine creating dangerous circumstances in an air craft.
Burst speed is the rotational speed of the compressor disc at which the disc starts to yield. The burst margin is the range of rotational speed at which the compressor disc can operate safely without yielding. The discs in the aero engine constitutes of about 25-30 % of mass in the overall engine’s weight. Reducing the weight of the compressor disc is very important to improve the efficiency and performance of the aero engines. In the current project work, the shape optimization of the compressor disc is done. The optimization of disc can reduce the mass of the disc with more strength. This increases the weight to thrust ratio of the engine, and also plays a major role on the weight deciding factor for other components like shafts and blades. The compressor disc is designed and simulated with the help of analysis software “ANSYS MAPDL V15”. A typical compressor disc is designed with appropriate dimensional tolerances. In modern days the computational FEA method became handy and alternative method in product development process of various components and products in various industries typically in the aircraft industries. The more expensive it becomes for the experimental setups compared to the numerical and analytical methods like FEA.
optimization for burst margin and weight reduction for a compressor disc is carried out in this project. The results are matched with analytical calculations.
II.METHODOLOGY (a) Material description
In the project work, the material used has material properties of young’s modulus about 110 GPa at 420° Celsius, the poison’s ratio is 0.3. The density of the material is 4.1 kg/m3. The ultimate tensile strength (UTS) is 725 MPa. The angular velocity of the rotating disc is 14005.5 RPM. The specifications and properties of the material are not disclosed by the organization. They provided the data which are required for the analysis. The material properties of the material used is provided in the table 1.
Material properties of the model
Table: 1 Material properties of the model
Temperature 2 420° Celsius
Young’s modulus (E) 110 GPa
Poison’s ratio (υ) 0.3
Material Density 4.1 g/m3
Ultimate Tensile Strength 725 MPa
Analysis of a general regular shaped hollow rotating disc
Hollow disc which has regular normal cylindrical dimensions is considered to do analysis for validation process. In this sector the analysis is done out for hoop stresses and radial stress for a hollow disc which is a regular geometry. Here for the hollow disc stress analysis, the relevant mathematical expressions are available for manual calculations. The material properties given during the analysis in the tool are
Table: 2 Material properties for hollow disc
Young’s modulus (E) 110 GPa
Poison’s ratio (υ) 0.3
Material Density 4.1 kg/m3
Ultimate Tensile Strength 725 MPa
The Area weighted mean hoop stress (AWMHS) calculation of for a disc is not possible without the help of an analysis tool. To calculate the AWMHS of the disc, every individual element with its average stress values are necessary. The hand calculation of hoop stresses for an irregular geometry is also very difficult, since the required mathematical expressions for an irregular geometry are not readily available. Hence, we are taking a normal regular geometry for validation. The actual project’s modeling is done in chapter 5, the actual dimensions of the compressor disc are considered for the design in the next chapter.
Dimensions of hallow disc
Table 3: Dimensions of the hollow disc Disc dimensions Dimensional range
Bore inner radius (R1) 130 mm
Bore width (h) 40 mm Rim outer radius (R2) 290 mm
Mass of the circular disc with hole
Volume of the hollow disc
V = π * h * (R12 – R22)
= π * (40)*(2902 - 1302) *10-6 = 8.14 mm3
Mass of the hollow disc
M = V * ρ
= 8.14 * (4.1*10-9)* 109 = 34.60 KG
(b)FEM analysis of the general hollow disc
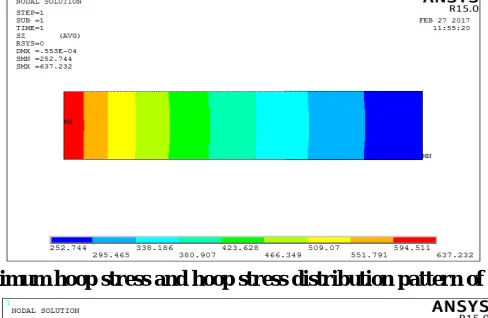
The boundary conditions are given by constraining a node in the hollow in the ‘y’ direction. The inertial load of an angular velocity of 1466.66 radians/sec was given as the load in global ‘y’ direction. The disc is made to rotate perpendicular to the ‘y’ axis. The stress outputs and stress distribution patterns for hoop stress and radial stress values of the hollow cylinder is similar to the regular compressor disc. The following figures 1 and 2 represent the hoop stress patterns and the maximum hoop stress region of the hollow disc which approximately represents the actual compressor disc in the design.
Fig 1: Maximum hoop stress and hoop stress distribution pattern of hollow disc
Fig 3: 3D model of the hollow with disc with hoop stress distribution pattern
Therefore the results obtained from the solver during analysis are valid and matches the theoretical calculations. Since from the above analysis we have found that the magnitude of hoop stress generated in the disc is more than the radial stresses at the same speed, the further analysis will be carried out by considering the hoop stresses. If the design of the disc is safe for hoop stress, then the design will also be safe for the radial stress.
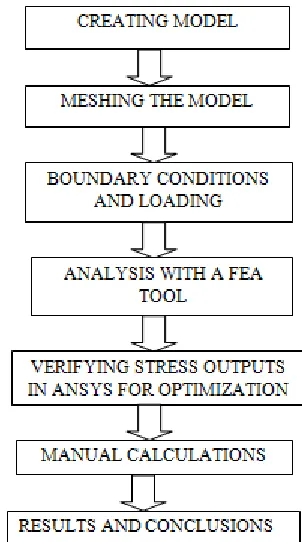
(c)Significant steps in simulation of compressor disc
III. FINITE ELEMENT ANALYSIS OF THE MODEL
(a)Modeling of compressor disc
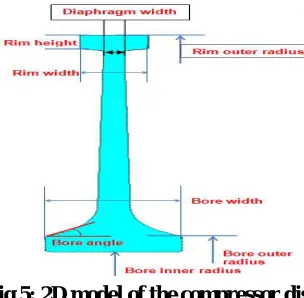
ANSYS 15 APDL tool is used for modeling and optimization is made by stress calculation. The following figure shows a typical 2d model of a compressor disc with labeling.
Fig 5: 2D model of the compressor disc
In pre processing stage, the first step in 2d modeling of the compressor disc is to create the geometric entities like lines and areas in ANSYS 15 APDL tool. The lines and area are created by considering the minimum values of bore inner radius, bore width, bore angle and diaphragm width. Thus by creating lines of the desired geometry the area can be created further.
Dimensions of the disc
The table 4 gives the specifications of the dimensions of the disc and some of the selected dimensions will vary during the analysis for the optimization of the disc.
Table 4: Dimensional range of the disc to model Variable Dimensional parameter Dimensional range
Bore inner radius 135 mm – 145 mm(vary) Rim Outer radius 300 mm
Bore width 30 mm – 40 mm (vary) Bore angle 40° – 45° (vary) Diaphragm width 7 mm – 9 mm (vary) Bore Outer Radius 150 mm Rim Width 20 mm Rim Height 10 mm Rim Angle 10°
(b)Creating lines with minimum dimensional values
Fig 6: Lines creation in ANSYS tool
Fig 7: 2d geometry of the disc(creating area)
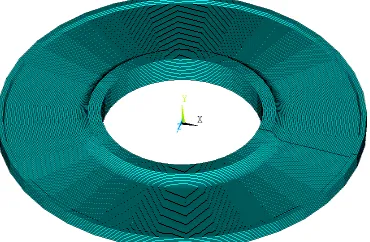
Fig 8: 3D model of the disc.
The 2d model of the disc can be converted into a 3D model by axi-symmetric expansion of the compressor disc. The axi-symmetric expansion is done in the ANSYS 15 APDL tool, the optimization will be carried out with a 2d model of the disc.Since computer only understands the nodes and elements in an FEA tool the meshing is done for analysis. Meshing process in fem is the “conversion of geometric entities like lines, area, volumes into FE entities like nodes and elements”. In the current project meshing is also done in every case during the analysis. Because of the varying dimension of the model at each case, the meshing also must be done at each case. If the mesh density is very fine and size of the element is small, the computational time increases correspondingly. A fine mesh is necessary to get accurate results.
PLANE182 Element
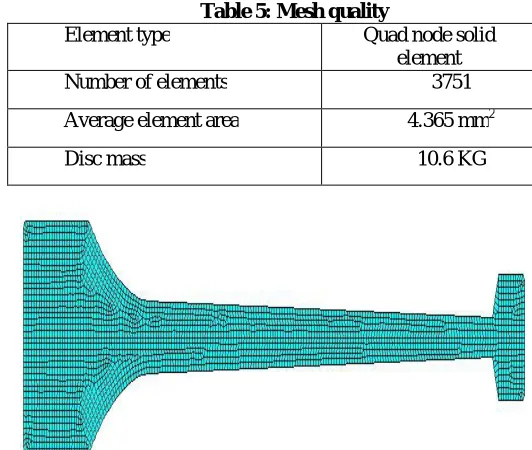
Mesh quality
Table 5: Mesh quality
Element type Quad node solid element Number of elements 3751 Average element area 4.365 mm2 Disc mass 10.6 KG
Fig 9: Meshing of the 2d model of disc. (c)Boundary conditions for the model
The boundary conditions to the model are given by fixing the disc in global ‘y’ direction. The disc is free to expand in other directions. One of the nodes in the disc is being fixed in the Y direction. The disc must be restricted to move in the global Y direction. The major load is acting on the disc is in ‘x’ direction for radial stresses and ‘z’ direction for hoop stress.
Fig 10: Boundary conditions by constraining the node in y direction
The maximum operating temperature of the compressor disc during the operation is, 320° (T). The structural load of 1500 KN/mm2 is the actual load generated due to the high rotational speed of the engine. The rotational speed or the
angular velocity ‘ω’ of the compressor disc is 1518.44 radians/sec. The extra mass which includes the blades on the
disc is important while performing the compressor disc or turbine disc analysis. The overall loads that acts on the disc causes expansion in radial direction as shown in the fig 10.
Coupling and constrain equations
In ANSYS there is an option called coupling and constrain equation to transfer the load to a structure from a remote distance or a remote point by creating a node.
Fig 11: Coupling and constrain equation
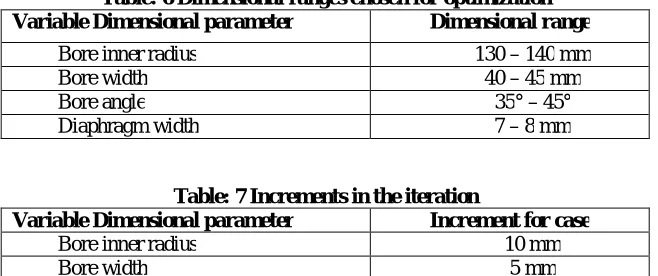
Coupling and constraint equations allow you to relate the motion of one node to another. The coupling and constrain equation option is used to transfer the mechanical lode from a remote point to the actual model. The effect of extra mass of mounted blades on the disc is given to the outer surface of the rim by placing a remote node, by which the effect of the blades to the outer rim of the disc is provided as shown in the fig 11. Thus the total overall loading effect of the blades is equally distributed on the outer rim surface area of the disc. To all the elements on the outer rim surface of the disc, the load of about 1500 KN/mm2 is equally distributed. The chosen design parameters are the circuital design parameters of the disc. The chosen design parameters play a vital role in stress distribution pattern and mass reduction in the compressor disc. The chosen design parameters for shape optimization are “Bore inner radius”, “Bore width”, “Bore angle”, “Diaphragm width”.
Table: 6 Dimensional ranges chosen for optimization Variable Dimensional parameter Dimensional range
Bore inner radius 130 – 140 mm Bore width 40 – 45 mm Bore angle 35° – 45° Diaphragm width 7 – 8 mm
Table: 7 Increments in the iteration
Variable Dimensional parameter Increment for case
Bore inner radius 10 mm Bore width 5 mm Bore angle 10° Diaphragm width 2 mm
To give a jump for change in dimensions for the selected design parameters, the incremental values are provided. The incremental values given for the shape optimization are shown in the table7. The larger incremental values lesser cases for solving and lesser computational time. Smaller the incremental values more the number of cases and more the computational time. But due to the computational time factor, the incremental value was given to maximum difference of each variable dimensional parameter. Thus for every single case, one parameter is varied resulting in sixty four set of combinations for optimization process.
Fig12: Variation of Disc mass with respect to number of cases
The variation of disc mass with respect to the number of cases in all the sixteen cases is as shown in the graph 6.1. Due to the reason that optimization of the compressor disc is done by changing the design parameters which constituted and forms the shape of the disc. The disc mass will be varied during all the cases during analysis, this gives us a chance for selecting the best possible result for optimization.
Fig13: Variation of burst margin with respect to No. of cases
The graph in the graph 13 shows the variation of burst margin in all the case results. The shape of the disc varies constantly during optimization process due to the change in the element numbers in the disc in every case.
0 2 4 6 8 10 12 14 16
1 3 5 7 9 11 13 15
M
as
s
o
f
th
e
d
is
c
in
K
G
Case no
Mass of the disc (vs) Case no
Disc mass/kg -0.1 -0.05 0 0.05 0.1 0.15
1 3 5 7 9 11 13 15
B
u
rst
m
a
rg
in
o
f
th
e
d
isc
Case no
Burst margin (vs)
Case
no
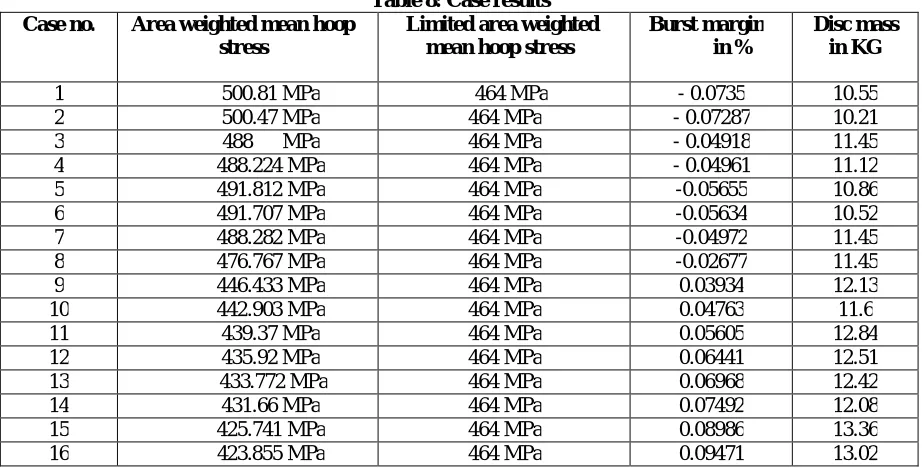
Table 8: Case results Case no. Area weighted mean hoop
stress
Limited area weighted mean hoop stress
Burst margin in %
Disc mass in KG
1 500.81 MPa 464 MPa - 0.0735 10.55 2 500.47 MPa 464 MPa - 0.07287 10.21 3 488 MPa 464 MPa - 0.04918 11.45 4 488.224 MPa 464 MPa - 0.04961 11.12 5 491.812 MPa 464 MPa -0.05655 10.86 6 491.707 MPa 464 MPa -0.05634 10.52 7 488.282 MPa 464 MPa -0.04972 11.45 8 476.767 MPa 464 MPa -0.02677 11.45 9 446.433 MPa 464 MPa 0.03934 12.13 10 442.903 MPa 464 MPa 0.04763 11.6 11 439.37 MPa 464 MPa 0.05605 12.84 12 435.92 MPa 464 MPa 0.06441 12.51 13 433.772 MPa 464 MPa 0.06968 12.42 14 431.66 MPa 464 MPa 0.07492 12.08 15 425.741 MPa 464 MPa 0.08986 13.36 16 423.855 MPa 464 MPa 0.09471 13.02 Optimization is the process of getting satisfied results by taking various design parameters into consideration. Finding an alternative with the most cost effective or highest achievable performance under the given constraints, by maximizing desired factors and minimizing undesired ones. In comparison, maximization means trying to attain the highest or maximum result or outcome without regard to cost or expense. Practice of optimization is restricted by the lack of full information, and the lack of time to evaluate what information is available (see bounded reality for details). In computer simulation (modeling) of business problems, optimization is achieved usually by using linear programming techniques of operations research. In the current project weight reduction of compressor disc is the main objective. The compressor disc should be safe during the critical speed i.e. 125% of maximum rotational speed. The speed should be maintained during the critical working conditions at elevated temperatures. As a result, the optimum result which includes Design parameters like bore width, bore angle, bore inner radius and diaphragm width with better stress distribution patterns to the applied load exists in the design of the compressor disc.
Results for optimization First optimum result
Case no. 10
Table 9: results of Case 10
Generated stress in MPa Limited stress in MPa Disk mass in KG Increment in burst margin
442.903 464 11.6 +0.04763
Second optimum result Case no. 14
Table 10 : results of Case 14
The results for optimization are listed in two optimum results as shown in the above table. The shape optimization is done for the compressor disc for the provided dimensional ranges and material properties. The selection of the best results depends upon the weight reduction and safe design by increase in burst margin values, where the compressor disc can sustain few extra rpm along with critical speed safely without yielding.
IV. CONCLUSIONS AND SCOPE FOR FUTURE WORK
The shape optimization process is very handy in reducing the overall mass of the compressor disc, and the optimization for weight reduction and better efficiency can be carried out to other air craft engine parts as well by FEA method. The process of optimization that is accomplished by FEA method reduces the costs by a great margin coMPared to the experimental work and also promotes for the future works. The sixteen cases give different results for carrying out optimization process of the compressor disc. These stress outputs obtained in the tool also matches the numerical calculations.
The optimized results includes the verification of the safe design of the disc with sufficient burst margin increment, which in turn gives a few extra RPM above for the specified RPM for the critical speed.
The disc can operate safely at a speed of 14005.5 rpm without yielding or getting fractured. Even at a given critical speed of 25% extra RPM than 14005.5 RPM the disc has a sufficient extra burst margin to operate.
The first optimum result has a disc mass of 11.6 KG and +0.04763 extra margin and the second optimum result has a disc mass of 12.08 KG and +0.7492 extra burst margin than the specified critical speed.Scope for the future work
A thermal analysis featuring various temperature ranges and thermal stresses can be done.
Dynamic analysis can be carried out in future.
Fatigue analysis can be done to find endurance.
The CFD analysis can be made by considering the fluid flow through air foils and hot gases influence on the turbine blades can be considered.
More steps by varying other design parameters can be made.
REFERENCES
1. Anton N. Servetnik, “Energy Based Method for Gas Turbine Engine Disc Burst Speed Calculation”, Central Institute of Aviation Motors, Moscow, Russia, ICAS 2012
2. Maruti B H, K M Narayanappa, M Krishna, Venkatarama Reddy, “Modified Disc Model for Over-Speed Burst Margin with Thermal Load And Disc Speed corrections and coMPared with FE model”, IJRTE,ISSN: 2277-3878, Volume-1, Issue-2, June 2012
3. Maruthi B H, M. venkataramana Reddy, k. Chennakeshavalu, “Finite Element Formulation for Prediction of Over-Speed and Burst-Margin Limits in Aero-Engine” Disc,IJSCE, ISSN: 2231-2307, Volume-2, Issue-3, July 2012
4. K. Kumar, Dr. Ajit Prasad. Dr. K. Ramachandra, “Computational Technique for Weight Reduction of Aero-Engine Rotor”.
5. Zhangjun Haung, Chengen Wang, Jian Chen, Hong Tian, “Optimal Design of Aero engine Turbine Disc Based on Kriging Suggorgate Models”, Computers and Structures 89 (2011) 27–37
6. Qi Xiaodonga, Shen Xiulib, “Multidisciplinary Design Optimization of Turbine Discs based On ANSYS Workbench Platforms”, ELSEVIER, APISAT 2014, Procedia Engineering 99 ( 2015 ) 1275 – 1283
7. Abdur Rosyid, Mahir Es-Saheb and Faycal Ben Yahia, “Stress Analysis of Nonhomogeneous Rotating Disc with Arbitrarily Variable Thickness Using Finite Element Method”, Research Journal of Applied Sciences, Engineering and Technology 7(15): 3114-3125, 2014, ISSN: 2040-7459 8. Abhishek S Makunteand Ramesh, “Analysis of Turbine Disc for Creep Life”,IJMERR: 2014, ISSN 2278 – 0149
9. Hongqin Yang, Rui Bao, Lei Peng, Jianyu Zhang, Binjun Fei, “Reliability Analysis for Aero-Engine Turbine Discs With Crack” Paper Ref: S1701_P0314, 20-24 July 2009