A potential space- and power-effective muon sensor module
for imaging a volcano
Hideaki Taira and Hiroyuki K. M. Tanaka
Earthquake Research Institute, University of Tokyo, 1-1-1 Yayoi, Bunkyo, Tokyo 113-0032, Japan
(Received November 30, 2008; Revised June 8, 2009; Accepted June 11, 2009; Online published February 22, 2010)
The application of muon radiography will be greatly enhanced by the use of two muon sensor modules that save electric power consumption and are easily transportable. Muon sensor modules used for a volcano observation must have a low electric power consumption requirement and be both waterproof and portable. In this article, we discuss two candidate sensor modules: (1) a portable muon sensor module with wavelength-shifting (WLS) fibers and a multi-anode photomultiplier tube (MAPMT), and (2) a regular scintillator telescope with PMT complemented by a low-power Cockcroft-Walton circuit (CWPMT). A realistic telescope system consisting of a muon sensor module with MAPMT has been tested and found to consume 76 W, most of which (72 W) is used by the redundant electronic circuit required for pulse shaping; this could be modified to drastically improve the power consumption. In comparison, a muon telescope system with a CWPMT was found to consume 7.57 W. We also calculated the muon stopping length in SiO2 by means of a Monte-Carlo simulation. This calculation provided the average density structure along the muon path in rock, where the muon path length was shorter than 1.5 km, with an accuracy of about 5% during a 90-day measurement period by assuming a 1-m2muon detector with an angular resolution of 25 mrad.
Key words:Cosmic-ray muon, radiography, volcano.
1.
Introduction
For a number of years, researchers have been attempting to image volcanoes (e.g., Tanakaet al., 2003, 2005, 2007a, b, 2008; Tanaka and Yokoyama, 2008), pyramids (e.g., Kinget al., 1999), and contrabands (e.g., Borozdinet al., 2003) radiographically using cosmic-ray muons. Tanakaet al. recently succeeded in visualizing the internal density distribution of volcanoes using this technique, with an ac-curacy in terms spatial resolution that is superior to that pos-sible using conventional geophysical techniques. Observa-tions of volcanoes are challenging because (1) the amount of battery power that can be transported to the system is limited, (2) housing for the telescope system is necessary due to environmental conditions, and (3) the remote and of-ten difficult terrain leading to the observation points require that the unit be easily transportable. These issues were par-ticularly important for the observations performed at Mt. West Iwate and Mt. Asama. Previous observations were performed at a long distance from these volcanoes due to the cumbersome digital sensor system used and the high electrical power requirement of the system. Tanaka et al. overcame these difficulties by using nuclear emulsion pho-tographic films. These films are light and do not require electrical power. Employing this technology, Tanakaet al. obtained radiographic images of the interior density struc-ture of the Mt. Asama (Tanakaet al., 2007a, b, 2008) and
Copyright cThe Society of Geomagnetism and Earth, Planetary and Space Sci-ences (SGEPSS); The Seismological Society of Japan; The Volcanological Society of Japan; The Geodetic Society of Japan; The Japanese Society for Planetary Sci-ences; TERRAPUB.
doi:10.5047/eps.2009.06.005
Mt. Usu (Tanaka and Yokoyama, 2008) volcanoes with high angular resolution and accuracy. Images with such a high resolution can not be achieved using a conventional geo-physical method. The use of nuclear emulsion photographic films for muon observation at volcano was originally im-practical due to the numerous particle tracks that had to be read manually. Nakamuraet al.(2006) developed an auto-matic particle track reading machine to facilitate this proce-dure. The machine had been used in conjunction with the OPERA experiment (Guleret al., 2000) to look at neutrino oscillations and shown to be employable. However, the ma-chine does not enable the interior structure of volcanoes to be observed in real time since the emulsions require analog photographic development. To interpret the dynamics of the volcanic explosion, it is necessary to be able to interpret the variation in the interior density structure of volcanoes over time. For this purpose, we have proposed a new muon sen-sor system which is lightweight and requires less electrical power. This system was developed and used in 2008 for the first time at Mt. Satsuma-iwojima and Mt. Sakurajima (Tanakaet al., 2010). The use of the MAPMT (multi-anode photomultiplier tube) enables the number of PMTs in the system to be reduced and, in addition, the system can be more compact since the counter does not require to be sep-arated into parts. We have also succeeded in developing a new PMT which runs at a lower voltage. As such, the high voltage (HV) supplier can be removed in the field, enabling the full system to be simplified. For this application, we propose that two different types of muon modules be used.
HV power supply (a)
P sci tor
MAPMT Fiber holder
Shift fiber
2cm 2cm
(b)
(c)
Plastic scintillator Shiftft fifi er
MAPMT
Fiber holder
Shift fiber 10cm
BA
C
K
END ELECTRO
NI
CS
+ ANALYSY
S
P
R
OGRAM
MONITORING
SIGNAL
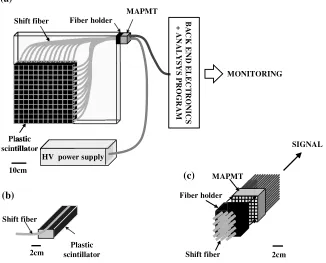
Fig. 1. (a) Point-sensitive portable muon sensor module with MAPMT, (b) shift fiber filled in a 2-mm-diameter gutter, (c) shift fiber is connected to each anode pixel of the MAPMT with a fiber holder.
2.
Experimental
2.1 Detector design2.1.1 Muon sensor module with MAPMT Our
tracking system comprises two modules that can make a two-dimensional (2-D) measurement of the track intersect. Originally, we considered three candidate systems: (1) a gas chamber, (2) a detector consisting of PMTs at the four corners of a plastic scintillator that would measure the ar-rival time from the vertex point of a cosmic ray muon, and (3) a cross-aligned plastic scintillator array to determine the vertex point by determining the coincidence of two signals from two scintillators. However, methods (1) and (2) were associated with the following problems. A gas chamber uti-lizes gas, and a steady gas supply is cumbersome if not difficult at a volcano site. Moreover, the transportation of any system to the observation point is usually difficult, so a wire chamber is not ideal since it is sensitive to vibration. In terms of candidate detector (2), a method of arranging PMTs at four corners of a plastic scintillator leads to a time dependence on the positional accuracy due to the gain drift of the PMTs. Since this method uses the signal height of the PMT as the trigger for timing, the position is influenced by the surrounding temperature changes at the volcano site. For these reasons, we developed a module utilizing a cross-aligned plastic scintillator array, i.e. the third candidate de-tector system. To avoid a large number of PMTs, MAPMTs are used. In a MAPMT, PMTs are combined so that signals can be treated collectively. Furthermore since the module does not need to be separated into units, its construction is more robust and better suited for an outdoor environment. The size of each plastic scintillator is 40 cm (L)×3.4 cm (W)×2 cm (H). The plane contains 12 plastic scintilla-tors arranged along the x andy coordinates like a lattice;
it consists of 144 coincident elements, and its root mean
square (RMS) error of point resolution isX = ±1.0 cm,
Y = ±1.0 cm (Fig. 1(a)). The total area of the plane is
0.16 m2, and the unit weighs about 10 kg. A slot (2 mm
in depth and 2 mm in width) in the plastic scintillator con-tains a wavelength-shifting (WLS) fiber (Fig. 1(b)). This WLS fiber converts purple scintillation light (wavelength
=420 nm) into green light (wavelength=500 nm). This
WLS can transmit light without greatly attenuating it be-cause there is a clad layer outside of the fiber as well as an optical fiber. The end of the fiber is held by a black-colored holder; black silicon rubber is affixed between the fiber and the fiber holder to prevent light leakage. The fiber holder and the MAPMT (HAMAMATSU H8500) are fas-tened together with light shielding tape (Fig. 1(c)). The H8500 MAPMT has 64 anode pixels. While the quantum efficiency of the module is 24% for standard scintillation light (wavelength 420 nm), the quantum efficiency is 14% for light emitted from the WLS fiber (wavelength 500 nm). The quantum efficiency of light emitted by a WLS fiber is therefore 57% compared with the quantum efficiency of the usual scintillation light. The position of a passing muon is
determined by taking measurements at thexandy
coordi-nate signal output from the MAPMT module. The direction of a muon can be determined by combining two muon sen-sor planes and determining the hit position of a muon in each plane.
2.1.2 Muon sensor module with CWPMT One
in-plastic scintillator CWPMT
10cm DC power supply
B
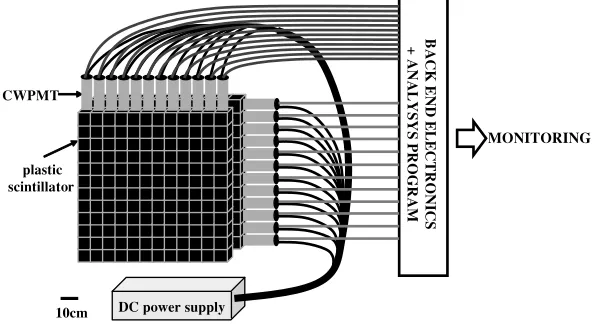
Fig. 2. Point-sensitive muon sensor with CWPMT.
corporating a PMT that can be used with Cockcroft-Walton circuitry (CWPMT). A new model of the module PMT (R7724) with the Cockcroft-Walton circuit has been de-veloped in cooperation with Hamamatsu Photonics. The Cockcroft-Walton circuit is basically a voltage multiplier which converts a low voltage level to a high voltage level. It comprises a multiplier ladder network of capacitors and diodes to generate high voltage. One can obtain a voltage that is about 100-fold higher than the input voltage by con-structing this high voltage generation circuit. This means that a high voltage becomes possible without the need of bringing a HV power supply to the field. Thus, one can sim-plify the system and increase safety at the same time. The point-sensitive muon sensor system with CWPMT is shown
in Fig. 2. A plastic scintillator (100 cm (L)×7 cm (W)×
2 cm (H)) is connected to an Acrylic light guide which is
in turn connected to a PMT. The system is designed to ex-ploit the total reflection of light via the Acrylic light guide. Scintillation light generated in the plastic scintillator is effi-ciently transmitted to the PMT by this method. The weight
of one module (one plastic scintillator+one light guide+
one PMT) is 3.4 kg.
One plane contains 12 plastic scintillators arranged in the
x andycoordinates and has 144 coincidence elements; its
RMS error of point resolution isX = ±2.0 cm, Y =
±2.0 cm (Fig. 2). The arrival direction of a muon can
be determined by combining two muon sensor planes, and determining the position of a muon in each plane.
2.2 Assembly testing
We performed a cosmic-ray muon test observation using the proposed modules. The purpose of the test experiment was to confirm that the two described modules can be used for muon observation. With this goal, we measured the zenith angle distribution of the cosmic-ray muons using each of the two modules and compared the experimental
result to the DEIS experiment result (Allkoferet al., 1981).
In the DEIS experiment, cosmic-ray muon momentum and charge ratio were measured with the DEIS spectrometer. The experiment was performed according to the following procedures.
(1) We observed the analog output signal of each chan-nel of MAPMT and that of CWPMT with the
oscillo-scope, measured the distribution of pulse height, and optimized the discrimination level.
(2) The zenith angle distribution of the cosmic-ray muons measured by each of the new modules proposed in this paper were compared. The experiment using the following procedures. The analog signal output from each PMT channel was the input to a discriminator (KAIZU WORKS KN1300). As a result, the signal changed into a digital signal with the width of a 20-ns pulse and a NIM level. The coincidence of these two signals was taken (TECHNOLAND CORP N-TM 103). Finally, the output was processed by a visual scaler (TECHNOLAND CORP N-OR 425) and calcu-lated as a 1-D histogram.
(3) The zenith angle distribution of cosmic-ray muons was measured as a coincidence of the two planes with MAPMT. The electrical block diagram used in this experiment is shown in Fig. 3. In this experiment, a multiplicity cut (see Tanakaet al., 2001) is used, which means that when there is more than one hit in any of the four planes of the scintillators, the events are dis-carded. The result of this measurement was assessed along with the result of the DEIS experiment. By eval-uating the results of (2) and (3) with the multiplicity cut, we confirmed that a large number of the soft com-ponents were removed using a multiplicity cut. (4) We measured total electric power consumption of
these two muon sensor systems by using power meter (HIOKI 3334 AC/DC POWER HITESTER).
2.3 Result
The results of the experiment are as follows.
(1) The photographs of the pulse distribution output from the MAPMT, CWPMT, and R7724 systems are shown in Fig. 4.
The distribution of the peak of pulse height output from
each channel of MAPMT is shown in Fig. 5. When
#A12 #A1
#B1 #B12
MA
P
M
T
#C12 #C1
#D1 #D12
MA
P
M
T
DI
SCRI
M
IN
A
TO
R
#A1
#A12
#A1
#A2
#A1
#A3
TRIGER
VETO
#A1
#D12 #A2
USER I
N
TE
RF
A
C
E
PC
48
A
B C D
#D11
#D12 #A2
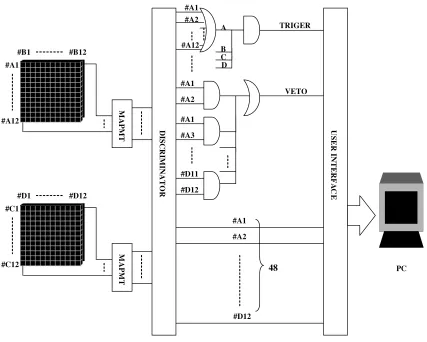
Fig. 3. Electrical block diagram used at the experiment. Signals from #A1 to #D12 are analyzed in the PC, where the difference between the number of #A and #C corresponds to the vertical angle (θ), and the difference between the number of #B and #C corresponds to the horizontal angle (ϕ).
(a) (b) (c)
2ns, 50mV 5ns, 1V 5ns, 1V
Fig. 4. Pulse outputs from MAPMT (a), CWPMT (b), and R7724 (c).
was 15 ns. As a result, the signal from the CWPMT is eas-ier to discriminate than that from the MAPMT. Based on the result of the distribution of the pulse height, we deter-mined the discrimination level to be 25 mV for MAPMT and 80 mV for CWPMT.
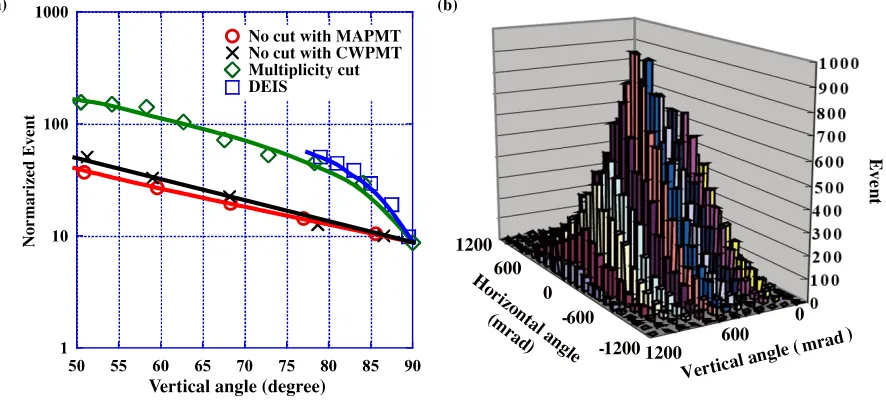
(2) The muon intensity was measured using the two muon sensor planes proposed in this paper as a function of vertical angles (Fig. 6(b)). The measured muon
in-tensity was adjusted so that the inin-tensity atθ = 90◦
corresponded to that from the DEIS result.
(3) The muon spectrum measured with MAPMT is shown in Fig. 6(a). Figure 6(b) shows the 2-D histogram resulting from the observation. In this experiment,
we used the comparator developed by Uchida et al.
(2010); however, the pulse width is so short that the comparator was unable to discriminate the signal. To solve this issue, we placed a discriminator (KAIZU WORKS KN1300) between the modules and the com-parator.
(4) We confirmed that the total power consumption of the muon sensor system with the MAPMT was 76 W, with the discriminator consuming 72 W of electri-cal power. We confirmed that the DC power supply consumed 3.25 W and that the CWPMT consumed 0.09 W when the CWPMT was supplied with 5 V of electrical power. Thus, the total power consump-tion of the muon sensor system with the CWPMT was
-100 -90 -80 -70 -60 -50 -40 -30 -20 -10 00
Pulse height (mV) Pulse height (mV)
Fig. 5. Distribution of pulse height outputted from each channel of two muon sensor modules with MAPMT.
Normarized Ev
No cut with MAPMT No cut with CWPMT Multiplicity cut DEIS
Fig. 6. (a)shows the muon intensity with MAPMT,×shows the muon intensity with CWPMT,3shows the intensity flux with multiplicity cut. The measured muon intensities are adjusted so that the intensities atθ=90◦correspond to that from the DEIS result(). (b) Detection efficiency of the muon sensor with MAPMT as a function of azimuth and zenith. The detection efficiency is a convolution of those from the zenith angular dependence of cosmic-ray muons and from the geometrical structure of the detector.
3.
Discussion
The results of these experiments have provided valuable information on important properties of the proposed candi-date muon sensor modules which will improve future inves-tigations.
The properties of the muon sensor module with MAPMT are:
(1) it is possible to make it waterproof due to its mechani-cal compact arrangement;
(2) the module is easy to assemble due to a decreased number of MAPMT inside the system;
(3) the unit price for each channel is less expensive than in earlier versions of the module. The high consumption of electrical power, 76 W, in this system is due to the use of a discriminator to lengthen the pulse width from the module. The present discriminator consumes 1.5 W/channel. In general, a high-speed amplifier and pulse shaper are not power effective, and their cost per channel is higher. We consider that one way to reduce the power consumption would be to employ a
unit consisting of a fast comparator and a FPGA (field-programmable gate array) to modify the pulse height and the pulse width. We expect that the power required for the operation will be less than 100 mW/channel.
This module can potentially be miniaturized, is lightweight, and the unit price per channel is low. In ad-dition, the modules can adapt to the constraints determined by the installation location. For example, we can poten-tially place the modules at several locations surrounding a volcano and produce 3-D radiographic images of the inte-rior density structure of the volcanoes. One disadvantage of this approach is that if one MAPMT breaks, it is not possi-ble to continue receiving data.
The muon sensor module using CWPMT combined with a Cockcroft-Walton circuit has the following advantages,
(1) Since the PMTs are separated, even if one or more PMT breaks down, it is possible to continue making observations.
0.01 0.02 0.03 0.04 0.05 0.06 0.07 0.08 0.09 0.1 0
500 1000 1500 2000 2500 3000 3500 4000 4500
SiO =500m2 3
RMS = 0.0256
0.01 0.02 0.03 0.04 0.05 0.06 0.07 0.08 0.09 0.1 0
200 400 600 800 1000 1200 1400 1600 1800
SiO =1000m2 3
RMS = 0.0219
0.01 0.02 0.03 0.04 0.05 0.06 0.07 0.08 0.09 0.1 0
100 200 300 400 500 600
700 SiO =1500m2
3
RMS = 0.0204
Ev
ent
Scattering angle (rad)
Scattering angle (rad) Scattering angle (rad)
(a) (b) (c)
Fig. 7. Distribution of muon scatter angle after passing through (a) 500 m SiO2, (b) 1,000 m SiO2, (c) 1,500 m SiO2, where the arrival angle of the muon is 80◦and the density of SiO2is 2 g/cm3.
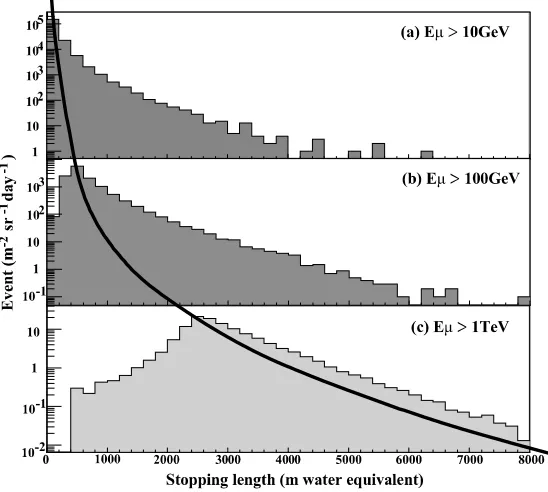
Fig. 8. Stopping distribution of incident muons at arriving angle ofθ=80◦with energy above (a) 10 GeV, (b) 100 GeV, (c) 1 TeV.
It is necessary to determine the best distance between two modules if we wish to set up the modules proposed in this paper at a volcano. To this end, we calculated the scattering angle of the muon through an object (SiO2) using a
Monte-Carlo simulation. This calculation enabled us to obtain the measurement of the angle resolution utilized in the image of the interior density structure of a volcano. We performed the simulation using the following procedures.
(1) We fitted the muon spectrum from the DEIS experi-ment to the following formula (Matsunoet al., 1984).
NμEμ, θ∗dEμ=AWμEμ+Eμ−γ
·
rπγ−1Bπsecθ∗ Eμ+Eμ+Bπsecθ∗
+0.36br
rKγ−1BKsecθ∗
Eμ+Eμ+BKsecθ∗
dEμ
(1)
whereWμ is the muon survival probability. The ratio of the muon momentum to the momentum of the par-ent pion (rπ) is 0.78, and the parent Kaon (rK) has a
ratio of 0.52. The decay length of the mesons that have
an energy ofBπ =90 GeV andBK =442 GeV
corre-sponds to the thickness of the atmospheric layer. The branching ratio of theKμ2 decay mode isbr =0.635,
andEμ is the muon energy loss in the atmosphere
from the top to sea level. The factorγ is the power
index of the primary cosmic-ray spectrum. We
deter-mined the unknown parameters of A,γ, andEμ by
fitting the results of the DEIS experiment to the for-mula.
(2) We generated random numbers, and using these
num-bers, we generated muons (θ = 80◦) adapted to the
energy distribution obtained by Eq. (1).
(3) We injected the generated muons into SiO2 (ρ =
2 g/cm3) with a thickness of 500, 1000, and 1500 m,
and calculated the physical process in SiO2. Physical
Event
0 100 200 300 400 500 5000 10000 15000
Horizontal distance (m) 0
Altitude (m)
1100
1000
900
800
700
600
500
(a) (b)
(c)
100 200 300 400 500 600 700 800 900 1000 1100
20 50 100 200 400 600 800 1000(m) A
A
B
B
Fig. 9. (a) Topographic map of Mt. Sakurajima, (b) Cross-section diagram of Mt. Sakurajima, and (c) radiographic image of Mt. Sakurajima obtained from a Monte-Carlo simulation where the plastic scintillator size is 1 m2and the measurement period is 90 days.
with GEANT4: a toolkit for simulating the passage of particles through matter (Agostinelliet al., 2003). (4) We calculated the change in the muon angle after they
had passed through SiO2. The result of this simulation is shown in Fig. 7 as a 1-D histogram.
As shown in Fig. 7, the averages of the muon scatter-ing angle were 15, 13, and 12 mrad, and the RMS errors of the muon scattering angle were 26, 22, 20 mrad, respec-tively. The energy spectrum of cosmic-ray muons obeys a power low. The mean energy of the muon that penetrates through a thin material is low; in contrast, the mean energy of the muon that penetrates through a thicker material is higher. Therefore, the scattering angle of muons becomes larger when the material becomes thinner. We calculated the muon scattering angle forθ = 70◦ andθ = 75◦ and found that these results were almost the same as that for θ = 80◦. As a result, the distance between planes with MAPMT should be 2.2 m or less, and the distance between modules with CWPMT should be 4.7 m or less. The dis-tance of 2.2 and 4.7 m corresponds to maximum angular errors of about 15 mrad, which is the typical scattering an-gles of muons after passing through the rock. Increasing the distance would only decrease the statistics of detected muons. We next examined the potential of these modules to produce an image of the interior structure of the Sakurajima volcano using a Monte-Carlo simulation. In these calcula-tions, we assumed that the muon sensor would be installed at the point shown in Fig. 9(a) where electricity is available. Under this assumption, the following procedures were per-formed.
(1) 3-D information from the topographical map (with a scale of 1 to 25000 provided by Geographical Survey Institute) and the result measured by airborne laser scanner (Fig. 9(b)) (Sasakiet al., 2003) were used to obtain a 2-D map, including the path length in the direction ofθandϕ, as seen from the muon sensor. (2) By generating random numbers, we generated a muon
spectrum according to the energy distribution obtained by Eq. (1).
(3) The stopping length of the muons in SiO2 was calcu-lated using Geant4, and a table was constructed to rep-resent the data. For example, the stopping distribution of incident muons at an arrival angle ofθ =80◦with energy above 10 GeV, 100 GeV, and 1 TeV is shown in Fig. 8.
(4) By using the result of (2) and (3), we calculated the number of detected muons during a 90-day measure-ment period by assuming a 1-m2 muon detector with an angular resolution of 25 mrad. The result is shown in Fig. 9(c).
4.
Conclusion
We confirmed that the total power consumption of the
muon sensor system with MAPMT is about 76 W and that of the muon sensor system with CWPMT is about 7.57 W. The Monte-Carlo simulations using GEANT4 revealed that the limit of the angular resolution is about 15 mrad. We also confirmed that we can determine the average density structure along the muon path in Mt. Sakurajima where the muon path length is shorter than 1.5 km (550 m below the summit of Sakurajima) with an accuracy of about 5% during a 90-day trial, assuming a 1-m2muon detector with an angular resolution of 25 mrad.
Acknowledgments. Special funding arrangements by S. Okubo, K. Nakatsuka and associated individuals of the ERI, JSPS (Japanese Society of Promotion of Science), and JST (Japan Sci-ence and Technology Agency) are acknowledged. M. Takeo and T. Koyaguchi of ERI, K. Nagamine of UCR, I. Yokoyama, M.J.A. H. Imabeppu, Y. Yamashina, and H. Kawakatsu are also acknowl-edged for their valuable suggestions. We acknowledge S. Steiger-wald for her proof reading of this manuscript. This work ben-efited greatly from useful comments by two reviewers of this manuscript.
References
Agostinelli, S., J. Allison, K. Amako, J. Apostolakis, H. Araujo, P. Arce, M. Asai, D. Axen, S. Banerjee, G. Barrandet al., GEANT4-a simulation toolkit,Nucl. Inst. Methods A.,506, 250–303, 2003.
Alkofer, O. C., K. Carstensen, G. Bella, W. D. Dau, H. Jokisch, G. Klemke, Y. Oren, and R. C. Uhr,Proc. of 17th Cosmic Ray Conf.,10, 321–324, 1981.
Borozdin, K., G. Hogan, C. Morris, W. Priedhorsky, A. Saunders, L. Schultz, and M. Teasdale, Radiographic image with cosmic-ray muons,
Nature,422, 277, 2003.
Guler, M.et al., OPERA Collaboration, Experiment proposal, CERN-SPSC-2000-028, CERN-SPSC-P-318, LNGS-P25-00, July 10, 2000. King, N. S. P., E. Ables, K. Adams, K. R. Alrick, J. F. Amann, S. Balzar,
P. D. Barnes, M. L. Crow, S. B. Cushing, J. C. Eddlemanet al., An 800-MeV proton radiography facility for dynamic experiments,Nucl. Instr. Methods A,424, 84–91, 1999.
Matsuno, S., F. Kajino, Y. Kawashima, T. Kitamura, K. Mitsui, Y. Muraki, Y. Ohashi, A. Okada, and T. Suda, Cosmic-ray muon spectrum up to 20 TeV at 89◦zenith angle,Phys. Rev. D,29, 1–23, 1984.
Nakamura, T., A. Ariga, T. Ban, T. Fukuda, T. Fukuda, T. Fujioka, T.
Furukawa, K. Hamada, H. Hayashi, S. Hiramatsuet al., The OPERA
film: New nuclear emulsion for large-scale, high-precision experiments,
Nucl. Instr. Methods A,556, 80–86, 2006.
Sasaki, H., S. Mukoyama, C. Inaba, and M. Oda, Measurement of the southern active crater of Sakurajima volcano by airborne laser scanner,
Programme and abstracts the Volcanological Society of Japan,2003, 174, 2003.
Tanaka, H. K. M. and I. Yokoyama, Muon radiography and deforma-tion analysis of the lava dome formed by the 1944 erupdeforma-tion of Usu, Hokkaido: Contact between high-energy physics and volcano physics,
Proc. Jpn. Acd., Ser B,84, 107–116, 2008.
Tanaka, H. K. M., K. Nagamine, N. Kawamura, S. N. Nakamura, K. Ishida, and K. Shimomura, Development of the cosmic-ray muon detection system for probing internal-structure of a volcano,Hyperfine Interact.,
138, 521–526, 2001.
Tanaka, H., K. Nagamine, N. Kwamura, S. N. Nakamura, K. Ishida, and K. Shimomura, Development of a two-fold segmented detection system for near horizontally cosmic-ray muons to probe the internal structure of a volcano,Nucl. Instr. Methods A,507, 657–669, 2003.
Tanaka, H. K. M., K. Nagamine, S. N. Nakamura, and K. Ishida, Radio-graphic measurements of the internal structure of Mt. West Iwate with near-horizontal cosmic-ray muons and future developments,Nucl. Instr. Methods A,555, 164–172, 2005.
Tanaka, H. K. M., T. Nakano, S. Takahashi, J. Yoshida, and K. Niwa, De-velopment of an emulsion imaging system for cosmic-ray muon radio-graphy to explore the internal structure of a volcano, Mt. Asam,Nucl. Instr. Methods A,575, 489–497, 2007a.
Tanaka, H. K. M., T. Nakano, S. Takahashi, J. Yoshida, M. Takeo, J. Oikawa, T. Ohminato, Y. Aoki, E. Koyama, H. Tsuji, and K. Niwa, High resolution imaging in the inhomogeneous crust with cosmic-ray muon radiography: The density structure below the volcanic craterfloor of Mt. Asama, Japan,Earth Planet. Sci. Lett.,263, 104–113, 2007b. Tanaka, H. K. M., T. Nakano, S. Takahashi, J. Yoshida, M. Takeo, J.
Oikawa, T. Ohminato, Y. Aoki, E. Koyama, H. Tsuji, H. Ohshima, T. Maekawa, H. Watanabe, and K. Niwa, Radiographic imaging below a volcanic craterfloor with cosmic-ray muons,Am. J. Sci.,308, 843–850, 2008.
Tanaka, H. K. M., T. Uchida, M. Tanaka, H. Shinohara, and H. Taira, Development of a portable assembly-type cosmic-ray muon module for measuring the density structure of a column of magma,Earth Planets Space,62, this issue, 119–129, 2010.
Uchida, T., H. K. M. Tanaka, and M. Tanaka, Development of a muon radiographic imaging electronic board system for a stable solar power operation,Earth Planets Space,62, this issue, 167–172, 2010.