Source model of the 2007 Noto-Hanto earthquake (
M
w6.7) for estimating
broad-band strong ground motion
Susumu Kurahashi1, Kazuaki Masaki2, and Kojiro Irikura3
1Graduate School of Engineering, Aichi Institute of Technology 2Faculty of Engineering, Aichi Institute of Technology 3Disaster Prevention Research Center, Aichi Institute of Technology
(Received July 2, 2007; Revised November 13, 2007; Accepted November 22, 2007; Online published February 19, 2008)
A source model for estimating broad-band ground motions from the 2007 Noto-Hanto earthquake (Mw6.7)
is estimated from a comparison of the observed records of the mainshock and synthesized motions based on the characterized asperity model using the empirical Green’s function method. The observed records of aftershocks used as the empirical Green’s functions are carefully selected to have almost the same radiation characteristics and source distance as the asperities of the mainshock. The best-fit source model consists of two asperities of different size. A large one is located just above the hypocenter, with an area of 6.3×6.3 km2 and stress drop of about 26 MPa. A smaller one is located north-east of the large one, with an area of 3.6×3.6 km2and stress
drop of about 10 MPa. The stress drop of the large one is about twofold higher than the average values of inland crustal earthquakes so far estimated, while that of smaller one is almost average. We found that the remarkable directivity pulses from the source model struck the northern part of the Noto peninsula, causing heavy damage in some towns there.
Key words: Broad-band strong ground motion, empirical Green’s function method, 2007 Noto-Hanto
earth-quake, selection of aftershock records as EGF, source model.
1.
Introduction
The 2007 Noto-Hanto earthquake (Mw=6.7) at 9:41:58
(JST) on March 25, 2007 occurred west off the Noto penin-sula, Japan. Strong ground motions with a Japan Me-teorological Agency (JMA) seismic intensity of 6-upper struck Wajima, Anamizu, and Nanao in the northern part of the Noto peninsula, causing one death, about 300 col-lapsed houses and about 2000 partially destroyed houses (Fire and Disaster Management Agency, 2007). Accord-ing to Centroid moment tensor (CMT) solutions of National Research Institute for Earth Science and Disaster Preven-tion (NIED), this earthquake has a compressional axis on the strike of 58◦, reverse fault with 66◦ and rake angle of 132◦ (NIED, 2007). The distributions of aftershocks in-dicate that the main fault should be about 25–30 km long and 10–15 km wide (Earthquake Research Institute, 2007). The projections of aftershocks on the cross-sections imply that the fault inclination is almost consistent to the CMT solutions. The earthquake fault was associated with known active faults just off the west shore of the northern part of the Noto peninsula (Katagawaet al., 2005). This fault dips beneath the Noto peninsula, which is consistent to the after-shock distributions and the CMT solutions. This might be one of reasons why the damaged areas extended widely over the northern Noto peninsula, which is located on the hang-ing wall side of the fault. Another reason might be related to
Copyright cThe Society of Geomagnetism and Earth, Planetary and Space Sci-ences (SGEPSS); The Seismological Society of Japan; The Volcanological Society of Japan; The Geodetic Society of Japan; The Japanese Society for Planetary Sci-ences; TERRAPUB.
the rupture process of this earthquake, such as directivity ef-fects. The source models for estimating broad-band ground motions from large inland crustal earthquakes to date were successfully estimated from a comparison between the ob-served and synthesized ones based on the characterized as-perity model using the empirical Green’s function method (e.g. Kamae and Irikura, 1998; Miyakeet al., 2003). The strong motion generation areas are found to coincide ap-proximately with asperity areas, where a lot of stress is re-leased. In this paper, we attempt to examine whether the above relations are available for modeling the rupture pro-cess of the 2007 Noto-Hanto earthquake. It is one of the most important issues associated with increasing the relia-bility of strong motion prediction and risk assessment for future large earthquakes.
2.
Ground Motion Data
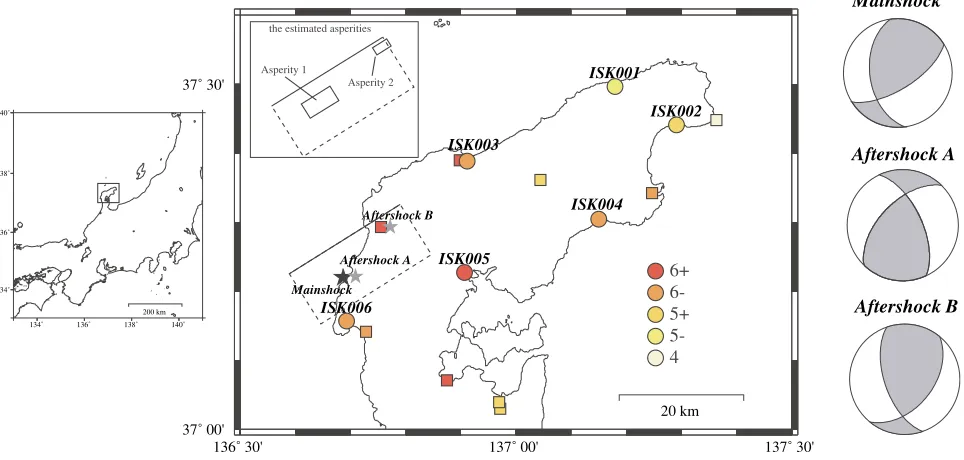
We used strong motion data at six observation stations of K-NET installed by NIED (ISK001, ISK002, ISK003, ISK004, ISK005 and ISK006) in the northern region of the Noto peninsula. The locations of the K-NET stations are shown in Fig. 1, together with the mainshock and two af-tershocks used for analysis, respectively. The seismic mo-ments and focal mechanisms of the mainshock and after-shocks were determined from the F-net by NIED (NIED, 2007). The source area of each aftershock is estimated from the corner frequency of the source spectrum calcu-lated using the records of the aftershock. The stress drop of the aftershock is inferred from the seismic moment and source area of it. The source parameters mentioned above
20 km
Mainshock
Aftershock B
Aftershock A
ISK001
ISK002
ISK003
ISK004
ISK005
ISK006
6+ 6-5+ 5-4
200 km
the estimated asperities
Asperity 1
Asperity 2
Mainshock
Aftershock A
Aftershock B
Fig. 1. Map showing the location of stations used for analysis (circle), the other stations (square) and epicenters of the mainshock and aftershocks (star). The JMA seismic intensity in each station is plotted with color markings. The focal mechanisms of the mainshock and aftershocks by F-net (NIED, 2007) are shown in the right.
Table 1. The source parameters of the mainshock, Aftershock A and Aftershock B. Fault area and stress drop of the aftershocks are noted for those before and after the grid search.
Mainshock Aftershock A Aftershock B Origin time (JST) 2007/3/25 09:42 2007/3/28 08:08 2007/3/25 15:43
Latitude (◦)∗ 37.221 37.222 37.294
Longitude (◦)∗ 136.686 136.709 136.772
Depth (km)∗ 10.7 13.3 8.9
Mw∗∗ 6.6 4.6 4.0
Strike (◦)∗∗ 58/173 335/225 161/40
Dip (◦)∗∗ 66/48 62/56 60/48
Rake (◦)∗∗ 132/34 39/146 51/137
Seismic moment (N*m)∗∗ 1.36×10¹⁹ 1.03×10¹⁶ 1.25×10¹⁵
Fault area (km2) (before the grid search) — 2.2 1.0
Stress drop (MPa) (before the grid search) — 7.6 3.0
Fault area (km2) (after the grid search) — — 0.81
Stress drop (MPa) (after search model) — — 4.1
∗estimated by JMA,∗∗estimated by F-net.
are shown in Table 1. The analyzed range of frequency was from 0.2 to 10 Hz.
3.
Selection of Aftershock Records as Empirical
Green’s Functions
Some records from aftershocks within the source area of the mainshock have been obtained. The conditions for the aftershock records usable as the empirical Green’s func-tions are as follows: (1) the hypocenter of the aftershock should be near the asperity of the mainshock; (2) the ra-diation characteristics of the aftershock should be similar to the mainshock. The first condition is required to assure that the propagation-path effects of the aftershock are ap-proximately the same as that of the mainshock. The second condition does not always mean that the source mechanism of the aftershock is the same as that of the mainshock. If theSwave is dominant in observed records, the differences
in the amplitude characteristic are correctable between the mechanism of the aftershock and that of the mainshock as long as the radiation from the aftershock is not nodal. In this study, we consider that the S wave was dominant in the observed records, because the records obtained were for a short distance from the source area. An aftershock (Mw
4.6, hereafter called Aftershock A) at 8:08 on March 28, 2007 occurred very near the hypocenter of the mainshock. However, the focal mechanism of this aftershock was rather different from that of the mainshock. Another aftershock (Mw = 4.0, hereafter called Aftershock B) at 15:43 on
07/ 03/ 25 15:43
106 Aftershock A Aftershock B
Fig. 2. The displacement source spectra of Aftershock A (left) and Aftershock B (right) estimated by observed records at six stations.
propagation-path and site effects from the observed spec-trum at each station. The site effect at each station is em-pirically calculated, assuming that the source spectrum is given by theω−2 model and the propagation-path effect is
estimated by frequency-dependentQin propagation media (Tsurugiet al., 1997). We know that the radiation charac-teristics at low frequencies less than 1 Hz are sensitive to the focal mechanisms, but those at high frequencies are insensi-tive to the mechanisms because radiation characteristics are smoothed in space due to scattering effects in propagation-path (Kamaeet al., 1990). The displacement source spectra of Aftershock A at the stations have almost the same level in low frequencies between 0.5 and 1.0 Hz except ISK006, as shown in the right of Fig. 2. The spectral level of ISK006 is clearly lower at the low frequencies, suggesting that ISK006 is located around the nodal direction of theS wave radia-tion pattern. ISK006 is one of the most important points in determining the source model. It is located at the near-est station to the fault plane of the mainshock as well as southward different from other stations that are eastward from the asperity of the mainshock. Therefore, we consider that the observed records of this aftershock are not appro-priate for simulating the mainshock motion using the EGF method. On the other hand, the displacement source spec-tra of Aftershock B at ISK006 have almost the same levels as those at ISK001, ISK002, ISK003. However, ISK004 and ISK005 have clearly a lower spectral level, as shown in the left of Fig. 2. Therefore, we used the observed records of Aftershock B as EGF for ISK001, ISK002, ISK003 and ISK006, and those of Aftershock A as EGF for ISK004 and ISK005.
4.
Source Models and Synthesized Motions
4.1 Procedure
Source models of the mainshock have already been studied from the waveform inversions using teleseismic data and strong motion data by many authors (Aoi and Sekiguchi, 2007; Horikawa, 2007; Yamanaka, 2007). Al-most all of these models are available for low-frequency data less than 1 Hz. Our purpose is to construct the source model for broad-band ground motions from 0.2 to 10 Hz, which is of engineering interest.
The procedure determining the source model for broad-band motions is as follows: (1) Calculate scale parameter
N and stress drop ratioC from the spectral ratioC N3 at
low frequencies andC Nat high frequencies between main-shock and aftermain-shock following Irikura (1986). Generally, the source area of the mainshock is divided into N ×N meshes, and the mesh size(x)×(w)is determined by the source area of the aftershock whose records are used as the empirical Green’s functions. Other parameters neces-sary for estimating ground motions from the mainshock are given as initial values from the empirical information. (2) Infer the number of asperities and their areas. For a single asperity model, the source area of the mainshock in (1) is replaced by that of the asperity, assuming that most of the ground motions are generated from the asperity. Then, the area of the asperity is estimated to be(Nx)×(Nw). For a multi-asperity model, the source area of the mainshock has to be replaced by the combined areas of asperities. (3) Evaluate the agreement between the observed and synthe-sizes motions. Its fitting function is adopted the sum of residuals for the displacement waveforms from and resid-uals for acceleration envelopes (Miyakeet al., 1999) as fol-lows.
whereuobs andusyn are the observed and the synthesized
displacement waveforms, andaenv,obsandaenv,synare the
ob-served and synthesized acceleration envelopes. The weights of the residual are equal for displacement waveforms and acceleration envelopes following Miyakeet al.(1999). The best-fit model is given from the minimum of the fitting func-tion.
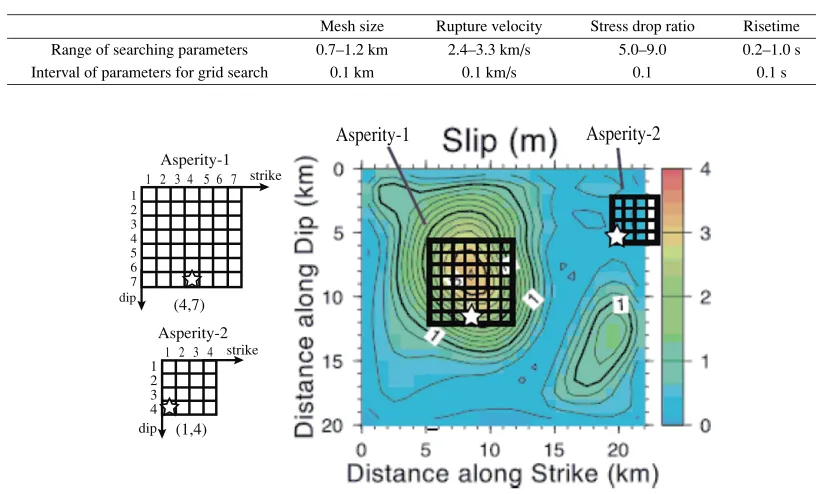
as-Table 2. The range and interval of searching parameters for the grid search.
Mesh size Rupture velocity Stress drop ratio Risetime Range of searching parameters 0.7–1.2 km 2.4–3.3 km/s 5.0–9.0 0.2–1.0 s Interval of parameters for grid search 0.1 km 0.1 km/s 0.1 0.1 s
1
Fig. 3. Source model consisting of two asperities from forward modeling using the empirical Green’s function method. Our asperity model is superimposed on the inverted slip model of Horikawa (2007). The open stars mean rupture start point.
perity area is the product ofN2and the area of the mesh
co-inciding with the area of the aftershock. Fitting between the observed and synthesized waveforms at a single station has a trade-off between the asperity size and rupture velocity. The stress drop on the asperity is the product of the stress drop ratioCand the stress drop of the aftershock. The stress drop of the aftershock is estimated by the seismic moment and source area of the aftershock. Therefore, we more care-fully discuss the source model, making the grid search as a parameter of the aftershock source area (coinciding with the mesh size), rupture velocity andC from a comparison between the observed and synthesized motions at ISK001, ISK002, ISK003 and ISK006 using the observed records of Aftershock B. The risetime as relatively insensitive pa-rameters was re-estimated after the above papa-rameters were determined. The range and interval of searching parameters for grid search are summarized in Table 2.
4.2 Result
First, we assume a single asperity model (Asperity-1) learning from the slip distribution determined using low-frequency components of strong motion data by Horikawa (2007). He carefully allocated the hypocenter and fault plane of the mainshock from the mainshock and aftershock distributions manually determined from the JMA unified data. The best-fit source model is shown in Fig. 3. The source parameters of Asperity-1 are shown in Table 3.
The scale parameterNand stress dropCwere estimated to be 7 and 6.0 as an initial model from the spectral ratio between the mainshock and aftershock, respectively. The bestCis estimated to be 6.3 by the grid search, keepingN constant. The length, width, risetime, and rupture velocity were determined to be 6.3 km, 6.3 km, 0.7 s, and 3.1 km/s, respectively. The rupture starting point was estimated(4,7) as shown in the left upper of Fig. 3. Seismic moment
Table 3. The source parameters for each asperity.
Mo(N*m) L(km)×W(km) σ(MPa) Asperity-1 2.7×10¹⁸ 6.3×6.3 25.8 Asperity-2 2.0×10¹⁷ 3.6×3.6 10.3
and stress drop were estimated to be 2.70 ×10¹⁸ N*m,
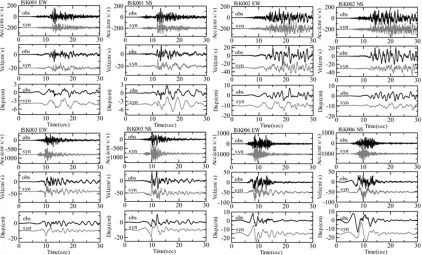
25.8 MPa, respectively. We found that the location and area of the asperity were similar to the large slip area by Horikawa (2007). The synthesized motions at the ISK001, ISK002, ISK003, and ISK006 stations are compared with observed ones in Fig. 4. The synthesized waveforms agree well with the observed ones especially in directivity pulses appearing in velocity and displacement waveforms.
Fig. 4. Comparison between the synthesized and the observed motions at ISK001, ISK002, ISK003 and ISK006. The synthetics were made using a single asperity model (Asperity-1).
Fig. 5. Comparison between the synthesized and the observed motions at ISK001 and ISK003. The synthetics were made using two-asperities model (Asperity-1 and 2).
Fig. 6. Comparison between the synthesized and observed motion at ISK004 and ISK005. The synthetics were made using the two-asperities model (Asperity-1 and 2). The syn A and the syn B show the synthesized waveforms using Aftershock A and Aftershock B, respectively.
(Asperity-1 and Asperity-2), as shown in Fig. 3. Asperity-2 is located about 12 km northeast from the hypocenter. The asperity size, seismic moment, and stress drop are 13 km2,
2.0×10¹⁷ N*m, 10.3 MPa, respectively. The synthesized
residual of the velocity is improved from 2.02 to 1.37 by adding the Asperity-2.
5.
Discussion and Conclusions
We confirmed that the source model, i.e. two-asperities model, obtained above is suitable for the simulation of ground motions at other sites. We found that the observed records of Aftershock B at ISK004 and ISK005 were not appropriate for the empirical Green’s functions because the radiation characteristics to both stations are relatively small compared with those to the other stations, suggesting that they are located around nodal direction. Then, we used the observed records of Aftershock A as the empirical Green’s functions for estimating the ground motions at ISK004 and ISK005. The source model with the same asperity size and stress drop is adopted to synthesize the ground motions from the mainshock. Comparison between the synthesized motions and observed motions at ISK004 and ISK005 is shown in Fig. 6. The synthesized displacement using After-shock B as EGF were underestimated in comparison with those using Aftershock A as EGF. This is consistent to the fact that ISK004 and ISK005 are located in the nodal direc-tion, as shown in Fig. 2.
We consider that the amplitude and duration of synthe-sized displacement waveforms at ISK005 were similar to those of observed ones although the synthesized waveforms did not completely agree with the observed ones in individ-ual phases. However, the synthesized acceleration and ve-locity were clearly overestimated. The station is underlain by very soft deposits with a thickness of about 10 m, sug-gesting that ground motions at this station are influenced by non-linear effects of soils near surface. On the other hand, the synthesized velocity and displacement waveforms at ISK004 do not agree well with those of observed ones, although the synthesized acceleration motions there fit the observed ones. The observed records at ISK004 might have some troubles in low frequency components.
In conclusion, our analysis shows that the source model for broad-band strong ground motions is obtained using the empirical Green’s function method as long as the selection of the small event records is carefully made taking into ac-count the radiation characteristics of the events. We con-firmed that the strong motion generation areas estimated in this study coincide with the asperity area estimated from the slip model using strong motions data by Horikawa (2007).
Acknowledgments. We used the wave data provided by the K-NET of National Research Institute for Earth Science and Disas-ter Prevention (NIED). We also used the hypocentral information from JMA, and the moment tensor solution from the F-net (NIED). We are very grateful to Dr. Y. Fukuyama and the anonymous re-viewer for reviewing the manuscript and providing valuable com-ments. Some figures were made using the GMT plotting package (Wessel and Smith, 1998).
References
Aoi, S. and H. Sekiguchi, Rupture process of the 2007 Noto-Hanto earth-quake obtained from strong motion data, http://www.k-net.bosai.go.jp/ k-net/topics/noto070325/, 2007 (in Japanese).
Earthquake Research Institute, The University of Tokyo, The Noto Hanto Earthquake in 2007, http://www.eri.u-tokyo.ac.jp/topics/noto20070325/ yochiren/coco.html, 2007 (in Japanese).
Fire and Disaster Management Agency, On March 25, 2007 Noto-Hanto Earthquake, http://www.fdma.go.jp/detail/710.html, 2007 (in Japanese). Horikawa, H., Source rupture process of 2007 Noto-Hanto Earthquake, http://unit.aist.go.jp/actfault/katsudo/jishin/notohanto/hakaikatei2.html, 2007 (in Japanese).
Irikura, K., Prediction of strong acceleration motions using empirical Green’s function,Proc. 7th Japan Earthq. Eng. Symp., 151–156, 1986. Kamae, K. and K. Irikura, Source model of the 1995 Hyogo-ken Nanbu
earthquake and simulation of near-source ground motion,Bull. Seism. Soc. Am.,88, 400–415, 1998.
Kamae, K., K. Irikura, and Y. Fukuchi, Prediction of strong ground motion for M7 earthquake using regional scaling relations of source parameters, J. Struct. Constr. Eng., AIJ.,416, 57–70, 1990 (in Japanese with English abstract).
Katagawa, H., M. Hamada, S. Yoshida, H. Kadosawa, A. Mitsuhashi, Y. Kono, and Y. Kinugasa, Geological development of the west sea area of the Noto peninsula district in the Neogene tertiary to quaternary, central Japan,J. Geogr.,114, 791–810, 2005.
Miyake, H., T. Iwata, and K. Irikura, Strong ground motion simulation and source modeling of the Kagoshima-ken Hokuseibu Earthquake of March 26 (MJMA6.5) and May 13 (MJMA6.3), 1997 using empirical Green’s function method,Zisin (J. Seism. Soc. Jpn.),51, 431–442, 1999. Miyake, H., T. Iwata, and K. Irikura, Source characterization for broadband ground-motion simulation, Kinematic heterogeneous source model and strong motion generation area,Bull. Seism. Soc. Am.,93, 2531–2545, 2003.
National Research Institute for Earth Science and Disaster Prevention, NIED Seismic Moment Tensor Catalogue, http://www.fnet.bosai.go.jp, 2007.
Tsurugi, M., M. Tai, K. Irikura, and A. Kowada, Estimation of empirical site amplification effects using observed records,Zisin,50, 215–227, 1997 (in Japanese with English abstract).
Wessel, P. and W. H. F. Smith, New, improved version of Generic Mapping Tools released,EOS,79, 579, 1998.
Yamanaka, Y., EIC seismological note,185, http://www.eri.u-tokyo.ac.jp/ sanchu/seismo Note/2007/EIC185.html, 2007 (in Japanese).