Comprehensive gene expression analyses in pluripotent
stem cells of a planarian, Dugesia japonica
NORITO SHIBATA*
,1, TETSUTARO HAYASHI
2, RYUTARO FUKUMURA
3, JUNSUKE FUJII
4,
TOMOMI KUDOME-TAKAMATSU
2, OSAMU NISHIMURA
1, SYOZO SANO
4, FUYAN SON
3,
NOBUKO SUZUKI
3, RYOKO ARAKI
3, MASUMI ABE
3and KIYOKAZU AGATA*
,41Global COE Program: Evolution and Biodiversity, Grad. School of Science, Kyoto Univ. 2Center for Dev. Biol., RIKEN, 3Transcriptome Research Center, NIRS and 4Dept. Biophysics, Grad. School of Science, Kyoto Univ., Japan
ABSTRACT The neoblasts are the only somatic stem cells in planarians possessing pluripotency, and can give rise to all types of cells, including germline cells. Recently, accumulated knowledge about the transcriptome and expression dynamics of various pluripotent somatic stem cells has provided important opportunities to understand not only fundamental mechanisms of pluripotency, but also stemness across species at the molecular level. The neoblasts can easily be eliminated by radiation. Also, by using fluorescence activated cell sorting (FACS), we can purify and collect many neoblasts, enabling identification of neoblast-related genes by comparison of the gene expression level among intact and X-ray-irradiated animals, and purified neoblasts. In order to find such genes, here we employed the high coverage expression profiling (HiCEP) method, which enables us to observe and compare genome-wide gene expression levels between different samples without advance sequence information, in the planarian D. japonica as a model organism of pluripotent stem cell research. We compared expression levels of ~17,000 peaks corresponding to independent genes among different samples, and obtained 102 peaks as candidates. Expression analysis of genes identified from those peaks by in situ hybridization revealed that at least 42 genes were expressed in the neoblasts and in neoblast-related cells that had a different distribution pattern in the body than neoblasts. Also, single-cell PCR analysis of those genes revealed heterogeneous expression of some genes in the neoblast population. Thus, using multidimensional gene expression analyses, we were able to obtain a valuable data set of neoblast-related genes and their expression patterns.
KEY WORDS:
planarian, pluripotent stem cell, HiCEP, comprehensive gene expression analysis
Introduction
Stem cells are extremely important cells not only during em-bryogenesis, but also during the life span of adult individuals. Fundamental features of stem cells are maintenance of the stem cell population and production of differentiated cells. These abili-ties are observed in the stem cells regardless of species and their differentiation ability. These general features imply the existence of common molecular mechanisms, underlying the regulation of stem cells among different tissues and across species in different taxa. In order to elucidate “stemness” in terms of the molecular signature of stem cells, comparative transcriptome analyses have
www.intjdevbiol.com
*Address correspondence to: Norito Shibata. Global COE Program, Division of Biological Science, Graduate School of Science, Kyoto University,
Kitashirakawa-Oiwake, Sakyo-ku, Kyoto 606-8502, Japan. Tel/Fax: +81-75-753-4261. e-mail: shiba@mdb.biophys.kyoto-u.ac.jp or Kiyokazu Agata. Department of Biophysics, Graduate School of Science, Kyoto University, Kitashirakawa-Oiwake, Sakyo-ku, Kyoto 606-8502, Japan. Tel/Fax: +81-75-753-4200. Fax: +81-75-753-4203. e-mail: agata@mdb.biophys.kyoto-u.ac.jp
Supplementary Material (1 table) for this paper is available at: http://dx.doi.org/10.1387/ijdb.113434ns
Final, author-corrected PDF published online: 16 March 2012
ISSN: Online 1696-3547, Print 0214-6282 © 2012 UBC Press
Printed in Spain
Abbreviations used in this paper: FACS, flourescent activated cell sorting; FBSC-PCR, FACS-based single cell PCR; HiCEP, high coverage expression profiling. been conducted among various types of stem cells in mammals. Although it has been reported that adult somatic stem cells exist in many species of invertebrates as well as vertebrates (Agata et
al., 2006), comparative gene expression analysis across those
evo-devo or medical applications.
Dugesia japonica, a freshwater planarian species, has robust
regenerative ability, by which almost any small fragments from the body except for in front of the eyes and in the pharynx can regener-ate into complete functional animals within 1 week after amputation. Adult stem cells in freshwater planarians, called as neoblasts, can give rise to all types of somatic cells during regeneration (Newmark & Sánchez Alvarado 2000). Also, germline cells are produced from the neoblasts in the adult body (Sato et al., 2006). Furthermore, the neoblasts supply differentiated cells in intact animals during tissue homeostasis (Newmark and Sánchez Alvarado 2000). X- or gamma-ray irradiation can specifically eliminate the neoblasts, and irradiated animals lose their regenerative ability. Transplantation of a neoblast-rich fraction can restore the regenerative ability of the X-ray-irradiated animals, indicating that regeneration of planarians depends on the neoblasts (Baguñà et al., 1989). In addition to those intriguing stem cell features in planarians, recent methodological advances such as in situ hybridization for mRNA detection, lin-eage tracing by BrdU-labeling, RNA interference (RNAi) for gene knockdown, purification of the neoblasts by fluorescence activated cell sorting (FACS) and single cell PCR based on FACS, make planarians a good animal for stem cell research (Hayashi et al., 2006; Hayashi et al., 2010; Newmark and Sánchez Alvarado 2000; Sánchez Alvarado and Newmark 1999; Umesono et al., 1997).
Thus, much research at the molecular level on the neoblasts has been reported, and information about the expression and function of specific genes is accumulating. The foremost molecular feature of the neoblasts in D. japonica is the expression and functions of a number of RNA-binding proteins encoded by germline-specific genes (Shibata et al., 2010). Vasa, PL10/DDX3 and Me31B are DEAD box RNA helicases expressed in germline cells in other animals. In D. japonica, those genes, Djvas-1, DjvlgA and Djcbc-1 respectively, are expressed in the neoblasts (Rouhana et al., 2010; Shibata et al., 1999; Yoshida-Kashikawa et al., 2007). Also, Djpum, a member of the PUF-domain family that acts in germline cells in flies and nematodes, is expressed and functions in the neoblasts (Salvetti et al., 2005). Furthermore, expression of piwi homolog genes, a subfamily of the Argonaute family whose mutants show severe defects of the germline in flies and mice, and expression of
bruli, encoding a member of the Bruno-like family of proteins that
represses translation of osk in germline cells in flies, is observed in the neoblasts in D. japonica as well as in Schmidtea
mediter-ranea, a related planarian species (reviewed by Shibata et al.,
2010). RNAi experiments revealed that RNA-binding proteins, including those encoded by germline-specific genes, are involved in the maintenance, proliferation or differentiation of the neoblasts in planarians (reviewed by Shibata et al., 2010).
Also, minichromosome maintenance2, 3 (DjMCM2, 3) and
proliferating cell nuclear antigen (Djpcna) related to the process
of DNA replication during cell proliferation have been reported to be neoblast-specific genes in D. japonica (Orii et al., 2005; Salvetti
et al., 2000). All of these gene identifications are based on
homol-ogy with known genes in other animals. Although a considerable number of neoblast-specific genes have been obtained by such homology-based methods, such approaches have some biases depending on each researcher that might make it difficult to obtain the overall gene expression profile of the neoblasts. To resolve this issue, genome-wide comprehensive gene expression analysis would be a beneficial approach.
The major method of comprehensive gene expression analy-sis comparing expression levels between different samples is hybridization-based assays such as microarray analysis. Although microarrays can compare the expression of numerous genes be-tween different samples, the method needs sequence information of a gene set from an EST or genome database. Indeed, microarray experiments using an EST database in D. japonica (using a set of 600 genes) and S. mediteranea (using a set of 3,435 genes) could identify many genes expressed in the neoblasts by comparison of the gene expression level between intact and X-ray irradiated planarians (Eisenhoffer et al., 2008; Rossi et al., 2007). Also, a method of transcriptome analysis that does not require any advance sequence information about gene set is available. Because this method, named HiCEP (high coverage expression profiling) has been developed through substantial improvement of the amplified fragment length polymorphism (AFLP), we can detect individual genes as different lengths of PCR fragments by electrophoresis genome widely, and can compare the expression levels of each gene between samples as a difference of fluorescent intensity without any sequence information (Fukumura et al., 2003). In embryonic stem cells (ES cells), about 40,000 transcripts including novel and non-coding genes have been identified by HiCEP (Araki et al., 2006). Thus, HiCEP is a suitable method for accumulating information about gene expression in organisms that have incomplete or lack of gene sequence information.
Here, we report genome-wide comprehensive comparison of gene expression between intact planarians, X-ray-irradiated planarians and purified neoblasts using FACS by HiCEP. Also, we confirmed the expression of HiCEP clones by several methods: in
situ hybridization, quantitative RT-PCR (qPCR) and FACS-based
single cell PCR (FBSC-PCR). The results showed that we could obtain many neoblast specific genes which showed different expression patterns, and also could demonstrate heterogeneity of the neoblasts.
Results
Preparation of samples and experimental procedure for HiCEP analysis in D. japonica
(Fig. 1). Selective PCR using the 16x16 primer sets was carried out, and the products were analyzed by capillary electrophoresis (Fig. 1: Fukumura et al., 2003). As a result, we detected each PCR product as a peak with a particular length and intensity in each sample. We expected that the peaks of candidate genes would be positive in the non-irradiated planarians, negative or decreased in the X-ray-irradiated planarians, and positive in the neoblast-rich sample [X-ray(-)posi,/X-ray(+)nega/X1/2posi; as indicated for the red peak in Fig. 1]. The obtained candidate genes were then subjected to the following expression analyses (Fig. 1).
Comparison of gene expression levels among the different samples by HiCEP in D. japonica
We performed HiCEP analysis twice for each sample to check the reproducibility. Consequently, we detected about 17,000 peaks in total in the X-ray(-) sample. The expression levels of 318 peaks showed an X-ray(-)posi/X-ray(+)nega pattern [more than 50% reduction in the X-ray(+)]. Among them, 102 peaks showed the expected pattern: X-ray(-)posi/X-ray(+)nega/X1/2posi (table S1). For example,
the peak named A3-X-2/HEX was greatly reduced in the X-ray(+) sample in the two experiments (Fig. 2A). A peak with same length was observed in the X1/2 sample (Fig. 2A). Also, the peak D1-I-2/ HEX showed a similar result (Fig. 2B).
By sequence analysis of several peaks, 110 kinds of gene frag-ments from the 102 peaks were found, indicating that some peaks were composed of multiple fragments, as was also observed in the transcriptome analysis of ES cells by HiCEP (Araki et al., 2006; Table S1). Among them, 86 fragments were matched to clones in the EST database of D. japonica. We found that at least 13 frag-ments were derived from 6 kinds of EST clones, suggesting that there was polymorphism or alternative splicing in those clones. Fifty of the 78 independent EST clones matched HiCEP fragments showing homology or similarity to genes in other animals (Table S1). Although we extended some fragment sequences, which did not match to any EST clones, by 5’RACE, such as #002 (C3-I-2/
NED) and #005 (G4-I-2/HEX), we did not finding clone matching
those fragments in the EST database or any homology with genes
Sample 1
in situ hybridization qPCR Single cell RT-PCR (FBSC-PCR)
AAAAA
MspI cut and MspI adaptor ligation
MseI cut and MseI adaptor ligation
Selective PCR with 16x16 primer sets
Capillary electrophoresis of PCR products(~17,000 gene fragments)
Xray(-)posi, Xray(+)nega, X1/2posi
Fig. 1. Schematic drawing of the high coverage expression profiling
(HiCEP) experimental procedure. For details see text.
Fig. 2. Examples of comparison of expression level of gene fragments
between X-ray(-), X-ray(+) and X1/2 samples by HiCEP.(A) Expression
pattern of A3-X-2/HEX. (B) Expression pattern of D1-I-2/HEX. Black peaks
in experiments 1 and 2 (Exp. 1 and 2) indicate expression levels of genes in the X-ray(-) sample. Red peaks in experiments 1 and 2 (Exp. 1 and 2) indicate expression levels of genes in the X-ray(+) sample. Black and red peaks in Exp.1, 2 indicate gene expression in the X1/2 sample. Arrows
indicate gene fragments showing the X-ray(-)posi/X-ray(+)nega/X1/2posi pattern.
in other animals (Table S1). For the other non-matched fragments, 5’RACE failed to extend the sequence. Then, the EST-matched clones and the 2 non-matched clones were subjected to the next analysis.
Expression analyses of HiCEP genes by in situ hybridization
To confirm the stem-cell-expressed genes identified by HiCEP analysis, called HiCEP clones, we performed whole-mount in situ hybridization (Fig. 3). The results showed that 42 independent HiCEP clones derived from 46 HiCEP fragments were specifi-cally expressed in X-ray-sensitive cells. Among those clones, 16 did not show any homology or similarity with any known genes in
other organisms (Table 1), whereas #001 (unknown) was similar to NB.32.1g, a novel gene in S. mediterranea whose function is not clear. (Eisenhoffer et al., 2008). As mentioned above, many kinds of RNA-binding protein genes, including germline-specific genes, are expressed in the neoblasts of D. japonica (reviewed by Shibata et al., 2010). In our analyses, #008 (piwiA; a homolog of piwi, Yoshida-Kashikawa et al., 2007, Hayashi et al., 2010, Rouhana et al., 2010) and #028 (a DEAD box family gene) were obtained as genes containing RNA-binding motifs (Table S1). Also, we found a histone RNA hairpin-binding protein [#024(hRNAhbp)], which is required for translation of histone mRNA (Allard et al., 2005), and two ribosomal proteins [#013 (rpL44; a ribosomal
pro-Fragment ID Fragment length (bp) Clone # Homology (species) Published Clone ID in EST (gene name) E value
A3-X-2/HEX 169.62 001 NB.31.1g [Schmidtea mediterranea] 05955HH 4E-16
C3-I-2/NED 104.64 002 N/A
D3-I-2/HEX 169.73 003 NB.31.1g [Schmidtea mediterranea] =#001
E11-I-2/FAM 106.61 004 N/A 05656HH
G4-I-2/HEX 226.98 005 N/A
E5-I-2/HEX 163.38 006 zinc finger protein Ci-ZF(C2H2)-42 [Ciona intestinalis] 02488HH 7E-11
C7-I-2/NED 262.55 007 SWI/SNF-related chromatin binding protein [Schistosoma mansoni] 02960HH 4E-29
E6-I-2/HEX 107.23 008 Piwi [Botryllus primigenus] 03609HH (DjpiwiA) 2E-59
E5-I-2/HEX 229.27 009 arginine N-methyltransferase 1 [Echinococcus granulosus] 04361HH 2E-57
D3-I-2/FAM 318.17 010 Nucleoside diphosphate kinase [Aspergillus nidulans FGSC A4] 06317HH 4E-51
H6-I-2/FAM 236.91 011 purinergic receptor P2X1 [Taeniopygia guttata] 06727HH 3E-21
B3-I-2/FAM 177.92 012 purinergic receptor P2X4 [Sus scrofa] 06974HH (DjP2X-A) 9E-25
H8-I-2/NED 196.11 013 ribosomal protein L44 [Chlamys farreri] 1E-41
A12-X2-1/NED 170.48 016 N/A
D12-I-2/NED 161.72 019 Zn finger homeodomain 2 [Tribolium castaneum] 1E-12
B1-I-2/FAM 198.82 023 selenophosphate synthetase 1 [Mus musculus] 4E-43
B7-I-2/HEX 160.42 024 Histone RNA hairpin-binding protein [Schistosoma japonicum] 2E-29
F2-I-2/FAM 200.92 025 N/A
F10-I-2/NED 138.39 028 similar to DEAD (Asp-Glu-Ala-Asp) box polypeptide 53 [Ciona intestinalis] 0.000003
F12-I-2/NED 138.4 029 similar to DEAD (Asp-Glu-Ala-Asp) box polypeptide 53 [Ciona intestinalis] =#028
F1-I-2/FAM 430.13 030 Rootletin (Ciliary rootlet coiled-coil protein) [Schistosoma mansoni] 1E-144
G6-I-2/HEX 212.56 032 topoisomerase (DNA) II beta [Mus musculus] 3E-32
H4-I-2/FAM 160 033 N/A
H6-I-2/FAM 215.14 035 Sox8b [Takifugu rubripes] 1E-20
D9-I-2/NED 469.49 037 Placenta-specific gene 8 protein [Schistosoma japonicum] 1E-13
E9-I-2/FAM 244.37 038 SMED P53 [Schmidtea mediterranea]
A11-X2-2/FAM 105.56 040 Setb protein [Danio rerio] 02457HH 8E-49
A4-X2-1/HEX 276.93 041 similar to DEAD (Asp-Glu-Ala-Asp) box polypeptide 53 [Ciona intestinalis] =#028
B5-I-2/NED 123.59 042 Putative OPA3-like protein CG13603 [Schistosoma japonicum] 4E-32
D3-I-2/FAM 179.4 046 Dynein intermediate chain 2 [Anthocidaris crassispina] 03394HH 5E-57
D9-I-2/FAM 101.36 047-2 chaperonin containing t-complex protein 1 gamma subunit tcpg [Schistosoma mansoni] 03940HH 0.0
E5-I-2/HEX 99.47 050 large subunit ribosomal protein 10 [Oigolaimella attenuata] 04458HH 8E-59
E6-I-2/FAM 147.06 051 N/A 00998HH 0.97
F10-I-2/NED 76.56 054 N/A
H3-I-2/NED 60.99 057 N/A
H6-I-2/FAM 62.08 058 N/A 06441HH
A6-I-2/NED 89.7 060 N/A
C3-I-2/FAM 84.12 061-2 NADH dehydrogenase subunit 2 [Metaseiulus occidentalis] 07117HH 0.005
C7-I-2/NED 55.94 062 peroxiredoxins, prx-1, prx-2, prx-3 [Aedes aegypti] 1E-81
E10-I-2/FAM 67.99 075 N/A 00310HH
G11-I-2/FAM 106.67 081 N/A =#004
G2-I-2/FAM 64.87 082 protein phosphatase 2C [Schistosoma mansoni] 00503HH 3E-62
G6-I-2/FAM 99.35 085 conserved-hypothetical-protein-[Ixodes-scapularis] 0.000006
H1-I-2/FAM 71.52 097 similar-to-cytochrome-P450-CYP15A1-[Acyrthosiphon-pisum] 0.00000004
H5-I-2/FAM 54.49 098 CDGSH-type Zn finger-containing protein-like protein [Schistosoma mansoni] 1E-31
G12-I-2/FAM 91.73 100 FK506-binding protein [Manduca sexta] 2E-42
TABLE 1
tein L44 homolog), #050 (rp10; a large subunit ribosomal protein 10 homolog)]. Notably, #007 and #009 clones showed similarity
with epigenetics-related proteins, SWI/SNF-related chromatin binding protein (SWI/SNFr) and arginine N-methyltransferase (PRMT), respectively (Table 1). Furthermore, transcription factors and zinc finger proteins were found among the clones [#006 (zf, a planarian zinc finger protein), #035 (soxP1, a planarian homolog of sox gene), #038 (p53, a homolog of p53) #098 (zf, a planarian
zinc finger protein)]. Also, other kinds of genes were obtained by
HiCEP as genes expressed in X-ray-sensitive cells (Table 1), for example, a membrane protein P2X homolog, #012 (P2X-A) or protein phosphatase 2C, #082 (pp2C), indicating that a lack of bias in the kind of gene obtained by HiCEP.
#008 (piwiA), showed a typical pattern of neoblast-specific
ex-pression, in which the distribution of positive cells was observed in the mesenchymal space from behind the eyes to the tail (Fig. 3C; Yoshida-Kashikawa et al., 2007; Rouhana et al., 2010; Shibata et
al., 2010). Cells expressing #008 (piwiA) completely disappeared
in the X-ray-irradiated animals (Fig. 3D), indicating that this gene was specifically expressed in the neoblasts, as previously described (Yoshida-Kashikawa et al., 2007; Rouhana et al., 2010; Shibata
et al., 2010). Genes such as #012 (P2X-A) and #032 (unknown)
showed the same expression patterns as #008 (piwiA) in intact and X-ray-irradiated animals (data not shown). A similar expression pattern to that of #008 (piwiA) was observed for #009 (PRMT) (Fig 3E). Although the expression pattern of #009 (PRMT) appeared to be identical to that of the neoblast-specific genes in intact animals, in X-ray-irradiated animals, expression in brain neurons was still observed (Fig. 3F). Many HiCEP clones showed this expression
Fig. 3. Expression of Type1, 2 and 3 genes revealed by whole mount in situ
hybridization.(A) Expression pattern of Type 1 gene [#001 (unknown)] in intact
animal. (B) Expression pattern of #001 (unknown) in X-ray-irradiated planarian. (C)
Expression pattern of Type 2A gene [#008 (piwiA)] in intact animal. (D) Expression
pattern of #008 (piwiA) in X-ray-irradiated planarian. (E) Expression pattern of Type
2B gene [#009 (PRMT)] in intact animal. (F) Expression pattern of #009 (PRMT)
in X-ray-irradiated planarian. (G) Expression pattern of Type 3 gene [#015 (rpS3)]
in intact animal. (H) Expression pattern of #015 (rpS3) in X-ray-irradiated planarian.
Confirmation of expression level of several types of genes by qPCR
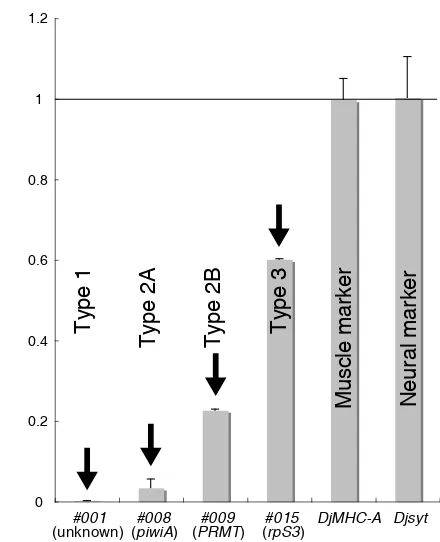
The expression of various HiCEP genes was also confirmed by qPCR (Fig. 4). The expression levels of Type 1 and Type 2A HiCEP clones were significantly decreased in the X-ray-irradiated planarians (Fig. 4). Also, the gene expression levels of Type 2B HiCEP clones were greatly decreased, like those of Type 1 and Type 2A clones; however, about 20 % of the expression of some clones, for example #009 (PRMT), remained in the X-ray-irradiated animals, where it was mainly seen expression in the brain (Fig. 4). Also, about a 40% reduction of the gene expression level of a Type 3 clone, #015 (rpS3), was observed in the X-ray-irradiated planarians. In contrast with these changes of the gene expression levels of HiCEP clones, the expression levels of differentiated cell marker genes, e. g., Djsyt as a neural marker and DjMHC-A as a muscle marker were not affected by X-ray irradiation (Fig. 4).
Expression analysis of HiCEP clones by single cell RT-PCR
Finally, we employed FACS-based single cell RT-PCR (FBSC-PCR) to investigate the expression of the neoblast-specific HiCEP clones at the single cell level. FBSC-PCR enables us to analyze the expression of many genes in single cells, and to link the gene expression information to the FACS profile using the index-sorting function (Hayashi et al., 2010). We collected 188 cells each from the X1, X2 and XIS fractions (Fig. 5A), and analyzed the gene expression of several HiCEP clones in these cells.
#008 (piwiA) was expressed in 84% of the cells in the X1
frac-tion and in 34% of the cells in the X2 fracfrac-tion consistent with the previous result (Fig. 5B; Hayashi et al., 2010). Cells expressing
G
B
C
D
E
F
H
A
pattern, for example, #005 (unknown), #007 (SWI/SNFr),
#057 (unknown), and #100 (FK506-binding protein) (data
not shown).
Although expression of #001 (unknown) disappeared in X-ray-irradiated animals (Fig. 3B), the expression pat-tern of this clone was different from that of #008 (piwiA) or
#009 (PRMT) (Fig. 3A). Cells expressing #001 (unknown)
were located in the mesenchymal space from in front of the eyes to the tail. The neoblasts were lacking in front of the eyes (Fig. 3C), suggesting that the cells-expressing #001 (unknown) are another type of X-ray-sensitive cells. Also,
#038 (p53) showed a similar expression pattern to that of #001 (unknown).
We found ubiquitous expression patterns of some HiCEP clones, for example #015 (rpS3; a homolog of ribosomal
protein S3 in D.japonica) in intact animals (Fig. 3G).
Ubiq-uitous expression of #015 (rpS3) was also observed in X-ray-irradiated animals, although the expression level of
#015 (rpS3) seemed to be decreased (Fig. 3H). According
#008 (piwiA) were specifically sorted into the X1 and X2 fractions, in
accord with the results from in situ hybridization (Fig. 5B). Another Type 2A gene, #012 (P2X-A), was also specifically expressed in cells in the X1 and X2 fractions, and almost all #012 (P2X-A)-expressing cells co-expressed #008 (piwiA); however, the number of #012 (P2X-A)-expressing cells was about half of the number of #008 (piwiA)-expressing cells (Fig. 5 C,H). 50.6% (80/158) of
#008 (piwiA)-expressing cells in the X1 fraction co-expressed #012 (P2X-A), and 27.7% (18/65) of #008 (piwiA)-expressing cells
in the X2 fraction were also positive for #012 (P2X-A), indicat-ing heterogeneity of the neoblasts. Expression of #007, a Type 2B gene, was also detected in cells in the X1 and X2 fractions (Fig. 5D). Almost all cells expressing #008 (piwiA) in the X1 and X2 fractions expressed #007 (SWI/SNFr) [94.9% (150/158) and 75.4% (49/65), respectively] (Fig. 5G). Also, we found that 34 cells in the X2 fraction were #007 (SWI/SNFr)-single positive cells as well as 36 cells in the XIS fraction (Fig. 5 D,G). Those #007 (SWI/
SNFr)-single positive cells are expected to be neuronal cells
ac-cording to the results of in situ hybridization. Indeed, 55.6% of #007 (SWI/SNFr)-single positive cells in the XIS fraction co-expressed neuronal marker genes, whereas some #007 (SWI/SNFr)-single positive cells in the X2 fraction were positive for not only neuronal markers, but also muscular or mucus-producing cell marker genes, suggesting that #007 (SWI/SNFr)-single positive cells in the X2 fraction might be differentiating cells from the neoblasts (data not shown). A similar expression pattern and sorting profile were observed in the case of #009, another Type 2B clone, in which 91.2% of cells in the X1 fraction and 69.2% of cells in the X2 frac-tion co-expressed both DjpiwiA and #009 (PRMT) (Fig. 5E). Also, about 30% of #009-single positive cells in the XIS fraction were positive for neuronal cell marker genes (data not shown). We also
found heterogeneous gene expression of a Type 2B clone, #004 (unknown), which showed no homology with any known gene. 35.4% (56/158) and 29.2 % (19/65) of cells expressing #008 (piwiA) in the X1 fraction and X2 fraction, respectively, co-expressed #004 (unknown) (Fig. 5F). Furthermore, expression of #012 (P2X-A) was detected in 55.4% of cells co-expressing DjpiwiA and #004 (unknown) in the X1 fraction (Fig. 5H), showing the complexity of the neoblast population.
Discussion
Genome-wide approaches by transcriptome analysis yield significant biological information for understanding molecular fundamentals underlying complex biological phenomena. Also, accumulation of transcriptomic information in several species belonging to different phyla gives us a great opportunity to shed light on the commonality or differences of molecular machinery regulating the same cell type or same phenomenon between species. In order to accumulate transcriptomic information of the neoblast in D. japonica, we conducted genome-wide gene expression analysis by HiCEP, which can survey gene expression genome widely and detect the expression levels of those genes simultaneously (Fukumura et al., 2003). Using this unlimited gene expression analysis, we detected ~17,000 peaks in the intact sample. So far, the genome size of D. japonica is estimated to be about 1~1.5 G bp, and the total number of genes is expected to be around 20,000 (Agata and Nishimura. personal communication). Actually, it was observed that some different peaks were derived from the same gene in our results, indicating that the number of peaks did not reflect the number of kinds of genes (Table 1 and S1). However, most of the peaks matched to independent EST clones, suggesting that our analysis could survey genome widely.
Comparison of gene expression levels in the three samples by HiCEP
By comparison of the gene expression in 5 distinct samples by HiCEP, namely from head-regenerating tissues 12 and 24 hours after amputation, tail-regenerating tissues 12 and 24 hours after amputation, and non-regenerating tissues, Tasaki et al., succeeded in the identification of DjmkpA (Dugesia japonica mitogen-activated
kinase phosphatase A) as an early blastema-specific gene (Tasaki et al., 2011). Also in this report, we compared gene expression
levels between 3 distinct samples [X-ray(-), X-ray(+) and X1/2], and detected 102 peaks as candidates which showed the expres-sion pattern X-ray(-)posi/X-ray(+)nega/X1/2posi, among the 318 peaks of X-ray(-)posi/X-ray(+)nega. The remaining 216 peaks showed an X-ray(-)posi/X-ray(+)nega/X1/2nega pattern (data not shown). In situ hybridization revealed that a clone of this type was not expressed in the neoblasts (data not shown). Thus, we could narrow down the number of candidate peaks by comparing the gene expres-sion in not only intact and X-ray-irradiated planarians, but also the stem cell-enriched sample collected by FACS.
Genes obtained by HiCEP
HiCEP enables us to obtain not only known genes, but also novel genes (Araki et al., 2006). In our analysis, we could not find any EST clone matching 24 fragments (Table S1). The sequence of these fragments also did not show any similarity with any known gene in other organisms, although at least 2 clones extended
0 0.2 0.4 0.6 0.8 1 1.2
#001 #008 #009 #015 DjMHC-A Djsyt
Type 1
Muscle marker
Neural marker
Type 2A
Type 2B
Type 3
Relative expression levels in X-ray irradiated animals
(unknown) (piwiA) (PRMT) (rpS3)
Fig. 4. Confirmation of expression levels of several types of genes by
from the fragments by 5’RACE among them were expressed in the neoblasts [#002 (unknown) and #005 (unknown)]. Genome information and enrichment of the EST database in D. japonica might uncover gene information about the remaining fragments in the future. Thus, we could identify many genes expressed in the neoblasts, not only known genes (30 independent clones), but also novel genes (12 independent clones) by HiCEP analysis.
Previously, microarray analysis (using the Dj600 chip) to obtain neoblast-specific genes in D. japonica was carried out (Rossi et
al., 2007). In the results, 42 kinds of genes, including 4 genes
(rpS3), whereas there is a possibility that expression of #015 (rpS3) was merely affected by X-ray irradiation in D. japonica.
Two of the HiCEP clones showed a Type 1 expression pat-tern, in which cells expressing the genes were distributed in the mesenchymal space from in front of the eyes to the tail. One of them, #001 (unknown), showed homology with NB.32.1g, which is a novel gene identified by microarray analysis in S.
mediter-ranea (Eisenhoffer et al., 2008). Based on disappearance of
the neoblasts followed by cells expressing NB.32.1g after X-ray irradiation, and cell tracing experiment using BrdU, it has been Fig. 5. Single cell gene expression analyses by FACS-based single cell PCR
(FBSC-PCR).(A) Total cells in the several fractions used for analysis. (B) Expression
of #008 (piwiA). (C) Co-expression analysis of #012 (P2X-A) (green) and #008 (piwiA)
(magenta). Yellow dots show double positive cells. (D) Co-expression analysis of #007
(SWI/SNFr) (green) and #008 (piwiA) (magenta). Yellow dots show double positive
cells. (E) Co-expression analysis of #009 (PRMT) (green) and #008 (piwiA) (magenta).
Yellow dots show double positive cells. (F) Co-expression analysis of #004 (unknown)
(green) and #008 (piwiA) (magenta). Yellow dots show double positive cells. (G)
Co-expression diagram for #008 (piwiA) (magenta), #007 (SWI/SNFr) (green) and #009 (PRMT) (yellow). The numbers indicate the cell number belonging to each overlapping
expression. (H) Co-expression diagram for #008 (piwiA) (magenta), #004 (unknown)
(green) and #012 (P2X-A) (yellow). The numbers indicate the cell number belonging to each overlapping expression.
known to be expressed in the neoblasts, showed re-duced expression levels in X-ray-irradiated planarians. Although our analyses revealed that 42 kinds of genes were expressed in the neoblasts or related cells, only 2 genes were overlapping between the results from the Dj600 chip and HiCEP [#010 (ndpk; nucleoside
diphos-phate kinase) and #040 (setb)]. The foremost difference
in the results between the Dj600 chip and HiCEP is that unknown (novel) genes expressed in the neoblasts can be found in the result of HiCEP, because the HiCEP method is independent of sequence information.
In situ hybridization revealed different expression patterns among HiCEP clones
We found different expression patterns among HiCEP clones via expression analysis by in situ hybridization. We categorized those expression patterns mainly into 3 types: Type 1, Type 2 and Type 3 (Fig. 3). Although type 2 was the typical distribution pattern of the neoblasts, this pattern was subdivided into 2 more types: Type 2A and B, according to difference of expression in the brain. Expression pattern type 2B, which is expression in the neoblasts and brain neurons, was also observed in the results of extensive analyses of RNA-binding proteins, as well as Type 2A (Rouhana et al., 2010; Yoshida-Kashikawa et al., 2007), suggesting that there are similar molecular machineries to regulate the neoblasts and neurons (Yoshida-Kashikawa et al., 2007).
Type 3 clones were ubiquitously expressed in planar-ians, but their expression levels were reduced by X-ray irradiation. #015 (rpS3) showed a Type 3 expression pattern. rpS3 is known to be a component of the small ribosomal subunit involved in translational initiation (Po-lakiewicz et al., 1995). Interestingly, multiple functions of rpS3 in addition to translation have been reported, for example, rpS3 is involved in DNA repair after UV ir-radiation (Jung. et al., 2001; Lee et al., 2002). Also, rpS3 binds to p53 and MDM2, and regulates the p53 level by preventing its degradation (Yadavilli et al., 2009), sug-gesting that rpS3 is also concerned with apoptosis and cell cycle regulation via the p53 cascade. The neoblasts are a unique somatic cell population possessing prolifera-tive ability, and show sensitivity to X-ray or gamma ray irradiation that is expected to induce DNA breaks and apoptosis (Pellettieri et al., 2009). This implies that #015 (rpS3) expression in the neoblasts might be relatively higher than that in differentiated cells. This may cause a decrease of the expression level in the X-ray-irradiated animals in spite of the ubiquitous expression of #015
proposed that NB.32.1g-expressing cells should be precursor cells of some differentiated cells (Eisenhoffer et al., 2008). It has also been reported that p53 in S, mediterranea is involved in the production of cells expressing NB.32.1g (Pearson and Sánchez Alvarado, 2010). Another Type 1 clone was #038 (p53), indicat-ing that cells expressindicat-ing Type 1 clones are coincident with cells expressing NB.32.1g in S. mediterranea.
Heterogeneity of the neoblasts revealed by FBSC-PCR
In the case of ES cells, heterogeneous expression of nanog, which has an important role in maintaining the pluripotency of ES cells, is observed (Chambers et al., 2007). Nanog-expressing ES cells can keep their status as ES cells, whereas Nanog-negative ES cells undergo differentiation or return to the ES cell state (Chambers et al., 2007). Transitions of gene expression along the changing cell status are also observed in hematopoietic stem cells (Wilson et al., 2007). Furthermore, during neurogenesis in fly, expression levels of transcription factors is sequentially changed along the progression of embryogenesis, and these changes are required for proper neural cell production (Isshiki
et al., 2001). Thus, manifestation about heterogeneity in a cell
population at the molecular and single cell levels will bring us important information to define the cell state.
Classically, the neoblasts were considered to be a unique and homogeneous cell population. However, recent molecular research has demonstrated the heterogeneity of the neoblast population in D. japonica. Djpiwi-1, a piwi family gene in D.
ja-ponica, is expressed in the subpopulation of neobasts located
along the longitudinal dorsal midline (Rossi et al., 2006). nanos is expressed in the germline precursors in asexual planarians in D. japonica (Sato et al., 2006). The cells expressing nanos have stem cell features morphologically and express several neoblast specific genes (Sato et al., 2006; Yoshida-Kashikawa
et al., 2007), meaning they are a subpopulation of neoblasts.
This result was confirmed by the results of FBSC-PCR analysis, in which nanos-positive cells were found in the X1 fraction, a certain population among DjpiwiA-expressing cells (Hayashi et
al., 2010). FBSC-PCR analyses also showed heterogeneity of the
neoblasts based on the expression of several genes (Hayashi et
al., 2010). Furthermore, FBSC-PCR revealed that genes related
to DNA replication are predominantly expressed in the S-phase neoblasts, suggesting complex heterogeneous gene expression in the neoblast population (Hayashi et al., 2010). Here, we also found heterogeneous gene expression in the HiCEP clones (Fig. 5). #012 (P2X-A) belonging to Type 2A was expressed in about half of the neoblasts positive for DjpiwiA in the X1 fraction. In the X2 fraction, #012 (P2X-A)- and #008 (piwiA)-double positive cells were also found. #012 (P2X-A) encodes an ionotropic purinergic receptor, named DjP2X-A, and functions in maintaining the steady state of cell proliferation of the neoblasts (Sakurai et al., 2012). Although cells positive for DjP2X-A were distributed throughout the body along the anterior-posterior and medio-lateral axis like those positive for DjPiwiA, the DjP2X-A-expressing neoblasts were localized in the outermost layer of the mesenchymal space whereas DjPiwiA single positive neoblasts were observed in a more inner layer, reflecting heterogeneous expression as de-fined by FBSC-PCR. We do not know the details of regulatory mechanism of DjP2X-A expression in the neoblasts, but it might be related to be proliferation state.
Conclusion
In this work, we surveyed planarian gene expression by HiCEP genome widely, and analyzed the expression of the genes by in situ hybridization, qPCR and single cell RT-PCR. By these multiple gene expression analyses, we could obtain at least 110 gene fragments as candidates, define at least 42 neoblast or related cell-specific genes classified into Type 1, Type 2A and B, and could reveal complexity of the gene expression in the neoblast population. These multidimensional data can provide important information not only about planarians, but also about stem cell biology.
The combination of HiCEP and in situ hybridization identified several kinds of neoblast-specific genes including genes predicted to be involved in chromatin modification, gene transcription, cell cycle, apoptosis and cell-cell interaction via the cell membrane as well as RNA metabolism. This sequence information expands our knowledge of molecular fundamentals in planarian stem cells. Through functional analyses of these genes in the future, we will be able to interconnect several molecular cascades in overall neoblast regulation. Furthermore, this gene set of the neoblasts in D. japonica, in combination with previous information (reviewed by Shibata et
al., 2010), can be used to reveal common features of stemness
across species by comparing gene sets among organisms. The data from the combination of in situ hybridization and FBSC-PCR will help us to understand the relationship between gene function and nonuniformity of the neoblasts. Also, we can utilize this method for analysis that defines the gene function involved in commitment of the neoblasts to restricted cell lineages after we identify precise cell markers. Thus, these multiple gene expression analyses are very useful for stem cell research not only in planarians, but also in other organisms, and might provide significant information for stem cell biology.
Materials and Methods
AnimalsThe asexual planarians of a clonal strain, SSP (sexualizing special pla-narian), of D. japonica were used. Planarians were kept in autoclaved tap water at 24°C. They were fed chicken liver every 2 weeks for maintenance. Planarians were starved for 7-14 days prior to experiments. About 8-mm-long planarians were sacrificed for the neoblast collections by FACS and FBSC-PCR, and up to 6-mm planarians were used for in situ hybridization.
RNA preparation
Total RNA from the neoblasts collected by FACS was prepared using an RNeasy Mini kit (QIAGEN) for HiCEP. Total RNAs from intact and X-ray-irradiated planarians were prepared by the CsCl cushion method for HiCEP. Total RNAs from intact and X-ray-irradiated animals were prepared using ISOGEN-LS (ISOGEN-LS, Tokyo, Japan) for qPCR.
X-ray irradiation
X-ray irradiation was performed as previously described (Yoshida-Kashikawa et al., 2007). Planarians placed on wet filter paper on ice were irradiated with 160 cGray (cGy) of X-rays using an X-ray generator (SOFTEX B-4).
HiCEP
HiCEP analysis was performed as described by Fukumura et al.,2003). Five micrograms of total RNA from each sample was used for first strand
cDNA synthesis using a SuperscriptTM First-Strand Synthesis System
(Takara, Ohtsu, Japan), followed by MspI adaptor ligation with T4 DNA ligase (NEB, Beverly, MA). The products ligated with poly(A)-biotin were collected using magnetic beads coated with streptavidin, Dynabeads M-280 streptavidin (Dynal, Oslo, Norway). After washing, the products on the beads were digested with MseI (NEB). The supernatant containing digested fragments was collected, followed by ligation to 10.2 pmol MseI adaptor using T4 ligase.
Using those adaptor-ligated dscDNA fragments, selective PCR based on AFLP was carried out. The 16 sequences of MspI-NN primers conjugated with fluorescent dye and the 16 sequences of MseI-NN primers were used. The PCR conditions were as follows: 95.0°C for 1 min, 28 cycles at 95.0°C for 20 sec, 71.5°C for 30 sec and 70°C for 1min, followed by 60.0°C for 30 min. The PCR products were loaded on an ABI Prism 310 (Applied Biosystems, Foster City, CA) for electrophoresis. The data analysis was performed using GeneScan 3.1.2 (Applied Biosystems).
The aliquot of HiCEP product was loaded on a 10 % polyacrylamide gel. After silver staining of the gel, appropriate bands matching fragments
of interest were cut out. The gel slices were suspended in 50 ml of TE
buffer (10 mM Tris-HCl pH 8.0, 1mM EDTA), and 2 ml of supernatant was
used for PCR.
Whole-mount in situ hybridization
All digoxigenin-labeled RNA probes were prepared using pBlue-scriptSK(-) vectors containing the insert from the EST clone or pCR II-TOPO (Invitrogen) vector containing PCR product and a digoxigenin-labeling kit according to the manufacturer’s instructions (Roche). Manual whole-mount in situ hybridization using alkaline phosphatase and 4-nitroblue tetrazolium chloride ⁄ 5-bromo-4-chloro-3-indolyl-phosphate (NBT ⁄ BCIP) color development was carried out as described by Umesono et al., 1997. Also automatic in situ hybridization was carried out by InsituPro (ABIMED, Langenfeld, Germany).
Quantitative reverse transcription-polymerase chain reaction
First-strand cDNAs complementary to total RNA from intact and X-ray-irradiated planarians were synthesized using a QuantiTect, Reverse Tran-scription kit (GIAGEN). Diluted cDNAs (20X) were used for semi-quantitative reverse transcription-polymerase chain reaction (qPCR). Ten microliters of qPCR mixture was composed of 1X Quantitect SYBR green PCR master
mix (QIAGEN), 0.3 mM gene primers and diluted cDNA, and incubated in
an ABI PRISM 7900 HT (Applied Biosystems). The reaction conditions were as follows: 50°C for 2 min, 95°C for 15 min, 50 cycles of 95°C for 15 sec, 60°C for 30 sec and 72°C for 1 min. To check the products, 95° C for 15 sec, 60°C for 15 sec and 95°C for 15 sec was added to determine the melting curve at the end of the reaction.
Single cell RT-PCR
Single cell gene expression analyses using FACS-based single cell RT-PCR (FBSC-PCR) were performed as described by Hayashi et al., (2010). Gene specific primers were as follows:
DjG3PDH
We thank Dr Elizabeth Nakajima for critical reading of the manuscript and all other laboratory members for their help and encouragement. This work was supported by a Grant-in-Aid for Creative Scientific Research to K. A. (17GS0318), a Grant-in-Aid for Scientific Research on Innovative Areas “RNA regulation” (No. 20112006) to N. S. and the Global COE Program A06 of Kyoto University.
References
AGATA, K., NAKAJIMA, E., FUNAYAMA, N., SHIBATA, N., SAITO, Y. and UMESONO, Y. (2006). Two different evolutionary origins of stem cell systems and their mo-lecular basis. Semin Cell Dev Biol 17: 503-509.
ALLARD, P., YANG, Q., MARZLUFF, W.F. and CLARKE, H.J. (2005). The stem-loop binding protein regulates translation of histone mRNA during mammalian oogen-esis. Dev Biol 286: 195-206.
ARAKI, R., FUKUMURA, R., SASAKI, N., KASAMA, Y., SUZUKI, N., TAKAHASHI, H., TABATA, Y., SAITO, T. and ABE, M. (2006). More than 40,000 transcripts, including novel and noncoding transcripts, in mouse embryonic stem cells. Stem
Cells 24: 2522-2528.
BAGUÑÀ, J., SALÒ, E. and AULADELL, C. (1989). Regeneration and pattern forma-tion in planarians. III. Evidence that neoblasts are totipotent stem cells and the source of blastema cells. Development 107: 77-86.
CHAMBERS, I., SILVA, J., COLBY, D., NICHOLS, J., NIJMEIJER, B., ROBERTSON, M., VRANA, J., JONES, K., GROTEWOLD, L. and SMITH, A. (2007). Nanog safe-guards pluripotency and mediates germline development. Nature 450: 1230-1234. EISENHOFFER, G.T., KANG, H. and SÁNCHEZ ALVARADO, A. (2008). Molecular
analysis of stem cells and their descendants during cell turnover and regeneration in the planarian Schmidtea mediterranea. Cell Stem Cell 3: 327-339.
FUKUMURA, R., TAKAHASHI, H., SAITO, T., TSUTSUMI, Y., FUJIMORI, A., SATO, S., TATSUMI, K., ARAKI, R. and ABE, M. (2003). A sensitive transcriptome analysis method that can detect unknown transcripts. Nucleic Acids Res 31: e94. HAYASHI, T., ASAMI, M., HIGUCHI, S., SHIBATA, N. and AGATA, K. (2006). Isolation
of planarian X-ray-sensitive stem cells by fluorescence-activated cell sorting. Dev
Growth Differ 48: 371-380.
HAYASHI, T., SHIBATA, N., OKUMURA, R., KUDOME, T., NISHIMURA, O., TARUI, H. and AGATA, K. (2010). Single-cell gene profiling of planarian stem cells us-ing fluorescent activated cell sortus-ing and its “index sortus-ing” function for stem cell research. Dev Growth Differ 52: 131-144.
ISSHIKI, T., PEARSON, B., HOLBROOK, S. and DOE, C.Q. (2001). Drosophila neuroblasts sequentially express transcription factors which specify the temporal identity of their neuronal progeny. Cell 106: 511-521.
JUNG, S.O., LEE, J.Y. and KIM, J. (2001). Yeast ribosomal protein S3 has an endo-nuclease activity on AP DNA. Mol Cells 12: 84-90.
LEE, C.H., KIM, S.H., CHOI, J.I., CHOI, J.Y., LEE, C.E. and KIM, J. (2002). Electron paramagnetic resonance study reveals a putative iron-sulfur cluster in human rpS3 protein. Mol Cells 13: 154-156.
ORII, H., SAKURAI, T. and WATANABE, K. (2005). Distribution of the stem cells (neoblasts) in the planarian Dugesia japonica. Dev Genes Evol 215: 143-157. PEARSON, B.J. and SÁNCHEZ ALVARADO, A. (2010). A planarian p53 homolog
regulates proliferation and self-renewal in adult stem cell lineages. Development 137: 213-221.
PELLETTIERI, J., FITZGERALD, P., WATANABE, S., MANCUSO, J., GREEN, D.R. and SÁNCHEZ ALVARADO, A. (2009). Cell death and tissue remodeling in pla-narian regeneration. Dev Biol 338: 76-85.
POLAKIEWICZ, R.D., MUNROE, D.J., SAIT, S.N., TYCOWSKI, K.T., NOWAK, N.J., SHOWS, T.B., HOUSMAN, D.E. and PAGE, D.C. (1995). Mapping of ribosomal protein S3 and internally nested snoRNA U15A gene to human chromosome 11q13.3-q13.5. Genomics 25: 577-580.
ROSSI, L., SALVETTI, A., LENA, A., BATISTONI, R., DERI, P., PUGLIESI, C., LORETI, E. and GREMIGNI, V. (2006). DjPiwi-1, a member of the PAZ-Piwi gene family, defines a subpopulation of planarian stem cells. Dev Genes Evol 216: 335-346. ROSSI, L., SALVETTI, A., MARINCOLA, F.M., LENA, A., DERI, P., MANNINI, L.,
BATISTONI, R., WANG, E. and GREMIGNI, V. (2007). Deciphering the molecular machinery of stem cells: a look at the neoblast gene expression profile. Genome
Biol 8: R62.
ROUHANA, L., SHIBATA, N., NISHIMURA, O. and AGATA, K. (2010). Different re-quirements for conserved post-transcriptional regulators in planarian regeneration and stem cell maintenance. Dev Biol 341: 429-443.
SAKURAI, T., LEE, H., KASHIMA, M., SAITO, Y., HAYASHI, T., KUDOME-TAKAMATSU, T., NISHIMURA, O., AGATA, K. and SHIBATA, N. (2012). The planarian P2X homolog in the regulation of asexual reproduction. Int. J. Dev. Biol. 56: 173-182. (doi: 10.1387/ijdb.113439ts).
SALVETTI, A., ROSSI, L., DERI, P. and BATISTONI, R. (2000). An MCM2-related gene is expressed in proliferating cells of intact and regenerating planarians.
Dev Dyn 218: 603-614.
SALVETTI, A., ROSSI, L., LENA, A., BATISTONI, R., DERI, P., RAINALDI, G., LOCCI, M.T., EVANGELISTA, M. and GREMIGNI, V. (2005). DjPum, a homologue of
Drosophila Pumilio, is essential to planarian stem cell maintenance.
Develop-ment 132: 1863-1874.
SÁNCHEZ ALVARADO, A. and NEWMARK, P.A. (1999). Double-stranded RNA specifically disrupts gene expression during planarian regeneration. Proc Natl
Acad Sci USA 96: 5049-5054.
SATO, K., SHIBATA, N., ORII, H., AMIKURA, R., SAKURAI, T., AGATA, K., KO-BAYASHI, S. and WATANABE, K. (2006). Identification and origin of the germline stem cells as revealed by the expression of nanos-related gene in planarians.
Dev Growth Differ 48: 615-628.
SHIBATA, N., ROUHANA, L. and AGATA, K. (2010). Cellular and molecular dissection of pluripotent adult somatic stem cells in planarians. Dev Growth Differ 52: 27-41. SHIBATA, N., UMESONO, Y., ORII, H., SAKURAI, T., WATANABE, K. and AGATA,
K. (1999). Expression of vasa(vas)-related genes in germline cells and totipotent somatic stem cells of planarians. Dev Biol 206: 73-87.
TASAKI, J., SHIBATA, N., NISHIMURA, O., ITOMI, K., TABATA, Y., SON, F., SUZUKI, N., ARAKI, R., ABE, M., ATAGA, K. and UMESONO, Y. (2011) ERK signaling controls blastema cell differentiation during planarian regeneration. Development 138: 2417-2427
UMESONO, Y., WATANABE, K. and AGATA, K. (1997). A planarian orthopedia homolog is specifically expressed in the branch region of both the mature and regenerating brain. Dev Growth Differ 39: 723-727.
WILSON, A., OSER, G.M., JAWORSKI, M., BLANCO-BOSE, W.E., LAURENTI, E., ADOLPHE, C., ESSERS, M.A., MACDONALD, H.R. and TRUMPP, A. (2007). Dormant and self-renewing hematopoietic stem cells and their niches. Ann N Y Acad Sci 1106: 64-75.
YADAVILLI, S., MAYO, L.D., HIGGINS, M., LAIN, S., HEGDE, V. and DEUTSCH, W.A. (2009). Ribosomal protein S3: A multi-functional protein that interacts with both p53 and MDM2 through its KH domain. DNA Repair (Amst) 8: 1215-1224. YOSHIDA-KASHIKAWA, M., SHIBATA, N., TAKECHI, K. and AGATA, K. (2007).
DjCBC-1, a conserved DEAD box RNA helicase of the RCK/p54/Me31B family, is a component of RNA-protein complexes in planarian stem cells and neurons.
Planarian regeneration: achievements and future directions after 20 years of research
Emili Saló, Josep F. Abril, Teresa Adell, Francesc Cebriá, Kay Eckelt, Enrique Fernández-Taboada, Mette Handberg-Thorsager, Marta Iglesias, M Dolores Molina and Gustavo Rodríguez-Esteban
5 yr ISI Impact Factor (2010) = 2.961
Int. J. Dev. Biol. (2009) 53: 1317-1327
Expression of a retinal homeobox (Rx) gene during planarian regeneration
Linda Mannini, Paolo Deri, Jacopo Picchi and Renata Batistoni Int. J. Dev. Biol. (2008) 52: 1113-1117
From Planarians to Mammals - the many faces of regeneration
Jerzy Moraczewski, Karolina Archacka, Edyta Brzoska, Maria-Anna Ciemerych, Iwona Grabowska, Katarzyna Janczyk-Ilach, Wladyslawa Streminska and Malgorzata Zimowska Int. J. Dev. Biol. (2008) 52: 219-227
Expression of DjXnp, a novel member of the SNF2-like ATP-dependent chromatin remodelling genes, in intact and regenerating planarians
Leonardo Rossi, Paolo Deri, Ilaria Andreoli, Vittorio Gremigni, Alessandra Salvetti and Renata Batistoni
Int. J. Dev. Biol. (2003) 47: 293-298
Effects of activators and antagonists of the neuropeptides substance P and substance K on cell proliferation in planarians