Tectonic history of Europa: Coupling between internal evolution and surface
stresses
Jun Kimura1, Yasuko Yamagishi2, and Kei Kurita1
1Earthquake Research Institute, University of Tokyo, 1-1-1 Yayoi, Bunkyo-ku, Tokyo 113-0032, Japan 2Institute for Research on Earth Evolution, Japan Agency for Marine-Earth Science and Technology, Yokosuka, Japan
(Received December 19, 2005; Revised October 3, 2006; Accepted October 4, 2006; Online published March 21, 2007)
A stress history in the ice shell of Europa is presented. Europa’s surface is ubiquitous in extensional tectonic features such as banded terrains. These surface features suggest that the surface may have been fractured and extended due to tensional stress, and various origins for such stresses have been proposed. We have focused on the solidification of the liquid water layer and the accompanying volume change as one of the dominant sources for such stresses. To estimate the stress state in the ice shell, we first performed numerical simulations of the thermal history. Based on the resulting structural evolution, we calculated stresses in the viscoelastic ice shell due to the solidification of the liquid layer. Europa’s liquid layer solidifies slowly and may partially survive at present, and its solidification induces sufficient tensional stress to drive extensional tectonic activity. Consequently, we propose the tectonic scenario that the volume change due to phase change develops the basic amplitude of the stress, while tidal forces work as a trigger to fracture the surface.
Key words:Thermal history, tectonics, crustal stress, structural evolution.
1.
Introduction
Some of the icy satellites display many surface features suggestive of a variety of tectonic activity. Recently, the Galileo spacecraft acquired many surface images of Jovian icy satellites at high resolution and revealed morphologi-cal characteristics of surface features. The most prominent feature of the icy satellites is an extensional fractured signa-ture. One evident example is the banded terrain on Europa, consisting of straight or curved stripes, some of which are wedge-shaped. These features are interpreted as locations where the ice shell was fractured and dilated, then filled in with darker material at a later stage (Schenk and McKinnon, 1989; Pappalardo and Sullivan, 1996; Sullivanet al., 1998; Tufts et al., 2000; Prockter et al., 2002). Narrow ridges are also generally considered to be formed due to exten-sional fracturing (Greenberget al., 1998). Europa’s surface has been extensively modified by these ubiquitous tectonic structures. While these extensional features are present, compressional features or convergence regions compensat-ing for surface extension have not been well-recognized (Prockter and Pappalardo, 2000; Greenberg, 2004). These characteristics suggest that the satellite has undergone a net global expansion. One of the most enigmatic problems as-sociated with the icy satellites is the origin of this tectonic activity. The aim of this work is an evaluation of the tec-tonic stress induced due to phase changes in H2O and the
accompanying volume changes.
Various origins for extensional stress have been pro-posed. The first one is solid state convection in the ice
Copyright cThe Society of Geomagnetism and Earth, Planetary and Space Sci-ences (SGEPSS); The Seismological Society of Japan; The Volcanological Society of Japan; The Geodetic Society of Japan; The Japanese Society for Planetary Sci-ences; TERRAPUB.
shell. As a driving force for tectonism, the generated ten-sional stress must exceed the mechanical strength of the ice shell, estimated to be of order 1 MPa from experimental re-sults (Hobbs, 1974; Gold, 1977). However, Squyres and Croft (1986) and McKinnon (1998) concluded that convec-tive stress would be on the order of 0.01–0.1 MPa, which is too low to fracture the surface.
Tidal deformation may also be effective as a stress source. Surface tensional stress due to diurnal tidal defor-mation (Greenberget al., 1998) and nonsynchronous rota-tion (Helfenstein and Parmentier, 1985; Leith and McKin-non, 1996) on Europa have been estimated to be about 0.1 MPa at a maximum. While these stress sources seem insuf-ficient to induce surface fracture, there is plenty of evidence that orientations of bands and ridges are consistent with pat-terns estimated from theoretical models of tidal deformation (e.g., Greenberget al., 1998). Therefore, no decisive con-clusion as to the stress sources for tectonic activity has been obtained yet.
In terms of a volume change, three plausible causes are considered—differentiation, temperature change, and phase changes. Differentiation of H2O and the rocky component
in the satellite that initially accreted as a homogeneous mix-ture possibly released a large amount of heat, yielding large-scale melting; hence, traces of tectonism would have been erased. Thermal stress is also proposed as another source of volume expansion by Hiller and Squyres (1991), and they estimated the change in temperature in small-sized undif-ferentiated satellites. However, both processes should have occurred at an early stage, when the ice shell was incom-pletely formed and continuously disrupted by impacts of small bodies. Therefore, it is doubtful that these processes contributed to the volume expansion responsible for the
Fig. 1. Phase diagram of H2O in the pressure range 0–1.2 GPa. Dotted
vertical line indicates pressure at the boundary between H2O layer and
core for Europa. Dotted line indicates initial temperature for calculation of thermal history in Europa (adiabatic).
Fig. 2. Sketch of solidification of liquid H2O layer in Europa. As
solidification of liquid layer and formation of ice Ih shell proceeds, a significant volume change arises. Satellite’s surface tends to extend and to experience tensional hoop stress.
tensional features that we see at present. Zuber and Par-mentier (1984) calculated the stress for Ganymede due to temperature change and the solid-solid phase change of ice. However, the solidification of the liquid layer was not con-sidered, and the icy satellites should have had a liquid layer initially in their history.
Phase change (i.e., the solidification of liquid water) is another source of stress which may have contributed to the formation of extensional features on differentiated icy satel-lites. Icy satellites with a radius of more than several hun-dreds of kilometers should have achieved the release of ac-cretional energy in the early stages of their history and so initially retain a liquid H2O layer (Lunine and Stevenson,
1982; Kuramoto and Matsui, 1994). Solidification of the liquid layer should have progressed with subsequent cool-ing, and the ice shell must have grown. The volume expan-sion due to the solidification of liquid water to low-pressure ice is up to 10%. Although thermal contraction arises as the solid ice gets cooler (Nimmo, 2004), the effect of the solid-ification is much larger than that due to such a temperature change. Nevertheless, there have been few studies evalu-ating the stress in the ice shell and its time variation (see Fig. 2). An important point to note is that any evaluation of the stress history due to solidification of the liquid wa-ter layer is strongly coupled to the thermal history. Squyres
(1982) calculated the whole volume change of Ganymede due to solidification of the liquid layer. However, this eval-uation was not based on the results of a thermal history. Moreover, relaxation of stress as well as its accumulation is inevitable because of the viscoelasticity of ice. Since the time scale for stress build-up due to the solidification is long, the ice shell should be treated as a viscoelastic mate-rial. Although Nimmo (2004) considered the ice-water vol-ume change and calculated stresses in a viscoelastic shell, his evaluation of the process was not based on a thermal history.
In this work, the solidification rate of the liquid layer in Europa is determined by calculation of the thermal history, because the tectonic stresses generated in the ice shell due to solidification of the liquid layer strongly depend on the so-lidification rate. In other words, we must consider the cou-pling between the satellite’s thermal history and its tectonic history. We treat only pure H2O as the material composing
the outer layer of Europa in this work.
The goal of this paper is to evaluate the tectonic stress and discuss the scenario of tectonic activity on Europa. To attain the goal of this study, the following approach was used. Section 2 provides an outline of the thermal history model for estimating the solidification rate of the liquid layer as well as the concepts for calculation of generated stresses in the shell and explains the numerical procedure. In Section 3, we show the results for the solidification rate of the liquid layer and the tectonic stress induced due to solidification of the liquid layer. Finally, in Section 4, we discuss the role of stress sources for tectonic activity and the relation between the time scale for the relaxation of stress and the surface viscosity.
2.
Model
2.1 Solidification rate of the liquid water layer
In order to evaluate the stress history, we need to con-strain the solidification rate of the liquid water layer, which strongly depends on a viscous structure of the ice shell. The controlling parameter is the melting-point viscosity of ice η0.
2.1.1 Initial structure and heat transfer model We assume that Europa has a radiusRs =1565 km and a metal-rock mixed core radius of Rc =1400 km. This structural model is consistent with the gravity data, and this data can-not distinguish between a differentiated core and an undif-ferentiated one (Andersonet al., 1998). In the initial state there is no solid ice shell, and the primitive liquid layer overlies the solid core. The temperature at the surface of the liquid layer is fixed at the zero-pressure melting tem-perature. Since the primitive liquid layer should vigorously convect due to rapid cooling from the surface, the liquid layer has an adiabatic temperature gradient. The core is ini-tially isothermal with the temperature at the boundary with the overlying liquid layer. Such an initial structure of tem-perature is consistent with the model for the Galilean satel-lites formation (Lunine and Stevenson, 1982; Kuramoto and Matsui, 1994).
Table 1. Physical properties of core and of liquid layer.
Layer Parameter Symbol Unit Value
Liquid layer Density ρw kg m−3 1000
Thermal conductivity kcc Wm−
1K−1 3.0 flux, and Qis the heat production rate. In the liquid water layer, we adopt parameterized convection theory to estimate convective heat flux and a simple energy balance without heat source. Thus, Eq. (1) yields
ρwCpw where the suffixwimplies the liquid water, Rsh is the po-sition of the boundary between the ice shell and the liquid water layer. The heat fluxes at the topFTand the bottomFB of the liquid layer are obtained from the Nusselt number-Rayleigh number relationship. We use the local number-Rayleigh number Ral and the local Nusselt number N ul, which are defined by following equations (Honda, 1996),
Ral ≡ ρα the top and bottom thermal boundary layer, the thickness of the liquid layer, the thermal diffusivity, and the viscosity, respectively. The suffixl implies the local value (lis either T: top, or B: bottom). Ralc is the critical Rayleigh number
for the onset of convection, and it is about 103. β is a
constant, and boundary layer theory gives a value of 1/3; for turbulent convection (Ral ≥ 1011),β = 2/7 are used. Values of other parameters are summarized in Table 1. Heat fluxes of the top and bottom of the liquid layer are given by
Fl=Fcond·N ul (4)
Fcond =kw Tl
D . (5)
Heat transfer equation in the solid region, which are the ice shell and the core, is given by
F=Fcond+Fconv (6)
wherekcis the thermal conductivity andkvis the effective thermal conductivity due to thermal convection. It is diffi-cult to estimate the local Rayleigh number because viscos-ity of ice depends strongly on the temperature normalized by melting temperature, and the application of the parame-terized convection theory is limited. Moreover, tidal dissi-pation acting as a heat source in the ice shell strongly de-pends on the local viscosity of ice. Therefore, we estimate convective heat fluxFconvby the mixing length formulation extended to highly viscous fluids (Sasaki and Nakazawa, 1986; Abe, 1993). Thus, the effective thermal conductivity
kvis given as follows:
kv=
where is the mixing length andν is the local kinematic viscosity. We take the mixing length as the distance from the nearest boundary of the convective layer. Values of parameters for the core are summarized in Table 1.
To calculate the solidification rate of the liquid water layer, we solve a moving boundary problem (Stefan prob-lem). The equation for energy balance at the phase bound-ary is
ρshL
d Mi
dt =Fli q−Fsol, (11)
where ρsh is the density of the ice shell, L is the latent heat, Mi is the position of phase boundary, Fli q and Fsol are the heat flow from the liquid layer and the solid layer, respectively. The temperature at the phase boundary is fixed at the melting point according to a pressure condition. We approximate the ice liquidus by the linear relation
Tm=
d Tm
d P P+Tm0, (12)
whereTmis the melting temperature of ice,Pis the pressure and Tm0 is Tm at zero pressure. Values of parameters are
summarized in Table 2.
Table 2. Physical properties of ice Ih.
Parameter Symbol Unit Value
Densitya ρ kg m−3 930
Latent heata L kJ kg−1 284
Melting temperature at P = 0b Tm0 K 273.2
Slope of melting temperatureb d T
m/d P 10−7K Pa−1 −1.063 aHobbs (1974)
bSotinet al.(1998)
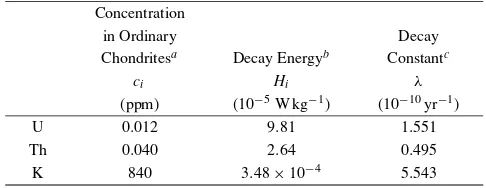
Table 3. Concentration, energy production, and decay constants of radiogenic elements. Concentration
in Ordinary Decay
Chondritesa Decay Energyb Constantc
ci Hi λ
(ppm) (10−5W kg−1) (10−10yr−1)
U 0.012 9.81 1.551
Th 0.040 2.64 0.495
K 840 3.48×10⁻⁴ 5.543
aMason (1971)
bTurcotte and Schubert (2002) cSteiger and Jager (1977)
source term accompanying radioactive decay is described as follows:
Qr adi o=
ciHiexp(−λit) , (13) whereci is the concentration, Hi is the heat release of the isotope,λiis the decay constant,iis the type of isotope, and
t is time before the present. These values are summarized in Table 3 (Schubertet al., 1986).
Within the ice shell, tidal heating is considered. The tidal heating rate in the solid core would be smaller than in the ice shell because it is mechanically decoupled from the ice shell by the liquid layer and, therefore, the core undergoes less deformation. We can evaluate the volumetric tidal heating rate using a Maxwell viscoelastic model (e.g., Segatzet al., 1988; Ojakangas and Stevenson, 1989). The average volumetric dissipation rate strongly depends on the temperature, and it can be calculated by (Showman and Han, 2004)
Qti de = ε
2 0ω2ηsh 2
1+ω
2η2
sh μ2
, (14)
whereω = 2.05×10⁻⁵s−1 is the frequency of Europa’s
tidal flexing, and μis the shear modulus of the ice shell. ηsh is the temperature-dependent viscosity of the ice shell, which is determined later. ε0 = δ/R is the amplitude of
tidal flexing strain during the tidal cycle, where δ is the amplitude of radial deflection due to tidal deformation and
R = 1565 km is Europa’s radius. For the generally ac-cepted structure of Europa, which consists of the ice shell, the internal liquid layer, and the core, the peak radial de-formation of the surface during a tidal cycle is about 30 m (Moore and Schubert, 2000). Although the amplitude of the tidal deformation depends on latitude and longitude, our simulations used ε0 = 1× 10⁻⁵ (corresponding to
δ = 16 m) as a globally average value fixed in space and time. Finally, the tidal dissipation rate mainly depends on the viscosity profile in the ice shell.
Physical properties in the core are assumed to be constant except for the viscosity. We consider that the viscosity is temperature dependent and is described by
ηc=η0c exp
a
Tmc T
, (15)
whereη0c anda are constants, andTmc is the melting
tem-perature. We adoptη0c = 4.9×10
8 Pa s,a = 23.25, and Tmc =1600 K (Karatoet al., 1986).
In the ice shell, the temperature dependence of thermal properties is considered. Specific heat, thermal conduc-tivity, and the thermal expansion coefficient are given by (Hobbs, 1974)
Cpsh =7.037T +185.0 (16)
kcsh =
488.12
T +0.4685 (17)
αsh =3.0×
2.5×10−7T −1.25×10⁻⁵. (18) Heat transfer in the ice shell is greatly affected by the tem-perature dependence of viscosity, which is well approxi-mated by the following equation
ηsh=η0 exp
A
Tm
T −1
. (19)
The activation parameter Ais usually taken to be between 18 and 36, which corresponds to an activation energy be-tween about 40 and 80 kJ mole−1, and in this work we use
25 kJ mole−1 (Goldsby and Kohlstedt, 2001). As for the
viscosity at the melting temperatureη0, we use a range of
Fig. 3. Conceptual model for evaluation of stress generated during ad-vance of phase boundary in Europa. Rold is position of liquid-solid
phase boundary. ShellRold–Rwis region undergoing phase change, as determined by Stefan’s solution. Because of volume increase by fac-tor of 1.09 during solidification, phase boundary under zero pressure moves toR∗.Rnewis position of new actual boundary as determined by equilibrium of pressure at the boundary.
Table 4. Parameters of elastic constants for the satellite.
Bulk Shear
modulus modulus
K(Pa) μ(Pa) Core 1.85×10¹¹ 1.2×10¹¹
Liquid layer 2.0×10⁹ 0.0
Ice shell 1.0×10¹⁰ 3.3×10⁹
2.2 Evaluation of the tectonic stress in the ice shell due to solidification of the liquid layer
We assume that Europa is spherically symmetric and is composed of three concentric, homogeneous shells. Spher-ical coordinates (r, θ, φ) are used with the origin at the satellite’s center.
We firstly assume that each layer is perfectly elastic and has homogeneous properties. We consider the solidification of a liquid water layer occupying the regionRoldtoRwin a unit time interval (Fig. 3). Because the liquid H2O increases
its volume by a factor of 1.09 during solidification, the position of the bottom of the ice shell is no longer Rw. It must be located at an inner position R∗, which satisfies the mass balance equation,
R3∗ =R3old− ρl ρs
R3old−Rw3
, (20)
whereρl andρs are the density of liquid and solid H2O,
respectively. Thus, the newly solidified ice would overlap the liquid layer. In response, the two phases are stressed to deform. One is a system in which the liquid layer pushes on the ice shell, and the other is a system in which the ice shell pushes back on the liquid layer (see Fig. 3). The place where both pressures balance should be the new actual boundary between the liquid layer and the ice shell Rnew, and thus an excess pressure is generated. According to the equilibrium equations of elastic bodies (e.g., Landau and Lifshitz, 2000), the radial displacementur(r)and the
Fig. 4. Vertical profiles of nondimensionalized temperature (solid line, left axis), conductive (dashed line) and convective heat flux (dotted line, right axis) with in the ice shell for a typical snapshot of a numerical calculation of the thermal history. The thickness of the upper cold litho-sphere which the tectonic stress concentrates is determined as a region where the convective heat flux becomes zero (gray region) (Davaille and Jaupart, 1994).
stress components σrr(r), σθθ(r)andσφφ(r)produced in each layer can be described (see Appendix). Our model considers the deformation of the liquid layer and the core. Elastic constants are summarized in Table 4. From the following boundary conditions
1) free surfaceσrr1(r)=0 atr =Rs 2) normal stressσrr1(r)= −Pl atr =R∗ 3) normal stressσrr2(r)= −Psh atr =Rw 4) continuityur2(r)oc=ur2(r)c atr =Rc 5) no displacementur2(r)c=0 atr=0,
where Psh and Pl are the excess pressure at the upper boundary of the liquid layer and at the lower boundary of the ice shell, respectively, and Rc is the radius of the solid core, we obtain the elastic solutions forur(r),σrr(r), σθθ(r), andσφφ(r), which are given in the Appendix.
The excess pressures Psh and Pl will balance as Pnew at the boundary between the liquid layer and the ice shell
Rnew. The deformation of each domain at the boundary is given byur1=Rnew−R∗andur2=Rnew−Rw(see Fig. 3).
Using these equations and setting Psh = Pl = Pnew, the internal excess pressure is obtained as follows:
Pnew=
R∗−Rw C1−C2−(C3·C4)
, (21)
whereC1,C2,C3,C4, and the equilibrium position of the
phase boundaryRneware given in the Appendix.
the interface of the thermal boundary layer. We assume the asthenosphere behaves as a viscous fluid layer and that the internal excess pressure is supported by the lithosphere. In this convective case, new boundary conditions prescribing the continuity of radial stress and displacement are required. Since we consider the solid layer to be a Maxwell medium, the viscoelastic solution can be obtained from the elastic expressions by the correspondence principle. We therefore make the substitution into the elastic solutions
μsh→ ˜μ(s)= μshs
s+1/τ, (22)
wheresis the Laplace variable,τ =ηsh/μshis the charac-teristic Maxwell time, and ηsh is the viscosity of the ice shell, which will be described later. We then introduce the step-like source function P(t) = PnewH(t), giving the excess pressure in the liquid layer. According to the correspondence principle, we obtain the Laplace transform
˜
P(s) = ˜Pnew(s)/s, where P˜new(s)is described in the Ap-pendix.
By substituting Eq. (22) into the elastic solution Eqs. (A.14) and (A.15), we obtain the viscoelastic solution of the converted problem in thes-spaceσ˜rr(s),σ˜θθ(s), andσ˜φφ(s). Finally, using Laplace inversion we obtain the solutions for the tectonic stress components as functions of time;
σrr(r,t)=
whereDandδare given in the Appendix.
The incremental model for stress evaluation in this work may underestimate the stress state in the ice shell, because a thin, stress-free shell is added during a unit time interval. However, this effect can be suppressed by making the time step sufficiently small.
Note that large uncertainty exists for the viscosity of the ice shellηsh when one considers the competition between the accumulation and relaxation of induced stresses due to viscoelastic behavior. Since the purpose of this work is to discuss the occurrence of tectonic activity at the sur-face, a viscosity value at the surface is necessary. Passey and Shoemaker (1982) calculated a surface viscosity for Ganymede of about 1×1025 Pa s, based on viscous
relax-ation of observrelax-ational topography of impact craters. Be-cause the Maxwell time calculated from this surface viscos-ity is about 100 Myr and the growth of the ice shell is not so rapid—which will be shown next section—viscoelastic treatment is essentially important for this problem. On this basis, we use values from 1023 to 1027 Pa s for stress eval-uation. In calculations of the thermal history, Eq. (19) for the viscosity of the ice shell are used and it yields a surface value of about 1032Pa s using an expected surface tempera-ture of 100 K. This value is extremely large and seems to be an overestimation, while Eq. (19) is a good approximation of viscosity in the range of higher temperatures relatively near the melting point. However, in calculating the thermal
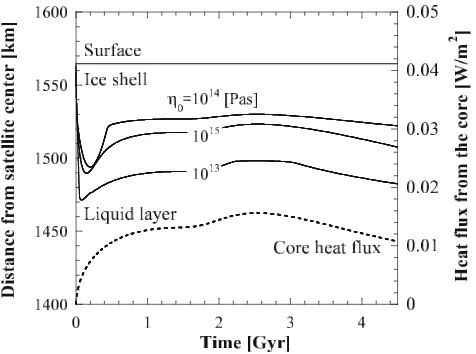
Fig. 5. Position of boundary between ice shell and liquid layer in Europa as function of time, for melting-point viscosity of iceη0of 1015, 1014,
and 1013Pa s. Satellite’s radius is 1,565 km and core radius is 1,400 km. Heat flux from the core is also shown (dotted line) for the calculation usingη0=1015Pa s. Even in case using other values ofη0, these have
almost same trends.
history, differences in viscosity structure near the surface should not affect the heat transfer, and we use the viscos-ity structure which follows Eq. (19) through to the surface. This is because heat transport near the surface, where vis-cosity is large, is always controlled only by conduction, re-gardless of the exact viscosity.
3.
Results
We begin by showing the solidification of the liquid layer in three cases of the melting point viscosity of iceη0,
fol-lowed by showing the evolution of surface stress for several values of the surface viscosities ηs. As last, we mention the thermal history of the core and discuss the effect of the initial temperature profile.
3.1 Solidification of liquid layer
Results of structural evolution are presented in Fig. 5 as a function of the melting point viscosity of iceη0(Eq. (19))
from 1013to 1015Pa s. The curves in these figures show the boundary between the ice shell and the liquid layer versus time, and temporal change of heat flux from the core is also shown. First, we discuss Fig. 5 forη0 =1015 Pa s, in
detail. Snapshots of the temperature profiles in the ice shell and the core are shown in Figs. 6(a) and 7, respectively. The solidification scenario can be divided into the following stages:
(1) The liquid layer begins to solidify and the ice shell grows rapidly. Solidification continues until heat transport through the ice shell balances with heat flux from the core at 1.5×10⁸ years. Heat transport in the ice shell is
en-tirely dominated by conduction because the viscosity of the shell is relatively high and solid-state convection can hardly occur (Fig. 6(a)).
Fig. 6. Temperature profiles in ice shell of Europa (cf. Fig. 5), with melting-point viscosity of iceη0of 1015Pa s (a), 1014Pa s (b), and 1013
Pa s (c).
ceases. Thereafter, radiogenic heating in the core continues to increase, and which leads to a thinner ice shell.
(3) In the core, when the temperature gradient becomes large, solid-state convection occurs at 1.6 × 10⁹ years.
Thereafter, the heat flux from the core into the liquid layer further increases, and the thickness of the ice shell further decreases.
Fig. 7. Temperature profiles in the core of Europa, corresponding to Fig. 6(a) with melting-point viscosity of iceη0of 1015Pa s.
(4) The radiogenic heat source in the core becomes de-pleted, and the satellite enters a cooling stage at 2.5×10⁹ years. The liquid layer begins gradually to solidify again.
Figure 5 indicates that a liquid layer with a thickness of 85–110 km is preserved at present under an ice shell that is 40–80 km thick. As the ice shell grows, the temperature difference through the liquid layer increases in accordance with a negative gradient of the melting curve of ice Ih, because the temperature at the bottom of the ice shell is fixed at the melting point. The liquid layer directly contacts the core and is heated due to heat generation in the core: therefore convection occurs in the liquid layer and heat from the core can be efficiently transported to the ice shell. In the ice shell, the heat transport is controlled only by conduction throughout the satellite’s history (Fig. 6(a)), and the ice shell cannot so effectively remove the heat from inside. Therefore, solidification of the liquid layer proceeds very slowly in Europa.
Fig. 8. Tangential stress (tension) at Europa’s surface due to solidification of liquid layer and accompanying volume change, for melting-point viscosity of iceη0of 1015Pa s (a), 1014Pa s (b), and 1013 Pa s (c).
Amplitude of tensional stress is shown as a function of time and surface viscosityηs. Stress is calculated for period in which Europa enters
solidification stage of liquid layer, after about 2.5×10⁹years (a and b) and 3.0×10⁹years (c). Dashed line with square-dots is perfectly
elastic solution.
For a melting-point viscosity of 1014 Pa s (Fig. 5),
al-though the overall evolution is similar to the previous case, the average thickness of the ice shell and the solidification rate are smaller. This is because the large dissipative
re-gion in the ice shell is more widespread than in the case of η0=1015Pa s, and thus tidal heating in the ice shell is more
effective. During solidification stage 1, solid-state convec-tion occurs in the ice shell (Fig. 6(b)). While the efficiency of heat transfer through the ice shell increases due to con-vection, tidal heating is enhanced and the temperature gra-dient near the base of the ice shell diminishes. Therefore, the equilibrium thickness of the ice shell at the end of solid-ification stage 1 is not so different from the previous case. Even if tidal heating is neglected, the liquid layer can sur-vive through to the present because the ice shell is largely stable with respect to solid-state convection throughout the satellite’s history, as in the case ofη0 =1015Pa s, and thus
the efficiency of heat transfer through the ice shell is not so effective.
In the case ofη0 = 1013 Pa s (Fig. 5), the ice shell is
largely unstable to solid-state convection. Although the rate of heat transfer through the ice shell is considerably larger and the ice shell becomes thicker than in previous cases, the tidal heating rate increases because of the warm convective asthenosphere in which the dissipation rate is large. The ice shell starts to convect when its whole thickness exceeds about 25 km, and the convective asthenosphere and conduc-tive lithosphere are clearly developed as the ice shell grows. Figure 6(c) shows that thermal boundary layers exist at the lower and upper regions of the ice shell. The conductive lithosphere cannot be discerned in Fig. 6(c), but it is dis-tinguished from the upper thermal boundary layer by the definition described in the previous chapter. Tidal dissipa-tion becomes intense in the region at the base of the ice shell through the convective asthenosphere, and the tem-perature of the asthenosphere increases. Because the large dissipative region will spread as the ice shell grows, the as-thenosphere will get warmer and the lithosphere will be-come thinner. The temperature gradient at the base of the ice shell will decrease, and the efficiency of heat transport from inside will weaken. Consequently, the liquid layer is prevented from completely freezing. Note that if tidal heat-ing is neglected altogether, the solidification of liquid layer will proceed very rapidly, and finally it will completely freeze during solidification stage 1. Surface heat flows in the case ofη0 =1015, 1014, and 1013 Pa s are 0.01, 0.015,
0.07 mW/m2, respectively.
If a melting-point viscosity is smaller than 1012 Pa s, the liquid layer rapidly vanishes. In this case, the ice shell vig-orously convects and removes heat from inside very rapidly. Tidal heating is weak because the viscosity is too low.
3.2 Stress history of the ice shell
and shell stresses are induced, it should not contribute to the formation of the young surface features which we see at present. Moreover, for the nominal value of the surface viscosity of 1025Pa s, the Maxwell time is about 108years,
and the changing rate of ice shell thickness is very small for hundreds of millions of years before the latest stage be-gins (see Fig. 5). Hence, the accumulated stress in the early stages should largely be relaxed by the onset of the latest solidification stage. If the surface viscosity is quite large, the stress accumulated in the early stages may persist, but this remains highly unclear because the ice shell must have been damaged by impacting bodies.
Figure 8(a) shows the time variation of tectonic stress at the surface, using the result of the solidification rate of the liquid layer for the melting-point viscosity of 1015Pa s (see also Fig. 5). Viscosity at the surface ηs is taken to be from 1023 to 1027 Pa s. For large surface viscosities
(ηs =1026−27Pa s), the stress in the ice shell is almost in the elastic regime, and it is largely unrelaxed. When the surface viscosity is small, the development of surface stress is more moderate. This is because it is easy for creep to arise in the ice shell, and the effect of stress relaxation overcomes that of stress accumulation. For this melting-point viscosity, the solidification rate of the liquid layer is initially small and increases quadratically with time (see Fig. 5, after 2.5 Gyr). Hence, the tectonic stress on the surface continues to develop under the conditions of all surface viscosities.
For evaluating the possibility of extensional tectonic ac-tivity, we should compare the strength of ice with the cal-culated tensional stress. If we adopt 1 MPa as the tensile strength of ice, Fig. 8(a) shows that the generated tensional stress for the range of viscosities expected at the surface can exceed the tensile strength of ice. When the surface viscos-ity is small (ηs <1025Pa s), the generated surface stress is lower than the strength of ice. This is because the stress is relaxed over a time scale shorter than the solidification time scale.
Figure 8(b) shows the stress evolution for lower melting-point viscosity of ice,η0 =1014Pa s. Because the
solidifi-cation rate is relatively small according to the calculation of thermal history, the generated stress is slightly smaller than for the case ofη0 =1015Pa s. However, the overall stress
history is similar to the previous case, and the stress gener-ated for a range of expected surface viscosities can exceed the strength of ice.
Finally, in Fig. 8(c) we show the case ofη0 =1013 Pa s.
Solid-state convection occurs in the ice shell throughout the period of the stress calculation, and the lithosphere is formed near the surface (see Fig. 6(c)). The internal excess pressure is supported by the lithosphere, and the generated stress is concentrated in this layer. Since the solidification rate is getting smaller as time proceeds, stress relaxation becomes effective in an earlier stage and the tectonic stress begins to decrease for small surface viscosities. However, the generated stress is still sufficient to induce the tectonic activity.
All of these results for the thermal and structural evolu-tion show that the subsurface liquid layer can be maintained throughout the satellite’s history, and they are consistent with the general interpretation of the formation model of
surface features and of induced magnetic field data (e.g., Khuranaet al., 1998; Pappalardoet al., 1999; Kivelsonet al., 2000). Moreover, we have shown that the tectonic stress generated at the surface due to solidification of the liquid layer is an adequate source for tectonic activity in Europa.
In order to evaluate the tectonic stress, we assumed an ice shell with homogeneous viscosity in this work. If we con-sider the structure of temperature-dependent viscosity in the actual ice shell, the excess pressure should disperse in the lower viscosity region, and the resultant tectonic stress in this deeper region may be a little smaller. However, the essential value for the discussion of surface fracturing is the surface stress which is calculated in the region of sur-face viscosity. Because the extent of such a surficial region seems to be thin compared with the whole ice shell and the internal excess pressure finally concentrates in this thin re-gion, the induced surface stress should not be significantly depressed even if the pressure in deeper regions is some-what smaller.
3.3 Thermal history of the core
Figure 7 shows the temporal change of temperature in the core corresponding to the case ofη0 =1015 Pa s. The
temperature in the core rises with time due to the decay en-ergy of radio isotopes, and solid-state convection occurs at about 1.5 Gyr after formation of the satellite (see also dot-ted line in Fig. 5). Convection in the core starts in the upper part where the temperature gradient and the gravitational acceleration are sufficiently large, and the convective region gradually extends to the center as the temperature rises. In the cases of melting-point viscosities of 1014and 1013 Pa s, thermal evolution of the core follows a similar path.
In this work, the core starts from relatively cold state (Lu-nine and Stevenson, 1982). According to the gravitational energy associated with accretion, the initial core tempera-ture might be warmer from tens or hundreds of K (Schubert
et al., 1986). In this case until an initial warmer core would get rid of its heat, the ice shell would stay thin. However, because a timescale during which the core looses the ini-tial heat is considerably short compared with the timescale required to enter the core’s recent cooling stage, the ther-mal history follows the same trend as an initially cold case. Therefore, the initial thermal state of the core should hardly influence the thermal history and the growth rate of the ice shell after Europa enters the cooling stage.
4.
Discussions
4.1 Style of the tectonic activity on Europa: role of stress sources
ori-Fig. 9. Sketch of temporal change of tensional stress on Europa. Fig-ure shows relationship between diurnal tidal stress (sinusoidal curve) and stress due to solidification of liquid water layer (dashed line) in schematic form. If only diurnal tidal stress acts on Europa’s surface, its amplitude is not sufficient to induce extensional tectonic activity (a). We suggest that diurnal tidal stress is superimposed on stress due to so-lidification of the liquid layer (b), so that extensional tectonic activity occurs when the sum of these stresses exceeds the tensional strength of ice (dotted line). Time interval that the tensinal stress approaches strength of ice is defined as the stress build-up time.
gin and its insufficient amplitude, we propose the tectonic scenario in which the volume change due to phase change develops the basic amplitude of stress for surface tectonic activity, whereas the tidal forces work as a trigger to frac-ture and shape the surface. That is, the tectonic activity on the icy satellites is driven due to overlapping effects of these stress sources (Fig. 9).
If the surface features of Europa can be formed due only to tidal stress and/or solid-state convection, those surface activities should continue at present; changes in rotational history (e.g., variation of eccentricity) may also induce sur-face activity. However, such current geologic activity is not identified directly (Phillips et al., 2000). In other words, the present state may fall in a period in which the sum of the stresses does not exceed the strength of ice. There is a possibility that Europa entered the orbital resonance with Ganymede in past, and changes in rotational state (e.g., variation of eccentricity) may also induce surface tectonic activity. However, comparing a timescale for orbital change to that for resurfacing, the latter timescale is shorter in Eu-ropa based on the average surface age. Therefore, tectonic activities due to the past orbital resonances have not con-tributed to the present surface features.
When the sum will reach the critical amplitude, Europa will reenter an active period of global surface tectonics. The sequences of these processes will be repeated until the internal liquid layer completely solidifies. After that, the amplitude of the tidal deformation will be extremely small (Moore and Schubert, 2000), and the solid-state convection in the ice shell cannot contribute to surface manifestations (Rathbunet al., 1998). Thus, Europa may become inactive mechanically and thermally.
4.2 Time for accumulation of stress, comparison with resurfacing time
Here, we calculate the time required for accumulating tensional stresses to reach the tensile strength of ice. This time is called the stress build-up time (see, Fig. 9). We assume that when the amplitude of the generated stress
Fig. 10. Stress build-up time until tensional stress reaches the strength of ice (see also Fig. 9) is shown as function of surface viscosity. Using η0=1015Pa s for solidification of the liquid layer, the required time for
accumulating stress to reach the tensile strength of ice is about 2×10⁸
years withηs = 1026or 1027Pa s (squares). Results forη0 = 1014
(circle) or 1013Pa s (diamond) as also shown. Shaded region shows range of average surface ages, 14–130 Myr, implied by crater counts (Zahnleet al., 2003, 2004).
reaches the strength of ice (∼1 MPa), the stress is com-pletelyrelaxed with the formation of extensional fractures. When the fractures are closed and the strength of the ice shell recovers, tectonic stresses will begin to accumulate again, and the satellite should experience a next cycle of tectonic processes. In other words, tectonic activity will oc-cur after the stress build-up time. Figure 10 shows the aver-age build-up time as a function of surface viscosity of 1023
to 1027Pa s withη
0=1013−15Pa s. For example, when the
melting-point viscosity of ice is 1015 Pa s and the surface viscosity is 1027 Pa s, the build-up time is about 2×10⁸ years. Whenηs < 1025 Pa s, no build-up time exists, be-cause the tectonic stress cannot exceed the strength of ice (see Fig. 8(a)–(c)). The average surface age inferred by crater counting (Zahnle et al., 2003, 2004) is between 14 and 130 Myr, where this uncertainty is shown in Fig. 10.
If the surface viscosity is lower, the crater retention time becomes shorter and craters are easily relaxed. In the case of low surface viscosity, the actual surface age may be older than the cratering age because craters can be erased, even after surface activities cease. However, for example, the retention time of a 20 km-diameter crater in the caseηs = 1024Pa s is estimated to be of the order 109years (Squyres
and Croft, 1986), which is longer than the stress build-up time. Hence, the surface age should be controlled by the time scale of surface tectonic activity (e.g., extensional cracking and/or icy volcanism).
The average surface age is based on the estimate of im-pact rates and the paucity of craters on Europa, and this age represents the time which has passed since the last
we assumed that the accumulated stress is completely re-laxed when tectonic activity occurs, and thus the calculated model should be considered as an extreme case. Actually, accumulated stress should not be completely relaxed, so the strength of the ice shell will be recovered sooner and the tectonic activity should cease with little relaxation of stress. However, our model to calculate the stresses does not find the amount of stress relaxation during resurfacing activity, and there are no available publications on this sub-ject. Hence, the resurfacing style of Europa’s surface is not global but may bepatchy. The stress build-up time in this case should be extremely shorter than that described in Fig. 10 and the total stress should keep a value close to the strength of ice, because the accumulated tectonic stress should not be completely relaxed by tectonic activity in re-ality.
To evaluate whether the style of tectonic activity is glob-ally or patchy, the cross-cutting relationship and relative age between the tectonic features may help to solve this prob-lem. Although such relations in regional scale have been discussed (e.g., Hoppaet al., 2001; Saridet al., 2004), more detailed and globally scaled relationship from future obser-vations will be needed.
5.
Concluding Summary
As one of dominant stress sources for surface tectonic activities, we focused on the solidification of a liquid layer in icy satellites. In this work, we calculated the thermal and structural evolution of the icy satellites and evaluated the tectonic stress history due to solidification of the liquid H2O layer. In Europa, the subsurface liquid layer can only
partially solidify and can survive until the present time for the various possible conditions of the melting-point viscos-ity of ice.
Using these results for the structural evolution, we evalu-ated the tectonic stress induced in the ice shell due to solidi-fication of the liquid layer. We found the generated stress is sufficient to contribute to surface activity in comparison to the tensile strength of ice. Moreover, we proposed that sur-face tectonic activity is driven due to multiple effects of the stresses. The solidification of liquid water raises the basic amplitude of stress, and tidal deformation and/or solid-state convection in the ice shell creates the orientation and shape of surface features.
Acknowledgments. We are grateful to Kiyoshi Kuramoto and an anonymous reviewer for constructive comments. We also thank Craig R. Bina, whose suggestions improved the clarity of the descriptions very much. For this study, we have used the computer systems of the Earthquake Information Center of the Earthquake Research Institute, University of Tokyo.
Appendix. Detailed description of the tectonic
stress
Elastic case
Here, we show the detailed descriptions of the tectonic stress due to the solidification of the liquid layer. Basic equations for the radial displacement ur(r)and the stress componentsσrr(r),σθθ(r)andσφφ(r)are given as follows
where Rs is the radius of Europa, K is the bulk modulus andμ is the shear modulus. R∗ and Rw are described in Eq. (20) and Fig. 3. Suffixesshandl indicate the ice shell and the liquid layer, respectively.
Coefficientsash,bsh,al, andblin Eqs. (A.1), (A.2), and
where Kc is the bulk modulus of the solid core. The sec-ond term of the right-hand side in Eq. (A.7) represents a contribution of deformation of the core.
Expressions forC1,C2,C3, andC4in Eq. (21) are given
The equilibrium position of the interface between the ice shell and the liquid layerRnewyields
Rnew=(C1−C2)Pnew+Rw. (A.13) Elastic components of the tectonic stress in the ice shell are given by
σrr(r)=3Kshanew−4μsh
bnew
σθθ(r)=σφφ(r)=3Kshanew+2μsh
That is, the elastic solutions of the tectonic stress in the ice shell can be described as functions of the excess pressure
Pnew.
Viscoelastic case
In order to obtain the viscoelastic solutions, we make substitution Eq. (A.16) and Eq. (A.17) into Eq (22). Then,
˜
Using the inverse Laplace transform and rearranging equations, we finally obtain the viscoelastic solution for the tectonic stress in the ice shell described in Eqs. (23) and (24). The termδin Eqs. (23) and (24) is given by
Abe, Y., Thermal evolution and chemical differentiation of the terrestrial magma ocean, in Evolution of the Earth and Planets, edited by E. Takahashi, R. Jeanloz, and D. Rubie, 159 pp., American Geophysical Union, Washington DC, 1993.
Anderson, J. D., G. Schubert, R. A. Jacobson, E. L. Lau, W. B. Moore, and W. L. Sjogren, Europa’s differentiated internal structure: Inferences from four Galileo encounters,Science,281, 2019–2022, 1998. Davaille, A. and C. Jaupart, Onset of thermal convection in fluids with
temperature-dependent viscosity: Application to the oceanic mantle,J. Geophys. Res.,99, 19853–19866, 1994.
Geissler, P. E., R. Greenberg, G. Hoppa, P. Helfenstein, A. McEwen, R. T. Pappalardo, B. R. Tufts, M. Ockert-Bell, R. Sullivan, R. Greeley, M. J. S. Belton, T. Denk, B. Clark, J. Burns, J. Veverka, and the Galileo Imaging Team, Evidence for non-synchronous rotation of Europa. Na-ture,391, 368–370, 1998.
Greenberg, R., The evil twin of Agenor; Tectonic convergence on Europa,
Icarus,167, 313–319, 2004.
Greenberg, R. and S. J. Weidenschilling, How fast do Galilean satellites spin?,Icarus,58, 186–196, 1984.
Greenberg, R., P. Geissler, G. V. Hoppa, B. R. Tufts, D. D. Durda, R. Pap-palardo, J. W. Head, R. Greeley, R. Sullivan, and M. H. Carr, Tectonic processes on Europa: Tidal stresses, mechanical response, and visible features,Icarus,135, 64–78, 1998.
Gold, L. W., Engineering properties of fresh-water ice,J. Glaciology,19, 197–223, 1977.
Goldsby, D. L. and D. L. Kohlstedt, Superplastic deformation of ice: Ex-perimental observations,J. Geophys. Res.,106, 11017–11030, 2001. Helfenstein, P. and E. M. Parmentier, Patterns of fracture and tidal stresses
due to nonsynchronous rotation: Implications for fracturing on Europa,
Icarus,61, 175–184, 1985.
Hiller, J. and S. W. Squyres, Thermal stress tectonics on the satellites of Saturn and Uranus,J. Geophys. Res.,96, 15665–15674, 1991. Hobbs, P. V.,Ice Physics, Oxford University Press, London, 1974. Honda, S., Local Rayleigh and Nusselt numbers for cartesian convection
with temperature-dependent viscosity,Geophys. Res. Lett.,23, 2445– 2448, 1996.
Hoppa, G. V., B. R. Tufts, R. Greenberg, T. A. Hurford, D. P. O’Brien, and P. E. Geissler, Europa’s rate of rotation derived from the tectonic sequence in the Astypalaea region,Icarus,153, 208–213, 2001. Hussmann, H., T. Spohn, and K. Wieczerkowski, Thermal equilibrium
states of Europa’s ice shell: Implications for internal ocean thickness and surface heat flow,Icarus,156, 143–151, 2002.
Karato, S., M. S. Peterson, and J. D. FitzGerald, Rheology of synthetic olivine aggregates: Influence of grain size and water,J. Geophys. Res., 91, 8151–8176, 1986.
Khurana, K. K., M. G. Kivelson, D. J. Stevenson, G. Schubert, C. T. Russell, R. J. Walker, and C. Polanskey, Induced magnetic field as evidence for subsurface oceans in Europa and Callisto,Nature,395, 777–780, 1998.
Kivelson, M. G., K. K. Khurana, C. T. Russell, M. Volwerk, R. J. Walker, and C. Zimmer, Galileo magnetometer measurements: A stronger case for a subsurface ocean at Europa,Science,289, 1340–1343, 2000. Kuramoto, K. and T. Matsui, Formation of a hot proto-atmosphere on the
accreting giant-icy-satellite: Implications for the origin and evolution of Titan, Ganymede and Callisto,J. Geophys. Res.,99, 21183–22120, 1994.
Landau, L. and E. Lifshitz,Theory of Elasticity, 3rd ed., Pergamon Press, Oxford, 2002.
Leith, A. C. and W. B. McKinnon, Is there evidence for polar wander on Europa?,Icarus,120, 387–398, 1996.
Lunine, J. and D. J. Stevenson, Formation of the Galilean satellites in a gaseous nebula,Icarus,52, 14–39, 1982.
Mason, B.,Handbook of Elemental Abundances in Meteorites, New York, Gordon and Breach, 1971.
McKinnon, W. B., Geodynamics of icy satellites, inSolar System Ices, edited by B. Schmittet al., pp. 525–550, Kluwer Academic Press, Dordrecht, 1998.
Moore, W. B. and G. Schubert, Note: The tidal response of Europa,Icarus, 147, 317–319, 2000.
Nimmo, F., Stresses generated in cooling viscoelastic ice shells: Appli-cation to Europa,J. Geophys. Res.,109, doi:10.1029/2004JE002347, 2004.
Ojakangas, G. W. and D. J. Stevenson, Thermal state of an ice shell on Europa,Icarus,81, 220–241, 1989.
Pappalardo, R. T. and R. J. Sullivan, Evidence for separation across a gray band on Europa,Icarus,123, 557–567, 1996.
Pappalardo, R. T., M. J. S. Belton, H. H. Breneman, M. H. Carr, C. R. Chapman, G. C. Collins, T. Denk, S. Fagents, P. E. Geissler, B. Giese, R. Greeley, R. Greenberg, J. W. Head, P. Helfenstein, G. Hoppa, S. D. Kadel, K. P. Klaasen, J. E. Klemaszewski, K. Magee, A. S. McEwen, J. M. Moore, W. B. Moore, G. Neukum, C. B. Phillips, L. M. Prockter, G. Schubert, D. A. Senske, R. J. Sullivan, B. R. Tufts, E. P. Turtle, R. Wagner, and K. K. Williams, Does Europa have a subsurface ocean? Evaluation of the geological evidence.J. Geophys. Res.,104, 24015– 24055, 1999.
Passey, Q. R. and E. M. Shoemaker, Craters and basins on Ganymede and Callisto: Morphological indicators of crustal evolution, inSatellites of Jupiter, edited by D. Morrison, pp. 379–434, Univ of Arizona Press, Tucson, 1982.
Prockter, L. M. and R. T. Pappalardo, Folds on Europa: Implications for crustal cycling and accommodation of extension,Science,289, 941– 944, 2000.
Prockter, L. M., J. W. Head, R. T. Pappalardo, R. J. Sullivan, A. E. Clifton, B. Giese, R. Wagner, and G. Neukum, Morphology of Europan bands at high resolution: A mid-ocean ridge-type rift mechanism,J. Geophys. Res.,107, doi:10.1029/2000JE001458, 2002.
Rathbun, J. A., G. S. Musser, and S. W. Squyres, Ice diapirs on Europa: Implications for liquid water,Geophys. Res. Lett.,25, 4157–4160, 1998. Sarid, A. R., R. Greenberg, G. V. Hoppa, P. Geissler, and B. Preblich, Crack azimuths on Europa: Time sequence in the sourthern leading face,
Icarus,168, 144–157, 2004.
Sasaki, S. and K. Nakazawa, Metal-silicate fractionation in the growing Earth: Energy source for the terrestrial magma ocean,J. Geophys. Res., 91, 9231–9238, 1986.
Schenk, P. and W. B. McKinnon, Fault offsets and lateral crustal movement on Europa: Evidence for a mobile ice shell,Icarus,79, 75–100, 1989. Schubert, G., T. Spohn, and R. T. Reynolds, Thermal histories, and internal
structures of the moons of the solar system, inSatellites, edited by J. A. Burns and M. S. Matthews, pp. 224–292, Univ of Arizona Press, Tucson, 1986.
Segatz, M., T. Spohn, M. N. Ross, and G. Schubert, Tidal dissipation, surface heat flow, and figure of viscoelastic models of Io,Icarus,75, 187–206, 1988.
Showman, A. P. and L. Han, Numerical simulations of convection in Eu-ropa’s ice shell: Implications for surface features,J. Geophys. Res.,109, doi:10.1029/2003JE002103, 2004.
Sotin, C., O. Grasset, and S. Beauchesne, Thermodynamic properties of high pressure ices: Implications for the dynamics and internal structure of large icy satellites, inSolar System Ices, edited by B. Schmittet al., pp. 79–96, Kluwer Academic Press, Dordrecht, 1998.
Spencer, J. R., L. K. Tamppari, T. Z. Martina, and L. D. Travis, Temper-atures on Europa from Galileo photopolarimeter-radiometer: Nighttime thermal anomalies,Science,284, 1514–1516, 1999.
Squyres, S. W., The evolution of tectonic features on Ganymede,Icarus, 52, 545–559, 1982.
Squyres, S. W. and K. C. Croft, The tectonics on icy satellites, inSatellites, edited by J. A. Burns and M. S. Matthews, pp. 293–341, Univ of Arizona Press, Tucson, 1986.
Steiger, R. H. and E. Jager, Subcommission on geochronology: Convention on the use of decay constants in geo- and cosmo-chronology,Earth Planet. Sci. Lett.,36, 359–362, 1977.
Sullivan, R., R. Greeley, K. Homan, J. Klemaszewski, M. J. S. Belton, M. H. Carr, C. R. Chapman, R. Tufts, J. W. Head, R. T. Pappalardo, J. Moore, P. Thomas, and the Galileo Imaging Team, Episodic plate separation and fracture infill on the surface of Europa,Nature,391, 371– 373, 1998.
Tufts, B. R., R. Greenberg, G. Hoppa, and P. Geissler, Lithospheric dilation on Europa,Icarus,146, 75–97, 2000.
Tobie, G., G. Choblet, and C. Sotin, Tidally heated convection: Con-straints on Europa’s ice shell thickness, J. Geophys. Res., 108, doi:10.1029/2003JE002099, 2003.
Turcotte, D. L. and G. Schubert,Geodynamics, 2nd ed., John Wiley, New York, 2002.
Zahnle, K., P. Schenk, H. Levison, and L. Dones, Cratering rates in the outer solar system,Icarus,163, 263–289, 2003.
Zahnle, K., P. Schenk, L. Dones, and H. Levison, Cratering rates in the Jo-vian system,Workshop on Europa’s icy shell: Past, Present, and Future, abstract 7052, 2004.
Zuber, M. T. and E. M. Parmentier, Lithospheric stress due to radiogenic heating of an ice-silicate body: Implications for Ganymede’s tectonic evolution,Proc. Lunar Planet. Sci. Conf. 14th., in J. Geophys. Res. Suppl.89, B429–B437, 1984.