R E S E A R C H
Open Access
On a fractional order Ebola epidemic
model
Ivan Area
1, Hanan Batarfi
2, Jorge Losada
3, Juan J Nieto
2,3*, Wafa Shammakh
2and Ángela Torres
4*Correspondence:
juanjose.nieto.roig@usc.es 2Faculty of Science, King Abdulaziz
University, P.O. Box 80203, Jeddah, Full list of author information is available at the end of the article
Abstract
Ebola is a world health problem and with a recent outbreak. There exist different models in the literature to predict its behavior, most of them based on data coming from previous outbreaks or using restricted number of persons in the population variable. This paper deals both with classical and fractional order SEIR (susceptible, exposed, infections, removed) Ebola epidemic model and its comparison with real data extracted from the reports periodically published by the World Health Organization (WHO), starting from March 27th, 2014. As it has been shown in the literature, one physical meaning of the fractional order in fractional derivatives is that of index of memory; and therefore, it seems to be useful for epidemic models, as in this paper. The number of confirmed cases by the WHO in its reports is used for our analysis and estimation of the parameters in our classical and fractional SEIR models. Our approach gives a good approximation to real data. Following our results, the current outbreak will continue for approximately two years, assuming that no new outbreak appears at a different community or country. Our estimates give a number of the order nine million confirmed cases.
MSC: Primary 26A33; secondary 34A08
Keywords: Ebola; fractional derivative; epidemiological model
1 Introduction
Ebola is a highly lethal virus, which has caused at least confirmed outbreaks in Africa between and . In October cases also appeared in the USA and Spain after treating infected patients at Texas Health Presbyterian Hospital Dallas and Hospital Carlos III de Madrid, respectively.
The origin of Ebola is somewhat not clear. Peter Piot discovered the Ebola virus in and helped to contain the first-ever recorded Ebola epidemic that same year in the first recorded outbreak held at Nzara, Maridi and surrounding areas (Sudan) between June and November .
Up to , about , cases and , deaths have been registered due to Ebola virus(es). In the outbreak of (Guinea, Liberia, Nigeria, Senegal, and Sierra Leone) we have about , cases and , deaths at the time of writing this article (Decem-ber st, ).
There exist five Ebola viruses according to the International Committee on Taxonomy of Viruses currently: Ebola virus (EBOV), Sudan virus (SUDV), Reston virus (RESTV),
Taï Forest virus (TAFV), and Bundibugyo virus (BDBV). Four of these viruses (except-ing RESTV) are known to cause Ebola virus disease in humans. Up to , the SUDV was present at cases, the BDBV virus at cases, one person was infected by the TAFV virus, and the remaining cases (about ,) were due to the EBOV virus. The outbreak is related with the EBOV virus.
Despite extensive search, the reservoir of the Ebola virus has not yet been identified but may include fruit bats []. Ebola is transmitted by physical contact with body fluids, secretions, tissues, or semen from infected persons. The incubation period is - days, and the infectious period is - days. The diagnosis of Ebola is not easy since many times it is misdiagnosed as, for example, malaria and typhoid. The onset of Ebola is characterized by severe headaches, malaise, fever, vomiting, bloody diarrhea, and rash.
The mortality rate of Ebola varies from % to %. Very recently a new study has provided strong evidence that individual genetic differences play a major role in whether people die from the disease []. This might help to understand the big differences in the mortality rate of Ebola at different communities which are observed in the official data reported. As an example, the estimates of the basic reproduction number [],R, are . (% CI, . to .) for Guinea, . (% CI, . to .) for Liberia, . (% CI, . to .) for Nigeria, and . (% CI, . to .) for Sierra Leone [].
In the outbreak the mean incubation period is . days, and it does not vary by country []. The mean time from the onset of symptoms to hospitalization, a measure of the period of infectiousness in the community, is .±. days, and it is not shorter for health care workers than for other case patients. The mean time to death after admission to the hospital is .±. days, and the mean time to discharge is .±. days []. The mean length of stay in hospital is . days in Guinea, Liberia, and Sierra Leone.
In this paper we have analyzed both classical and fractional SEIR (susceptible-exposed-infectious-removed) epidemic model for different values of the parameters, as compared with the official data obtained from the World Health Organization (WHO). These models have been used to compare the existing data of previous outbreaks [–] which have less information as compared with the outbreak.
We shall denote byS(t),E(t),I(t), andR(t) the susceptible, exposed, infectious, and re-moved at timet. We shall also assume that
N=S(t) +E(t) +I(t) +R(t)
is the population (constant) studied in the model. Notice thatN includes the recovered individualsR(t).
(Bo, Bombali, Bonthe, Kailahun, Kambia, Kenema, Koinadugu, Kono, Moyamba, Port Loko, Pujehun, Tonkolili, Western Rural, and Western Urban). Nevertheless, in Guinea there do not exist confirmed cases in the following prefectures: Fria, Gaoual, Koubia, Koundara, Labé, Lélouma, Mali, Mandiana, and Tougué. Therefore, the total population in our model (according to updated data) is fixed to be ,, people. As will be noted later, we will consider asNin our model a portion of such total population.
There exist some other models for the Ebola outbreak [–] and previous out-breaks [–].
2 Materials and methods
2.1 Classical model
Using [], we have the following system of differential equations as model:
⎧
In this model the parameterβ=pc, wherepis the probability of successfully getting in-fected when coming into contact with an inin-fected individual, andcis the per-capita con-tact rate. That is,β is an average of the number of infected people by contact with one symptomatic individual who has been infected with Ebola virus. However, Ebola virus can be also transmitted by latent individuals; that is, asymptomatic people who are infected (E(t) in our model). Of course, it is well known that an individual has a higher chance of getting infected for an infectious individual than for a latent individual. This justifies fac-torq∈[, ] in the second equation of (). Moreover, the parameterγ is the per-capita death rate, which also depends on the country; this parameter has been fixed to / days– in our numerical computations. Furthermore, the parameterδis the per-capita infectious rate, we have fixed to /.
2.2 Fractional model
Fractional calculus has recently found wide applications in many areas of science and engi-neering, for example, viscoelastic systems, fluid dynamics, solid dynamics, to cite some of them []. Recently, it has been used to analyze a dengue epidemic model []. Despite the fact that the operator of fractional derivative is more complicated than the classical one, there exist numerical methods for solving systems of nonlinear differential equations []. One physical meaning of the fractional order in fractional derivatives is that of index of memory []. Moreover, fractional calculus plays an important role in superdiffusive and subdiffusive processes, which makes it a useful tool in epidemiology []. Some properties of fractional orthogonal polynomials have been recently presented in [, ].
The fractional Riemann-Liouville derivative of orderαoff is defined as [, ]
There are many more fractional derivatives. We are not giving a complete list, but recall
which is well defined, for example, for absolutely continuous functions. Note that the value of the Caputo fractional derivative of the functionfat pointtinvolves all the values off(s) fors∈[,t].
As in the integer case we have
DαIαf(t) =f(t), cDαIαf(t) =f(t)
We have written system () in terms of fractional differential equations as
⎧ Nis the total population andα∈(, ) is the derivation order.
2.3 Initial conditions and values of the parameters
As already mentioned, we have the following values for the parameters in the classical () and fractional model ()
TP= ,,, δ=
, γ =
, ()
where TP is the total population of the three countries considered (as indicated in Ta-ble ). Moreover, the initial conditions are fixed as follows in the numerical experiments performed:
S() =TP m
Table 1 Reported cumulative numbers of confirmed cases of Ebola outbreak. In this table we show the confirmed cases as they appear in official data obtained from the World Health Organization (WHO). Note that, according to these data, there some dates (November 5th, 2014) in which the cumulative number of confirmed cases decreases. The data of Liberia between the days October 17th, 2014 and October 22nd, 2014 also seem curious
Date Guin. Lib. S. Leone Total
27/03/2014 15 0 0 15
Date Guin. Lib. S. Leone Total
30/07/2014 337 109 507 953
In Table we have included the data we have considered for our numerical computa-tions.
3 Results and discussion
3.1 Results
By using the predictor-corrector PECE method of Adams-Bashforth-Moulton [], we have solved numerically the above systems of differential equations () and () and found the best value of the parameterqthat minimizes the norm between the real data and the models, defined by
whererjis the cumulative number of infected people according to the data at dayjand mjis the prediction proposed by the model. Notice that we will not useα, the order of derivation, as optimization parameter.
The system has been solved for times starting att= and ending attd= days. In each plot, we show in blue line the real data and in red dashed line the results of our model for the fixed parameters. We have also included the normρof the difference in each case.
In each picture we show both model and real data as accumulated values. To evaluate the equilibrium points, we consider the system
= –βS(t)(qE(t) +I(t))
for the specific values ofβ,γ,δ, andNindicated before. Therefore, the eigenvalues
λ= ,
Figure 1 Comparison between our model and real data.In this figure we show a comparison between our model given by the system of nonlinear differential equations (1) and real data coming from the WHO included as Table 1. The values of the parameters arem= 80,q= 0.030 (left) andm= 75,q= 0.067 (right). The errors using2norm are 5,185.344 and 5,309.831, respectively.
Figure 2 Model prediction and real data for a shorter period of time.In this figure we show the prediction of our model given by the system of nonlinear differential equations (1) in a shorter interval of time (200 days). The values of the parameters are the same as for Figure 1.
λ=
qS(t) – ,, –q(S(t))+ ,,(q+ )S(t) + ,,,,
,,, ,
λ=qS(t) – ,, +
q(S(t))+ ,,(q+ )S(t) + ,,,,
,,, .
Forq∈[, ] andm≥ (that is,S() is at least % of the total population, which is a reasonable assumption), we have thatλ< andλ> .
The qualitative analysis of a fractional model is a difficult problem. The stability of the disease-free equilibrium needs further study, and it will be considered in the future.
.. Classical derivatives model()
We would like to mention here that form≥ the value ofqin () that best fits the real data is negative which has no probability meaning.
The results for classical derivative are shown in Figures , , and .
Figure 3 Another comparison between our model and real data.In this case we considerm= 70,
q= 0.110 (left) andm= 65,q= 0.159 (right). Using the2norm we obtain similar errors as in Figure 1, 5,462.073 and 5,610.436, respectively.
Figure 4 Comparison between our model and real data.In this figure we show a comparison between our model given by the system of nonlinear fractional differential equations (2) and real data coming from the WHO included as Table 1. The values of the parameters arem= 90,q= 0.058,α= 0.9 (left) andm= 85,
q= 0.090,α= 0.9 (right). The errors using2norm are 5,848.597 and 5,959.564, respectively.
October th to October nd), we would like to notice that our model is quite accurate to the real data of confirmed cases extracted from the WHO.
In Figure , we show the prediction of our model during a shorter interval of time using the same values of the parameters as in Figure .
In Figure we consider at firstm= in () andq= .; the right-hand side of Fig-ure has been obtained form= in () andq= .. Thenorms are ,. and ,., respectively. The daily difference is in these cases less than confirmed cases, which is about .% of error as compared with the mean of the data.
.. Fractional derivatives model()
The results for the fractional derivatives model are shown in Figures , , and .
In Figure , the picture on the left has been obtained form= in (),q= ., and
α= .; the picture on the right has been obtained form= in (),q= ., andα= .. Thenorms are ,. and ,., respectively.
In Figure , we show the prediction of our model during a shorter interval of time using the same values of the parameters as in Figure .
Figure 5 Model prediction and real data for a shorter period of time.In this graph we show the prediction of our model given by the system of nonlinear fractional differential equations (2) in a shorter interval of time (200 days). The values of the parameters are the same as for Figure 4.
Figure 6 Another comparison between our model and real data whenα= 0.9.In this case we consider
m= 80,q= 0.169 (left) andm= 75,q= 0.128 (right). Using the2norm we obtain similar errors as in Figure 4, 6,078.286 and 6,208.718, respectively.
Figure 7 Fractional model withsmallα.This graph has been obtained form= 80 in (4),q= 0.345, andα= 0.75.
It is also possible to relax the parameter of derivationα. As an example, forα= ., the best fitting is shown in Figure . Notice that whenαis smaller, then it seems thatqmust be bigger.
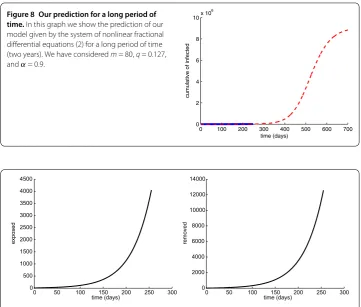
In Figure we show the prediction of our model with m= in (),q= ., and
α= . for a period of time of two years ( days).
Figure 8 Our prediction for a long period of time.In this graph we show the prediction of our model given by the system of nonlinear fractional differential equations (2) for a long period of time (two years). We have consideredm= 80,q= 0.127, andα= 0.9.
Figure 9 This graph shows evolution of exposed (left) and removed (right) population.We have considered the same values of the parameters as on left side of Figure 1.
Figure 10 This graph shows evolution of exposed (left) and removed (right) population.We have considered the same values of the parameters as on left side of Figure 8.
3.2 Discussion
Up to now it has not been possible to decide which model (classical derivative or frac-tional derivative) is giving better approximation to the real data, but with classical deriva-tive the value ofmin () must be smaller than or equal to in order thatq> gives the minimum value ofρ.
It seems that the number of confirmed cases will be increasing, but the implementa-tion of effective public health measures would help to stop the rising number of cases. Numerical experiments show that with the current real data the number of confirmed cases becomes stable in approximately two years after the start of the outbreak as shown in Figure .
4 Conclusions
In this paper we have analyzed the data published by the World Health Organization in order to provide a prediction of the outbreak in Liberia, Guinea, and Sierra Leone. The number of confirmed cases since the beginning of the outbreak has increased to about , infected people at the time of writing this article. Our model fits accurately the real data considered. Following our results, the current outbreak will continue for approx-imately two years for a total estimate of the order of nine million infected people. If the high fatality of Ebola is considered, the urgency of public health measures is mandatory. We have used mathematical models which consider susceptible, exposed, infectious, and removed people. Our models are based on differential equations which are numerically solved to provide the graphs included in the paper. First, we consider classical differential equations and secondly fractional differential equations which generalize the classical ap-proach. Our estimates give a number of the order ×confirmed cases. Despite the fact that individual genetic differences play a major role in whether people die from the disease, by using the available data and our analysis the number of predicted dead people is extremely high. Finally, it is worth mentioning here that the integer order differential equation SEIR model () gives better results in terms of the norm than the fractional SEIR model ().
Competing interests
The authors declare that there is no conflict of interests regarding the publication of this paper.
Authors’ contributions
All authors contributed equally to the writing of this paper. All authors read and approved the final manuscript.
Author details
1Departamento de Matemática Aplicada II, E.E. Telecomunicación, Universidade de Vigo, Vigo, 36310, Spain.2Faculty of
Science, King Abdulaziz University, P.O. Box 80203, Jeddah, 21589, Saudi Arabia. 3Facultade de Matemáticas, Universidade de Santiago de Compostela, Santiago de Compostela, 15782, Spain.4Departamento de Psiquiatría, Radioloxía e Saúde Pública, Facultade de Medicina, Universidade de Santiago de Compostela, Santiago de Compostela, 15782, Spain.
Acknowledgements
The authors thank the anonymous reviewers for their detailed remarks and constructive criticism. The work of I Area has been partially supported by the Ministerio de Economía y Competitividad of Spain under grant MTM2012-38794-C02-01, co-financed by the European Community fund FEDER. JJ Nieto and J Losada also acknowledge partial financial support by the Ministerio de Economía y Competitividad of Spain under grant MTM2010-15314 and MTM2013-43014-P, XUNTA under grant R2014/002, and co-financed by the European Community fund FEDER. This project was funded by the Deanship of Scientific Research (DSR), King Abdulaziz University, under grant No. (88-130-35-HiCi). The authors, therefore, acknowledge technical and financial support of KAU.
Received: 7 January 2015 Accepted: 19 August 2015 References
2. Gire, SK, Goba, A, Andersen, KG, Sealfon, RSG, Park, DJ, et al.: Genomic surveillance elucidates Ebola virus origin and transmission during the 2014 outbreak. Science345, 1369-1372 (2014)
3. Chowell, G, Hengartner, N, Castillo-Chavez, C, Fenimore, P, Hyman, J: The basic reproductive number of Ebola and the effects of public health measures: the cases of Congo and Uganda. J. Theor. Biol.229, 119-126 (2004)
4. WHO Ebola Response Team: Ebola virus disease in West Africa - the first 9 months of the epidemic and forward projections. N. Engl. J. Med.371, 1481-1495 (2014)
5. Astacio, J, Briere, DM, Guillén, M, Martínez, J, Rodríguez, F, et al.: Mathematical models to study the outbreaks of Ebola. Technical report, MTBI Technical Report (1996)
https://mtbi.asu.edu/research/archive/paper/mathematical-models-study-outbreaks-ebola
6. Lekone, PE, Finkenstädt, BF: Statistical inference in a stochastic epidemic SEIR model with control intervention: Ebola as a case study. Biometrics62, 1170-1177 (2006)
7. Ndanguza, D, Tchuenche, JM, Haario, H: Statistical data analysis of the 1995 Ebola outbreak in the Democratic Republic of Congo. Afr. Math.24, 55-68 (2013)
8. Althaus, CL: Estimating the reproduction number of Ebola virus (EBOV) during the 2014 outbreak in West Africa. Technical report, PLOS Current Outbreaks (2014)
9. Atangana, A, Doungmo Goufo, EF: On the mathematical analysis of Ebola hemorrhagic fever: deathly infection disease in West African countries. BioMed Research International (2014)
10. Gomes, MFC, Pastore y Piontti, A, Rossi, L, Chao, D, Longini, I, et al.: Assessing the international spreading risk associated with the 2014 West African Ebola outbreak. Technical report, PLOS Currents Outbreaks (2014) 11. Rivers, CM, Lofgren, ET, Marathe, M, Eubank, S, Lewis, BL: Modeling the impact of interventions on an epidemic of
Ebola in Sierra Leone and Liberia. Technical report, PLOS Currents Outbreaks (2014)
12. Rachah, A, Torres, DFM: Mathematical modelling, simulation, and optimal control of the 2014 Ebola outbreak in West Africa. Discrete Dyn. Nat. Soc.2015, Article ID 842792 (2015)
13. Anderson, R, May, R: Infectious Diseases of Humans: Dynamics and Control. Oxford Science Publications, Oxford (1992)
14. Li, C, Zeng, F, Liu, F: Spectral approximations to the fractional integral and derivative. Fract. Calc. Appl. Anal.15, 383-406 (2012)
15. Al-Sulami, H, El-Shahed, M, Nieto, JJ, Shammakh, W: On fractional order dengue epidemic model. Math. Probl. Eng. (2014). doi:10.1155/2014/456537
16. Diethelm, K, Freed, AD: The FracPECE subroutine for the numerical solution of differential equations of fractional order (2002) http://www.mpg.de/billing/hbp98/diethelm.pdf
17. Du, M, Wang, Z, Hu, H: Measuring memory with the order of fractional derivative. Sci. Rep.3, 3431 (2013) 18. Skwara, U, Martins, J, Ghaffari, P, Aguiar, M, Boto, J, Stollenwerk, N: Fractional calculus and superdiffusion in
epidemiology: shift of critical thresholds. In: Proceedings of the 12th International Conference on Computational and Mathematical Methods in Science and Engineering, La Manga (2012)
19. Area, I, Djida, JD, Losada, J, Nieto, JJ: On fractional orthonormal polynomials of a discrete variable. Discrete Dyn. Nat. Soc.2015, Article ID 141325 (2015)
20. Area, I, Losada, J, Manintchap, A: Fract. Calc. Appl. Anal.18(5) (2015, to appear). doi:10.1515/fca-2015-0067; http://www.degruyter.com/view/j/fca
21. Kilbas, AA, Srivastava, HM, Trujillo, JJ: Theory and Applications of Fractional Differential Equations, xvi+523 p. North-Holland Mathematics Studies, vol. 204. Elsevier, Amsterdam (2006)