© 2018 The Authors. Published by Innovare Academic Sciences Pvt Ltd. This is an open access article under the CC BY license (http://creativecommons. org/licenses/by/4. 0/) DOI: http://dx.doi.org/10.22159/ajpcr.2018.v11s4.31728
FORMULATION AND EVALUATION OF FAST DISSOLVING TABLET OF KETOROLAC
TROMETHAMINE
SANGEETHA G, MAHESH PG*, CHANTHINI K, LOKESH M, AMEEN S
Department of Pharmaceutics, School of Pharmaceutical Sciences, Vels Institute of Science Technology and Advanced Studies, Pallavaram, Chennai - 600 117, Tamil Nadu, India. Email: [email protected]
Received: 10 October 2018, Revised and Accepted: 11 December 2018 ABSTRACT
Aim and Objective: Ketorolac tromethamine is used for treatment of infections including infection of joints and bones, gastroenteritis, malignant Otis externa, respiratory tract infections, cellulites, urinary tract infections, anthrax and it also used in treatment of community acquired pneumonia. Difficulty in swallowing is a common problem of all age groups, especially the elderly and pediatrics, because of physiological changes associated with these groups.
Methods: Pre formulation testing is an investigation of physical and chemical properties of drug substances alone and when combined with pharmaceutical excipients. It is the first step in the rational development of dosage form.
Results: The present study was undertaken to formulate Ketorolac tromethamine oral dispersible tablet with three polymers namely sodium starch glycolate, cros carmellose sodium and in combination of three super disintegrants and by dry granulation technique. Before compression of the garnules physical characters such as bulk density, tappd density, angle of repose, compressibility index and hausner ratio was determined and tabulated. Then the granules were compressed into tablets and then evaluated.
Conclusion: It has been observed from all formulations of pre compression and post compression studies were given with in the limits of values. The in vitro dissolution data, F1( combination of super disintegrant) formulation was found that the drug release is best and cumulative % of drug release was 90.88% respectively, when compared to other formulation.
Keywords: Ketorolac tromethamine, Sodium starch glycolate, Cros carmellose
INTRODUCTION
Recent developments in technology have presented viable alternatives for the patients who may have difficulty in swallowing tablets or liquids. Traditional tablets and capsules administered with an 8-oz glass of water [1] may be inconvenient or impractical for some patients. For example, a very elderly patient may not be able to swallow a daily dose [2] of tablets. [3] Some drugs are absorbed from mouth, pharynx and esophagus as saliva passes down to stomach [4] An inability or willingness to swallow solid oral dosage forms such as tablets and poor taste of medicine are some of the important reasons for consumer dissatisfaction(5) A schizophrenic patient in the institution setting can hide a conventional tablet under his/her tongue to avoid daily dose of atypical anti psychotic(6) The amount of drug that is subjected to first pass metabolism is reduced as compared to standard tablets(7) Fast dissolving tablet is a solid dosage form that disintegrants and dissolves in he mouth(8) The fast dissolving tablet that can be placed in the mouth where it disperses rapidly before swallowing(9)
METHODS
Pre-formulation studies
Pre formulation testing is an investigation of physical and chemical properties of drug substances alone and when combined with pharmaceutical excipients. It is the first step in the rational development of dosage form.
Standard curve of ketorolac tromethamine Sodium hydroxide solution, 0.2 m
8 g of sodium hydroxide was dissolved in 1000 ml distilled water, and it gives 0.2 m solution.
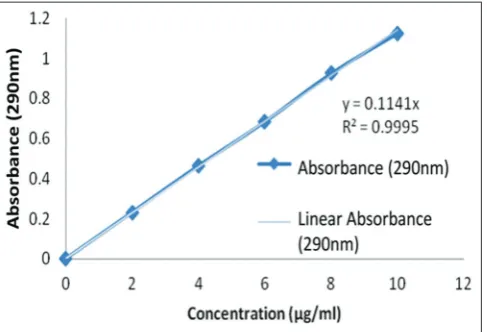
Fig. 1: Standard curve of ketorolac tromethamine in phosphate buffer (pH 6.8)
Research Article
Table 1: Standard curve of ketorolac tromethamine in phosphate buffer (pH 6.8)
S. No
.
Concentration (μg/ml) Absorbance (290 nm)Standard curve of ketorolac tromethamine Potassium dihydrogen phosphate solution
0.2M 27.218gm of potassium dihydrogen phosphate was dissolved in 1000ml distilled water in a volumetric flask.
Sodium hydroxide solution, 0.2M
8gm of sodium hydroxide was dissolved in 1000ml distilled water and gives 0.2M solution
Preparation of pH6.8 buffer
Place 50.0ml of 0.2M potassium di hydrogen phosphate in a 200ml volumetric flask add 22.4ml sodium hydroxide and then make up with water upto volume.
This is standard curve of Ketorolac tromethamine phosphate buffer with absorbance 290nM and linear absorbance 290nM. Its showing in Fig 1.
The disintegration time (D.T) of all formulations is shown in the Fig 2.
100mg of pure drug of ketorolac tromethamine was dissolved in 10ml volumetric flask and shaked with 5ml methanol. for the above solution add remaining amount was make up with 6.8pH Phosphate buffer .This solution contains 1000µg/ml of ketorolac tromethamine stock solution. Take 10ml from above solution in 100ml volumetric flask and make up with 6.8pH phosphate buffer. This solution contains 100µg/ml of drug. From above solution take 1ml in 10ml volumetric flask and make up with 6.8pH phosphate buffer. From this solution pipette out 0.2ml in 10ml volumetric flask add buffer. This gives0.2µg/ml solution. Similarly Fig. 3: Wetting time
Fig.4: FTIR spectrum of ketorolac tromethamine.
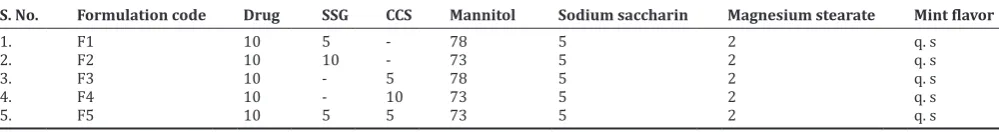
Table 2: Different formulation of ketorolac tromethamine oral dispersible tablets
S. No. Formulation code Drug SSG CCS Mannitol Sodium saccharin Magnesium stearate Mint flavor
1. F1 10 5 - 78 5 2 q. s
2. F2 10 10 - 73 5 2 q. s
3. F3 10 - 5 78 5 2 q. s
4. F4 10 - 10 73 5 2 q. s
5. F5 10 5 5 73 5 2 q. s
Fig. 5: FTIR Spectrum of Sodium starch glycolate
Table 3: Pre-compression studies of powder blend
S. No. Formulations Hardness
test (kg/cm) Thickness test (cm) Friability test (%) % of weight variation test Estimation of drug content
1. F1 2.35 0.35 0.154 99.5 98.22
2. F2 2.44 0.35 0.218 99.7 96.39
3. F3 3.52 0.35 0.256 99.8 97.64
4. F4 2.82 0.35 0.277 99.7 97.57
5. F5 2.75 0.35 0.234 99.7 95.48
Table 4: Pre compression studies of Powder blend S. No. Formulations Bulk density (g/
cm3) Tapped density (g/cm3) Angle of repose (θ) Carr’s index (%) Hausner’s ratio
1. F1 0.384 0.385 31.26 10.73 1.322
2. F2 0.356 0.362 35.15 6.58 1.175
3. F3 0.358 0.372 32.82 9.29 1.203
4. F4 0.382 0.323 32.38 6.10 1.167
5. F5 0.343 0.358 34.07 9.21 1.005
preparing 0.4ml, 0.6ml, 0.8ml and 1ml of solution in 10ml volumetric flasks. Resulting gives 2µg/ml ,4µg/ml ,6µg/ml,
8 µg/ml and 10µg/ml solutions. The concentrated solution scanned in UV-Visible Spectrophotometer meter with absorption maimum is 290nm shown in Table 1.
In this method, all the powder excipients are mixed thoroughly in a polyethylene bag. After proper mixing the powder was punched into tablets. The weight of the tablet was 400mg and dose of the drug is 150mg. Each tablet weight- 100mg shown in Table 2.
The compressed tablets were evaluated for physical properties and the results are tabulated for Hardness test, Thickness test, Friability test, % of weight variation test and Estimation of drug content values showed in Table 3.
Method of preparation
Preparation of ketorolac tromethamine tablets Direct compression technique
Each tablet wetting time (WT) - 100 mg.
Pre compression studies of powder blend Angle of repose
θ=Tan−1 (h/r)
Where
θ=Angle of repose,
Fig. 7: Formulation-1 (F1)
Fig. 8: Formulation-2 (F2) Table 5: Post‑compression studies of ketorolac tromethamine
oral dispersible tablets
S. No. Formulations Disintegration time (s) WT (s)
1. F1 24 16
2. F2 22 17
3. F3 30 18
4. F4 21 16
5. F5 25 16
WT: Wetting time
Table 6: FTIR spectrum of ketorolac tromethamine. S. No. Wave number Functional group
1. 3442 OH stretching carboxylic acid
2. 3129 =CH aromatic heterocyclic stretching
3. 3067 =CH aromatic stretching
4. 2966 alkyl stretching
5. 1226 C-N stretching
6. 1454 Alkyl CH2 bending
7. 1384 Alkyl CH2 bending
8. 899 CH- aromatic bending
9. 1700 C = O stretching
10. 1384 C-OH bending
FTIR: Fourier-transform infrared spectroscopy
Table 7: FTIR Spectrum of Sodium starch glycolate
S. No. Wave number Functional group
1. 3409 OH stretching
2. 2928 alkyl CH stretching
3. 1602 COO anti-symmetry stretching
4. 1239 C-O-C stretching
FTIR: Fourier-transform infrared spectroscopy, SSG: Sodium starch glycolate
Fig. 6: FTIR Spectrum of ketorolac tromethamine and sodium starch glycolate
RESULTS AND DISCUSSIONS Pre-formulation studies
The present study was undertaken to formulate Ketorolac tromethamine oral dispersible tablet with three polymers namely
Table 8:FTIR Spectrum of ketorolac tromethamine and sodium starch glycolate
S. No. Wave number Functional group
1. 3350 OH stretching
2. 3105 =CH aromatic heterocyclic ring
3. 2922 alkyl CH stretching
FTIR: Fourier-transform infrared spectroscopy, SSG: Sodium starch glycolate
Table 9: Formulations-1 (F1)
S. No. Time (min) Absorbance (290 nm) Concentration (µg/ml) Amount of drug release (in 900 ml) % of drug release
1. 0 0.000 0.000 0.000 0.000
2. 1 0.128 1.068 9.810 6.49
3. 3 0.498 4.354 39.85 26.67
4. 6 0.687 6.010 54.20 36.55
5. 9 0.922 8.056 72.66 48.77
6. 12 1.243 10.976 98.68 65.78
7. 15 1.724 15.184 136.01 90.88
SSG: Sodium starch glycolate
Table 10: Formulations-2 (F2)
S. No. Time (min) Absorbance (290 nm) Concentration (µg/ml) Amount of drug release (in 900 ml) % of drug release
1. 0 0.000 0.000 0.000 0.000
2. 1 0.076 0.852 7.598 5.25
3. 3 0.382 3.478 30.84 20.73
4. 6 0.568 5.172 46.43 31.85
5. 9 0.878 7.73 69.89 46.36
6. 12 1.162 10.30 90.74 60.83
7. 15 1.654 14.88 132.89 88.30
Table 11: Formulations-3 (F3)
S. No. Time (min) Absorbance (290 nm) Concentration (µg/ml) Amount of drug release (in 900 ml) % of drug release
1 0 0.000 0.000 0.000 0.000
2 1 0.072 0.779 6.493 4.325
3 3 0.384 3.182 28.53 19.35
4 6 0.582 4.689 44.86 29.67
5 9 0.863 7.472 67.54 44.99
6 12 1.116 9.601 87.81 58.71
7 15 1.593 13.98 124.7 83.81
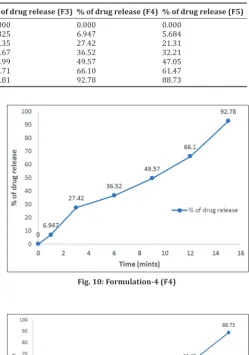
Table 12: Formulations-4 (F4)
S. No. Time (min) Absorbance (290 nm) Concentration µg/ml) Amount of drug release (in 900 ml) % of drug release
1. 0 0.000 0.000 0.000 0.000
2. 1 0.108 0.947 8.526 5.684
3. 3 0.405 3.552 31.97 21.31
4. 6 0.612 5.368 48.31 32.21
5. 9 0.894 7.842 70.57 47.05
6. 12 1.168 10.24 92.21 61.47
7. 15 1.686 14.78 133.1 88.73
Table 13: Formulations-5 (F5)
S. No. Time (min) Absorbance (290 nm) Concentration (µg/ml) Amount of drug release (in 900 ml) % of drug release
1. 0 0.000 0.000 0.000 0.000
2. 1 0.108 0.947 8.526 5.684
3. 3 0.405 3.552 31.97 21.31
4. 6 0.612 5.368 48.31 32.21
5. 9 0.894 7.842 70.57 47.05
6. 12 1.168 10.24 92.21 61.47
7. 15 1.686 14.78 133.1 88.73
WT study
The WT of all formulations is shown in Table 5 and Fig. 3.
The disintegration time (D.T) of all formulations is shown in the Table 5.
and super disintegrants were similar fundamental peaks and patterns. The results proved that there were no significant interactions between the drug and super disintegrants. The results are shown in Table 6 and Fig 4.
The IR Spectral studies of sodium starch glycolate were carried out to study the interaction between the drug and super disintegrants used. It showed that IR spectrum of pure drug ketorolac tromethamine and super disintegrants were similar fundamental peaks and patterns. The results proved that there were no significant interactions between the drug and super disintegrants. The results are shown in Table 7 and Fig 5.
The IR Spectral studies of pure ketorolac tromethamine, sodium starch glycolate were carried out to study the interaction between the drug and super dis integrants used. It showed that IR spectrum of pure drug ketorolac tromethamine and super disintegrants were similar fundamental peaks and patterns. The results proved that there were no significant interactions between the drug and super disintegrants. The results are shown in Table 8 and Fig 6.
The in vitro drug release profile of tablets from formulation 1 batch was carried in phosphate buffer (pH 6.8) for 15mts by using paddle type of device. From the in vitro dissolution data, F1 formulation was found that that drug release and cumulative % of drug release was 90.88% respectively shown in Fig 7.
The in vitro drug release profile of tablets from formulation 2 batch was carried in phosphate buffer (pH 6.8) for 15mts by using paddle type of device. From the in vitro dissolution data, F2 formulation was found that that drug release and cumulative % of drug release was 88.3% respectively shown in Fig 8.
The in vitro drug release profile of tablets from formulation 3 batch was carried in phosphate buffer (pH 6.8) for 15mts by using paddle type of device. From the in vitro dissolution data, F3 formulation was found that that drug release and cumulative % of drug release was 83.81% respectively shown in Fig 9.
The in vitro drug release profile of tablets from formulation 4 batch was carried in phosphate buffer (pH 6.8) for 15mts by using paddle type of device. From the in vitro dissolution data, F4 formulation was found that that drug release and cumulative % of drug release was 92.78% respectively shown in Fig 10.
The in vitro drug release profile of tablets from formulation 5 batch was carried in phosphate buffer (pH 6.8) for 15mts by using paddle type of device. From the in vitro dissolution data, F5 formulation was found that that drug release and cumulative % of drug release was 88.73% respectively shown in Fig 11.
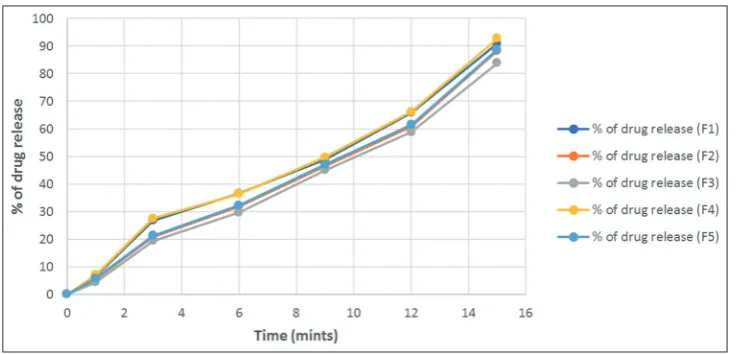
The in vitro drug release profile of tablets from each batch (F1 to F5) was carried in phosphate buffer (pH 6.8) for 15mts by using paddle type of device. From the in vitro dissolution data, F1 formulation was found that that drug release is best and cumulative % of drug release was 90.88% respectively, when compared to other formulations. shown in Fig 12.
In vitro drug release study
Tablets of all the formulations were subjected for in vitro release studies. The results are presented in Tables 9-14.
The present study was undertaken to formulate Ketorolac tromethamine oral dispersible tablet with three polymers namely sodium starch glycolate, cros carmellose sodium and in combination of three super disintegrants and by dry granulation technique. Before compression of the granules physical characters such as bulk density, tapped density, angle of repose, compressibility index and hausner ratio was determined and tabulated in Table 12.
DISCUSSION
Oral dispersible tablets of ketorolac tromethamine were prepared by direct compression method. Microscopic examination of tablets from each formulation batch showed circular result.
Fig. 10: Formulation-4 (F4)
Fig. 11: Formulation-5 (F5) Table 14: Comparative dissolution study of different formulations with various ratios of super disintegrants
S. No. Time (min) % of drug release (F1) % of drug release (F2) % of drug release (F3) % of drug release (F4) % of drug release (F5)
1. 0 0.000 0.000 0.000 0.000 0.000
2. 1 6.49 5.25 4.325 6.947 5.684
3. 3 26.67 20.73 19.35 27.42 21.31
4. 6 36.55 31.85 29.67 36.52 32.21
5. 9 48.77 46.36 44.99 49.57 47.05
6. 12 65.78 60.83 58.71 66.10 61.47
Fig. 12: Comparative dissolution study of different formulations with various ratios of super disintegrants
CONCLUSION
It has been observed from all formulations of pre compression and post compression studies were given with in the limits of values. The in vitro dissolution data, F1( combination of super disintegrant) formulation was found that the drug release is best and cumulative % of drug release was 90.88% respectively, when compared to other formulation.
REFERENCES
1. Lorenzp-Lamosa ML, Cuna M, Vila-Jato JL, Torres D. Fast dissolving drug delivery system: An update. J Microencapsul 1997;14:607. 2. Habib W, Khankari R, Hontz J. Fast dissolving drug delivery system:
Critical review in therapeutics. Drug Carrier Syst 2000;17:61-72. 3. Bradoo R, Shahani S, Poojary S, Deewan B, Sudarsan S. Fast dissolving
drug delivery system. JAMA India 2001;4:27-31.
4. Dobetti L. Fast melting tablet: Development and technologies. Pharm Tech 2001;37:44-8.
5. Panigrahi D, Baghel S, Mishra B. Mouth dissolving tablets: A overview of preparation techniques, evaluation and patented technologies. J Pharm Res 2005;49:33-8.
6. Avani J, Amin F. Emerging trends in the development of orally disintegrating tablet technology - A review. Pharm Tech 2006;4:26-32. 7. Chaudhary PD, Chaudhary SP, Lanke SD, Nakul TK. Formulation
and in vitro evaluation of taste masked orodispersible dosage forms of levocetrizine dihydrochloride. Indian J Pharm Educ Res 2007;41:319-27.
8. Kundu PK, Sahoo K. Recent trends in the developments of orally disintegrating tablet technology. Pharm Times 2008;40:11-5.