1
Article
2
3
4
Entropy Density Acceleration and Minimum
5
Dissipation Principle: Correlation with Heat and
6
Matter Transfer in Glucose Catabolism
7
8
Roberto Zivieri1, *, Nicola Pacini2,3
9
1Department of Mathematical and Computer Sciences, Physical Sciences and Earth Sciences, University of
10
Messina, Messina, Italy
11
2 Laboratory of Biochemistry F. Pacini, Reggio Calabria, Italy;
12
3Department of General Surgery and Senology, University Hospital Company, Catania, Italy;
13
14
15
* Correspondence: [email protected]; Tel.: +39-0532-974213
16
Academic Editor: Prof. Dr. José Miguel Mateos Roco
17
18
19
Abstract: The heat and matter transfer during glucose catabolism in living systems and their relation
20
with entropy production are a challenging subject of the classical thermodynamics applied to biology.
21
In this respect, an analogy between mechanics and thermodynamics has been performed via the
22
definition of the entropy density acceleration expressed by the time derivative of the rate of entropy
23
density and related to heat and matter transfer in minimum living systems. Cells are regarded as
24
open thermodynamic systems that exchange heat and matter resulting from irreversible processes
25
with the intercellular environment. Prigogine’s minimum energy dissipation principle is
26
reformulated using the notion of entropy density acceleration applied to glucose catabolism. It is
27
shown that, for out-of-equilibrium states, the calculated entropy density acceleration is finite and
28
negative and approaches as a function of time a zero value at global thermodynamic equilibrium for
29
heat and matter transfer independently of the cell type and the metabolic pathway. These results
30
could be important for a deeper understanding of entropy generation and its correlation with heat
31
transfer in cell biology with special regard to glucose catabolism representing the prototype of
32
irreversible reactions and a crucial metabolic pathway in stem cells and cancer stem cells.
33
34
Keywords: Entropy generation; entropy acceleration; glucose catabolism; irreversible reactions; heat
35
transfer; matter transfer; cancer biology; stem cell biology
36
37
1. Introduction
38
39
In nature, irreversible processes play a crucial role in maintenance of life for their special chemical
40
and physical features [1-4]. Regarding this, it is well-known that products of irreversible reactions
41
are characterized by a chemical stability that gives them a temporal stabilization and a precise time
42
arrow. Hence, it is very interesting to understand the thermodynamics of irreversible reactions
43
occurring in minimum living systems investigating the relation between irreversibility and
44
information. The physical quantity able to describe in a unitary way the irreversibility and
45
information in minimum living systems is entropy [5]. In this respect, very recently, it has been
46
proposed a new variable, the entropy of entropy, enabling to measure the complexity for biological
47
systems through the combination of the multiscale entropy analysis and an alternate measure of
48
information, called the superinformation [6]. Within Prigogine’s framework of non-equilibrium
49
thermodynamics, the local entropy production as a function of time is a key quantity strictly related
50
to the energy dissipation of a system that continuously decreases during development, growing and
51
aging [7,8].
52
Among irreversible reactions in minimum living systems the most representative are the ones
53
occurring in glucose catabolism characterized by both lactic acid fermentation and respiration
54
metabolic pathways. Since the observation of a prevalent lactic acid fermentation in cancer cells, the
55
so-called Warburg effect or aerobic glycolysis, many efforts were done to understand the origin of
56
this behaviour in cancer cells and cancer stem cells [9-11]. On the other hand, in the last years also the
57
study of the metabolic network and of the mitochondria network have received a special attention
58
[12].
59
In recent years, it has also been highlighted and demonstrated the strict connection between
60
thermodynamic irreversibility and information resulting from the strong influence of metabolic
61
patterns on genetic and epigenetic patterns in biological systems, the study of the generation of
62
entropy in normal, cancer and stem cells [11-15]. Attention should focus not only on cell biology but
63
also on the thermodynamic description of cells and of the living systems because this different
64
perspective could offer a unitary view of metabolomics, genomics and epigenomics. In other words,
65
the measurement of entropy flow and the study of the thermodynamic behaviour of living systems
66
could allow the measurement of a finite quantity represented by entropy, which correlates the many
67
different aspects of life networks. Indeed, all subsystems of the complex cellular building are joined
68
together by a unified thermodynamic time arrow and must follow the same behaviour, that is, the
69
global thermodynamic behaviour coincides with the one of all the subsystems of the considered
70
object [16, 17].
71
Entropy generation due to heat and matter transfer in cells has been investigated in terms of
72
Prigogine’s rate of entropy production [18]. For example, entropy production may select
non-73
equilibrium states in multi-stable systems [19], while reaction-diffusion thermodynamics and
74
entropy production may constrain organism performance at higher temperatures yielding optimal
75
temperatures at which biochemical reactions occurr [20]. Generally, entropy generation occurs in
76
non-equilibrium systems that can be described, for instance, by means of stochastic Langevin
77
differential equation and Fokker-Planck equation [21-23].
78
An important debate on this topic is about the possible compatibility of the maximum and the
79
minimum entropy production principle or if one of the two principles could be selected in relation to
80
the boundary conditions [24]. The proof and validity of the maximum entropy production principle
81
was debated so far [25-33] and, for a part of the community, is still an open question with several
82
attempts to disprove it. However, very recently a convincing argument in its favour in terms of
83
stochastic thermodynamics has solved the apparent contradictions of the maximum entropy
84
production principle and shown that is not in incompatible with the principle of minimum entropy
85
production [19]. The latter is fulfilled when thermodynamic systems that are close to equilibrium
86
flow towards the global thermodynamic equilibrium when the rate of entropy density production
87
reaches its minimum value (zero value). This scheme can be applied to any thermodynamic system
88
including irreversible processes in minimum living systems like cells behaving as open systems and
89
reversibly exchanging both energy, in the form of heat, and matter with the intercellular
90
environment.
91
In our recent works on the subject [34, 35], we have studied not only the usual local entropy
92
production defined, in our framework, rate of internal entropy density production (RIEDP) but also
93
the rate of external entropy density production (REEDP) that is related to heat and matter flows from
94
the cell to the environment due to irreversible processes occurring inside cells. Both contributions
95
reduce with increasing time and vanish at global thermodynamic equilibrium. REEDP is usually
96
called in the literature entropy flow or entropy flow rate [7, 18, 19,22] to indicate the entropy
generated by flows of heat and matter either from the system to the environment or from the
98
environment to the system. However, in our framework, restricted to the entropy generation of a
99
single cell, the REEDP is referred to the rate of entropy density production in the intercellular
100
environment due to the irreversible processes occurring inside the cell. In this respect, we have not
101
considered the flows of heat and matter from the environment towards the cell that would
102
correspond to a negative rate for the environment (but positive for the cell) and a resulting negative
103
REEDP.
104
We have already proved that both RIEDP and REEDP fulfil Prigogine’s minimum energy
105
dissipation principle [34, 35] that corresponds to the minimum rate of entropy production principle.
106
Let us introduce a dissipative function Ψ = TdSi/dt where Si is the entropy of the system with T the
107
temperature. We get dΨ/dt≤ 0 that tends to be minimum (zero) in a steady-state (and as a special case
108
of steady state at global thermodynamic equilibrium) [7]. In this study, we prove Prigogine’s
109
minimum energy dissipation principle via the calculation of the time derivative of the rate of entropy
110
density production that we define as the entropy density acceleration generated by heat and matter
111
transfer inside cells and with the intercellular environment in irreversible reactions such as the ones
112
characterizing glucose catabolism. In this way, we reformulate Prigogine’s minimum energy
113
dissipation principle by means of the calculation of the entropy density acceleration inside and
114
outside a normal or cancer cell performing also the derivative of the REEDP or entropy flow showing
115
that the acceleration both inside and outside the cell approaches zero at global thermodynamic
116
equilibrium. These calculations allow us to understand better the entity of the entropy production at
117
the starting instants of time of the irreversible processes when the system is out-of-equilibrium and
118
to strengthen the principle of minimum entropy production at global thermodynamic equilibrium
119
and its strict relation with the minimum energy dissipation principle.
120
The key result of this work is the rigorous demonstration, by means of analytical and numerical
121
calculations, of the reduction of entropy density acceleration with increasing time and its vanishing
122
at global thermodynamic equilibrium. In particular, we have found that, during heat and matter
123
transfer in either normal or cancer cells, the entropy density “decelerates” due to the negative value
124
of the entropy density acceleration passing, as a function of time, from one local equilibrium state
125
(but global non-equilibrium) to the following local equilibrium state. This “deceleration” approaches
126
zero at large times corresponding to the global thermodynamic equilibrium.
127
These findings allow us to propose a reformulation of Prigogine’s minimum energy dissipation
128
principle in terms of the vanishing of the entropy density acceleration at global equilibrium and to
129
apply it to the most representative catabolic process occurring in cells, the glucose catabolism. The
130
results obtained for glucose catabolism can be generalized to any kind of irreversible reactions
131
occurring in either normal or cancer cells of living systems.
132
133
2. Methods
134
135
In this section, we derive the general expressions of the entropy density acceleration for glucose
136
catabolism resulting from the rates of entropy density calculated in [34, 35] and based on
137
thermodynamic and statistical principles.
138
139
2.1 Entropy density acceleration for glucose catabolism
140
141
To calculate the entropy density acceleration for glucose catabolism defined as the time derivative
142
of the rate of entropy density, namely a(x,t) = ∂r(x,t)/∂t, we recall the general definition of the rate of
143
entropy density production decomposed as r(x,t) = ri(x,t)+ re (x,t). Here, ri =dsi/dt≥0 is the RIEDP with,
144
in a compact form, si=Si/V (Si is the internal entropy and V is the volume of the thermodynamic
145
system) the internal entropy density and re =dse/dt is the REEDP with, in a compact form, se=Se/V (Se
146
is the external entropy) the external entropy density. This latter quantity is often called in the
147
literature the entropy flow or entropy flow rate or entropy production rate of the system [18, 19, 22].
However, for the sake of simplicity, we have adopted the same nomenclature of the internal
149
contribution.
150
We remind that, in our previous works on the subject [34, 35], we have called REEDP the rate of
151
entropy density contributions expressing the entropy flow rate of heat and matter reversibly
152
exchanged from inside the cell to the intercellular environment and due to irreversible processes
153
occurring inside the cell. This results in an increase of the rate of entropy production in the
154
intercellular environment (external to the system represented by the cell) at the expenses of an equal
155
decrease of the rate in the cell. This means that, if we consider the REEDP or entropy flow rate as
156
referred to a loss of the rate of entropy density production of the cell regarded as the thermodynamic
157
system exchanging entropy with the environment, we should take it with the negative sign as is
158
usually done in the literature [19, 22]. However, in our framework according to which we consider
159
the whole thermodynamic system decomposed into two subsystems, the cell and the intercellular
160
environment, the entropy density flow rate should be interpreted as a gain for the intercellular
161
environment and taken with the positive sign and added to the RIEDP.
162
Of course, when one deals with an open thermodynamic system undergoing state changes due to
163
external driving forces also the entropy flow rate from the environment into the system should be
164
taken into account. At a non-equilibrium steady state, the time averaged entropy change is zero due
165
to the balancing between the entropy flow rate (either from the system to the environment or from
166
the environment into the system) and the rate of internal entropy production [19, 22]. However, in
167
our framework, we do not deal with driving forces external to the system and consequently with the
168
entropy flow rate from the environment to the system since we are considering the rate of entropy
169
produced by a single cell and consequently the entropy flow rate from the system to the environment.
170
At global thermodynamic equilibrium, all quantities are zero.
171
More specifically, in our framework, ri(x,t) = ri Q(x,t) + ri D(x,t) + ri r(x,t), with ri Q(x,t) the contribution
172
due to heat flow and transfer inside the cell, ri D(x,t) the one associated to molecules diffusion and
173
internal transport and ri r(x,t) the one due to irreversible chemical reactions occurring inside the cell.
174
Hence, we get ai(x,t) = ∂ri(x,t)/∂t for the internal entropy density acceleration (IEDA) with ai(x,t) =
175
aiQ(x,t) + aiD(x,t) + air(x,t). Instead, re(x,t) = re Q(x,t) + re exch(x,t) with re Q(x,t) (re exch(x,t)) the contribution
176
due to the heat transfer (matter exchange) from the cell to the intercellular environment. As a result,
177
the external entropy density acceleration (EEDA), ae(x,t) = ∂re(x,t)/∂t includes two contributions, ae(x,t)
178
= aeQ(x,t) + ae exch(x,t) where aeQ(x,t) = ∂reQ(x,t)/∂t (ae exch(x,t) = ∂re exch(x,t)/ ∂dt) is the acceleration
179
contribution related to heat (matter) transfer between the cell and the intercellular environment.
180
Therefore, owing to the previous definitions a(x,t) = ai(x,t) + ae(x,t) is the total acceleration. We note,
181
according to this framework, that the entropy density acceleration has a time and space dependence
182
and this latter dependence is still one-dimensional as for r(x,t) = ri(x,t)+ re(x,t).
183
184
185
2.2 Internal entropy density acceleration for glucose catabolism
186
187
In this subsection, we calculate the contributions to the IEDA relevant to glucose catabolism with
188
special regard to lactic acid fermentation and respiration processes. In the calculations, we have taken
189
into account the same assumptions made in our previous studies about the shape of the cells (cubic),
190
the features of the heat and mass flows (unidirectional), the kind of tissue and so on [34, 35] based on
191
direct observations for any kinds of cells (normal or cancer). The IEDA ai Q(x,t) due to heat transfer
192
inside the cell is:
193
194
195
(1)
196
197
Here, with N the number of chemical species, JQ is the irreversible heat flow, JD k is the
198
diffusion flow of the kth chemical species, uk is the partial molar energy and Fu(x,t)=∇(1/T(x,t))
199
is the heat thermodynamic force driving Ju with T(x,t) the temperature distribution. Instead, the IEDA
200
due to mass diffusion and matter exchange inside the cell assumes the form:
201
202
k
N
u Q D k
k u
=1
= +
J J J
( )
( )
( )
.a
t
∂
= ⋅
∂
iQ x,t x,t
T x,t u
1
203
(2)204
205
206
where the diffusion flow JDk is driven by the matter thermodynamic force Fk(x,t)=∇(μk(x,t)/T(x,t))
207
with μk the chemical potential of the kth chemical species. The entropy density acceleration generated
208
by the chemical irreversible reactions reads:
209
210
(3)
211
212
with the affinity of the jth chemical reaction (M is the number of chemical
213
reactions) with νjk the stoichiometric coefficients, and vj=1/Vcelldξj/dt is the velocity of the jth reaction
214
with dξj the variation of the jth degree of advancement. We now calculate the IEDA ai Q(x,t) = dri Q
215
(x,t)/dt associated to the heat flow during glucose catabolism recalling the expression of riQ(x,t) [35]:
216
217
218
219
220
221
(4)222
223
Here, K is the thermal conductivity, L is the side of the cubic cell, κ is the thermal diffusivity in water
224
and τ is a characteristic decay time. The coefficient p = 0.85 (0.90) expresses the frequency of
225
occurrence of glucose catabolism in a normal (cancer) cell. According to the model, we assume that
226
this contribution is the same for lactic acid fermentation and respiration processes. The IEDA
227
associated to heat transfer inside the cell is:
228
229
230
231
232
233
234
235
236
237
238
239
(5)240
241
242
243
244
245
246
aiQ(x,t) includes two terms depending on the trigonometric series: the first term is inversely
247
proportional to the characteristic decay time, while the second one is proportional to the thermal
248
conductivity.
249
We now determine the IEDA ai D(x,t) = ∂ri D (x,t)/∂t either for respiration or fermentation process
250
recalling the corresponding rate of entropy density [35]:
251
252
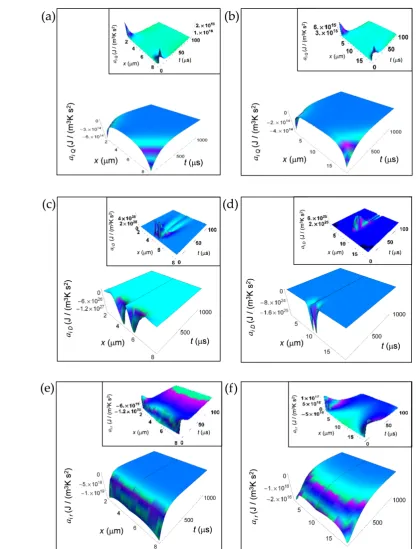
253
254
255
256
( ) ( )( )
( )( )
2 2 2 2 . x L π ∞ ∞
n 2 2 i Q π tκ n Lt -τ
n e e
π
r x,t = p K
L κ n πt
π L
n x e
n L 2 + =1 2 2 - 2 -1 cos 2 -1
- 2 -1 1 sin 2 -1
2 -1 n= 2 + 1 ( ) ( ) ( ) ( ) ( ) ( ) ( ) ( ) ( ) 2 2 2 2 2 2 1 2 a x L x L π π ∞ ∞ ∞ = − × + + 2 2 n n 2 2 i Q x,t
π
t κ n t
-π τ L
p K e n e
L
π
κ n t
π L
n x e
n L
π
κ n t
L
n e
τ
π
n n x
L π κ L + =1 + =1 2 2 2
- 2 -1 cos 2 - 1
- 2 -1 1
sin 2 - 1 2 - 1
- 2 -1 cos 2 - 1
2 - 1 sin 2 - 1
n= 2 + 1 ( ) ( ) ( ) ( ) ( )
( )2 ( ) ( )
2 2 2 2 2 2 2 2 cos x L π ∞ ∞ ∞ ∞ − n π π
κ n t κ n t
L L
e n e
π
κ n t
π L
n n x e
π L
κ n t
π L
n x e
n L + =1 2 2 2 2
- 2 -1 - 2 -1
cos 2 - 1
- 2 -1 2 - 1 2 - 1
- 2 -1 1
sin 2 - 1 2 - 1
n= n= n= + 1 + 1 + 1 .
( )
N( )
jk kj k
A x,t = - =1ν μ x,t
( )
( )
( )
( )
, a t ∂ = − ⋅ ∂
k i D k μ x,t x,t x,tT x,t D k
=1 N ∇ J
( )
( )
( )
, r a t ∂ = ∂
Mi j j
j
x,t A x,t v
T x,t =1
257
258
259
260
(6)261
262
263
Here, α = ferm, resp where “ferm” stands for fermentation and “resp” for respiration, T0 is the
264
maximum cell temperature, Vcell is volume of the cubic cell with L the side of the average cube, Nα is
265
the number of chemical species in either the respiration or fermentation process, Dk is the diffusion
266
constant of the kth chemical species, μk = uke-(|x-L/2|/L + t/τ) is the kth species chemical potential, and Nm k
267
is the number of moles of the kth chemical species. The IEDA associated to matter diffusion inside
268
the cell either for respiration or fermentation process reads:
269
270
271
272
273
274
275
276
277
278
279
280
281
282
283
284
285
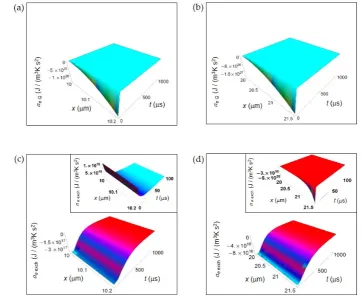
(7)286
287
288
289
290
291
292
ai Dα(x,t) consists of three contributions each of them weighted by the trigonometric series.
293
Taking into account the weights wferm and wresp expressing the frequency of occurrence of
294
respiration and fermentation process in a normal and in a cancer cell (see Section 3, Results), we write
295
the total acceleration contribution ai D due to the two metabolic pathways as:
296
297
ai D(x,t) = wresp ai D resp(x,t) + wferm ai D ferm(x,t) (8)
298
299
Finally, we compute the IEDA ai r(x,t) = ∂ri r (x,t)/∂t caused by irreversible reactions occurring inside
300
the cell during glucose catabolism via the corresponding rate expressed in the form [35]:
301
302
303
304
305
(9)306
307
308
( )
(
)
(
)
2 22 , n x α α α +∞
k k m
i r
N L
k
-|x- |/L -t/τ
e k ν u e N
π
r x,t
-T V π
n - -κ n- π t
L e L
n -kin 0 2 Glucose =1 cell 1 1 = 4
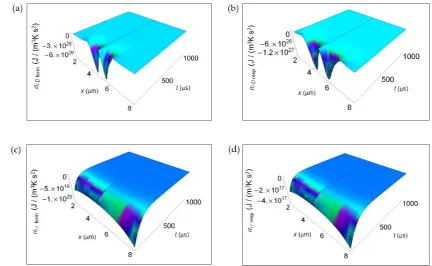
sin 2 1 2 1
2 1 =1 ( ) ( ) ( ) ( ) ( ) ( ) + 2 2 2 2 2 α α ∞
m k nk k N i D k π
κ n t
2 π L x L/ L
x-L/ n x e e
t
-τ N - D t L
x L e
π k
r x,t u e
T t D κ n πt
π L
n x e
n L 3 2 3 2 0 2 2 =1 cell
- 2 -1 -| - 2|/ cos 2 - 1
4 - /2
1 1 =
16 V
- 2 -1 1
sin 2 - 1 2 - 1
=1 + 1 ∞
n 2 = . ( ) ( ) ( ) ( ) ( ) + 5 3 2 23 1 1 1 2 a t t α α ∞ + n m k k k N
i D k
2 π
κ n t
π L2 x L/ L
2 n x e e
x-L/2 L
-t N D t
-π τ k
x,t x L e u e
T τ D
π
n x
n L
3 2
0 cell =1
2 - 2 -1
-| - 2|/ cos 2 - 1
4 1 1
= - - /2 16 V
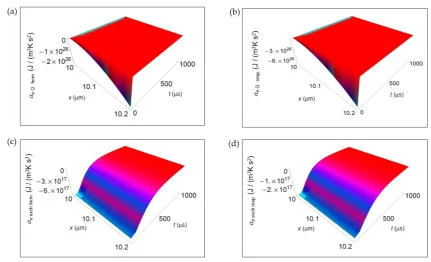
1
sin 2 - 1 2 - 1 =1 ( ) ( ) + 1 3 + 1 + 4 α ∞ n m k k 2 k k N k 2 π
κ n t
2 L e 2 x-L/2 t -τ - D t N
x L e
π k
u e
T t D D t
2
3 2
3 2
0 cell =1
2 - 2 -1
cos 2 4 - /2 1 1 16 V = ( ) ( ) ( ) ( ) ( ) ( ) + + 1 + + ∞ ∞ n n 2 π
κ n t
π L2 x L/ L
n x e e
L
2 π
κ n t
π L2
n x e
n L
t -τ
x L e
π T
π
t n x
n L 2 3 2 0 3 2 cell 2 - 2 -1
-| - 2|/ - 1
2 - 2 -1 1
sin 2 - 1 2 - 1
- /2 1 1
16 V
1
sin 2 - 1 2 - 1
= = 1 ( ) ( ) ( ) ( ) ( ) ( ) 2 2 2 2 2 2 2 x L α π ∞ ∞ ∞ × 2 m k k 2 k n N k 2 x-L/2 -D t
N k π
u e κ
L D
π
κ n t
L e
π π
κ n t κ n t
π L L
n n x e n e
L + =1 2 =1 2 2 4 - 2 -1
- 2 -1 - 2 -1 2 - 1 sin 2 - 1 cos 2 - 1
n= n= 2 + 1 + 1 ( ) ( )
( )2 ( ) ( )
2 2 2 2 cos ∞ ∞ − π
κ n t
π L
n n x e
π L
κ n t
π L
n x e
n L
2
2
- 2 -1 2 - 1 2 - 1
- 2 -1 1
sin 2 - 1 2 - 1
with kkin α the kinetic constant, νk stoichiometric coefficients and Nm Glucose the number of glucose moles
309
(note the typo error L/2 –x in the argument of the sine in Eq.(4) and Eqs.(10-11) of [35]). We get ai r(x,t)
310
either for respiration or for lactic acid fermentation:
311
312
313
314
315
316
317
318
319
(10)320
321
322
323
We express the entropy density acceleration due to irreversible reactions during glucose catabolism
324
in the form:
325
326
ai r = wrespai r resp + wfermai r ferm (11)
327
328
with different weights for respiration and fermentation process (See Section 3, Results).
329
330
2.3 External entropy density acceleration for glucose catabolism
331
332
In this subsection, we calculate the external entropy density acceleration (EEDA) starting from
333
the corresponding REEDP calculated in [34,35]. The EEDA ae(x,t) = ∂re(x,t)/∂t includes two
334
contributions, namely ae(x,t) = ae Q(x,t) + ae exch(x,t). Here, ae Q(x,t) = ∂re Q(x,t)/∂t (ae exch(x,t)=∂re exch(x,t)/∂t)
335
is the acceleration contribution related to heat (matter) transfer between the cell and the intercellular
336
environment. The general expression for ae Q(x,t) reads:
337
338
339
(12)340
341
where Tic is the intercellular temperature and dQ/dt is the time derivative of the heat. Instead, the
342
general expression for ae exch takes the form:
343
344
345
(13)346
347
348
where Nm kis the number of moles of the kth product of reaction.
349
To calculate the ae Qcontribution to EEDA, we recall the corresponding REEDP for respiration and
350
fermentation process [35]:
351
352
(14)353
354
355
where, kB = 1.3805 × 10⁻²³ J/K is the Boltzmann constant, Nm pr resp (N m pr ferm) is the number of moles of
356
the products in respiration (fermentation) process. Note the contribution proportional to 1/t on the
357
second member that breaks the time reversal symmetry [34] as occurs for the other rate contributions.
358
In principle, at small distances from the border of the cell (for small x) the term proportional to 1/t is
359
greater than the term proportional to 1/t2 resulting in a negative re Q for the typical intercellular size.
360
However, in our model, we have set ourselves under the hypothesis of large x and small t (1000 μs
361
<< 1 s) neglecting the term proportional to 1/t even close to the cell border yielding:
362
( ) ( ) ( ) ( ) ( ) ( ) ( ) 1 2 2 kin 2 2 2 2 2 2 1 n n ai r n x x L x α α α τ +∞ − +∞ × −
k k m
N
k
L -|x- |/L
π -t/τ
x,t e k ν u e N
T V
π
-κ n- t
π L
n - e
π
n - -κ n- πt L
π
L L
e κ
n - π
n -L e n -0 Glucose =1 cell
1 1 2
= 4
2 1 2 - 1 sin 2 1
sin 2 1 2 1
2 1
sin 2 1
2 1 =1 =1 ( ) 2 2 2 2 . n +∞
-κ2 1n- πLt=1
( ) V pr 1( ) 2t
α α
−
B A m
Q
re x,t = k N N x - L
κ t
,
2
2
cell 1 3
8
( )
( )
1 1 .V
a ∂
∂
e Q
dQ x,t =
t T x,tic cell dt
( )
( )
pr( )
exch
1
,
a ∂
∂
e m k
k N
e
k
d N
x,t = - μ x,t
363
364
(15)
365
366
This assumption has allowed us to get a positive re Q for any x outside the cell and any t. This means
367
that the entropy outside the cell increases because of the heat released by the irreversible reactions
368
occurring inside the cell but this increase leads to a decrease of the rate of entropy of the cell because
369
heat is removed from the cell. Hence, the EEDA ae Q(x,t) takes the simple form:
370
371
(16)
372
373
374
The total entropy density acceleration reads:
375
376
aeQ = wrespaeQresp+wfermaeQferm,
(17)
377
378
with different weights for a normal and a cancer cell (See Section 3, Results).
379
Let us now calculate the last entropy acceleration contribution caused by irreversible exchange of
380
matter. To do this we recall the REEDP due to irreversible exchange of matter with the intercellular
381
environment during glucose catabolism [35]:
382
383
384
385
(18)
386
387
Here, x0 = 10 μm is a characteristic length having the size of a normal cell, dτβ (β=1,2 with 1 referred to
388
respiration and 2 to fermentation) is a characteristic time such that 1/dτ1 (1/dτ1) is 10-5 s-1 (10-4 s-1) of
389
the order of kkin, Npr resp (Npr ferm) is the number of products of the respiration (fermentation) process.
390
Also this matter contribution has a positive contribution if referred to the intercellular environment
391
but it would be taken as negative if referred to the cell because matter exchange leads to a removal of
392
the products of irreversible reactions from the cell.
393
The EEDA ae exch α(x,t) = dre exch(x,t)/dt resulting from irreversible exchange of matter with the
394
intercellular environment turns out to be:
395
396
397
(19)
398
399
400
We calculate the entropy acceleration related to exchange of matter with the intercellular
401
environment as:
402
403
ae exch = wfermae exch ferm + wrespae exch resp (20)
404
405
with different weights for a normal and a cancer cell (See Section 3, Results).
406
407
408
3. Results
409
410
In this section, we compute the IEDA and the EEDA generated by inner and outer heat and matter
411
transfer either a normal or a cancer cell during glucose catabolism by performing the numerical
412
derivatives of the corresponding RIEDP and REEDP whose analytical expressions were given in
413
Section 2. Indeed, the analytical computation of the IEDA would lead to some convergence problems
414
( ) pr 1( ) . V
α B A α
Q
re x,t k N Nm x - L
κ t
2
2
cell 1 3
8
( )
V prα(
)
α − B A
m Q
N N
ae x,t k x - L .
κ t 2
3
cell
1 3 8
( ) ( )
2
. V
α
β
α α
e k
x-L Npr
L x- |/L
κt 2
k
πκt
r x,t = - e e u e
T x
d Ne m
-| k
- t/τ
dτ
exch
0 0
4
cell =1
4
1 1
( )
( )(
)
2
2
3 2
1 1
V
2
a
t
t
α β
α
α π
− +
x-L
L
x m k
κt 2
k
Npr d N
e
e dτ
k x - L
πκ
x,t = e e πκt u e
T x τ κ
-| - |/L - t/τ
4
0 0
exch
cell =1
1 1
due to their complex analytical expressions involving several trigonometric series depending on the
415
index n.
416
We first determine the entropy density acceleration taking into account the occurrence of both
417
respiration and fermentation metabolic pathways occurring with different weights in a normal and
418
cancer cell. Then, we single out the entropy density acceleration due to either respiration or lactic
419
acid fermentation in a representative cell having the size of a normal cell. Cell respiration consists of
420
three steps, viz. glycolysis, Krebs cycle and oxidative phosphorylation involving glucose and oxygen,
421
C6H12O6 + 6O2→ 6 CO2 + 6 H2O and leading to the formation of carbon dioxide (CO2) and water (H2O).
422
Instead, fermentation process consists only of glycolytic step, C6H12O6→ 2 C3H5 O3- + 2 H+ and leads
423
to the formation of lactic acid ions (C3H5 O3-) and hydrogen ions (H+).
424
For consistency, in the numerical calculations of acceleration densities, we have employed the
425
same numerical parameters used in our previous studies [34, 35]. In particular, we have taken an
426
average size L = 10 μm (L = 20 μm) for the normal cell (cancer cell) taking as referencethe breast
427
epithelium and assuming, without loss of generality, a cubic shape and an average size of the
428
intercellular space about 0.2-0.3 μm (1.5 μm) between two adjacent normal (cancer) cells. For all
429
acceleration entropy densities, we have chosen τ≈ 10-4 s as a typical cell decaying time. We have taken
430
as weights for respiration (fermentation) process wresp=0.8 (wferm=0.2) in a normal cell and wresp=0.1
431
(wferm=0.9) in a cancer cell. We have also used for both normal and cancer cells the following
432
parameters:
433
thermal conductivity K = 0.600 J/ (m s K), thermal diffusivity in water κH20 = 0.143 ×10⁻⁶ m2/s, diffusion
434
constants at standard conditions: DC6H12O6 = 6.73 × 10⁻¹⁰ m2s-1, DO2 = 21.00 × 10⁻¹⁰ m2s-1, DcO2 = 19.20
435
kJ/mole × 10-10 m2s-1, DH2O = 21.00 × 10⁻¹⁰ m2s-1, DC3H5O3- = 9.00 × 10⁻¹⁰ m2s-1 and DH+ = 45.00 × 10⁻¹⁰ m2s-1 in
436
aqueous solution. Finally, we have employed the partial molar energies or chemical potentials at t =
437
0 and x = L/2 and, at standard conditions: μC6H12O6 = -917.44 kJ/mole, μO2 = 16.44 kJ/mole, μcO2= -385.99
438
kJ/mole, μH2O = -237.18 kJ/mole, μC3H5O3- = -516.72 kJ/mole where C3H5O3- is the lactate ion and μH+ = 0
439
kJ/mole in aqueous solution.
440
In particular, for the calculation of ai Q we have taken as frequency of occurrence of glucose
441
catabolism the value p = 0.85 (0.90) for normal (cancer) cells, while for the calculation of air we have
442
taken as values of the pathway kinetic constants kkinresp = 10-5 s-1 and kkinferm = 10-4 s-1, and Nm Glucose = 1 as
443
a reference concentration.
444
445
446
3.1 Entropy density accelerations for normal and cancer cells: numerical calculations
447
448
In this study, we show the numerical calculations of the IEDA and EEDA for normal and cancer
449
breast cells. For every term, we represent the corresponding acceleration entropy density as a
450
function of the spatial coordinate x and of the time coordinate t. We choose for all accelerations a time
451
interval Δt =1000 μs, a Δt typical of most biological processes [35].
452
Note that in the main panels we plot all the entropy density accelerations in the time interval 100
453
÷1000 μs with the exception of ae Q. Indeed, in the first instants of time (0÷100 μs), some terms of the
454
entropy density acceleration are positive as depicted in the insets and, due to the appreciable
455
magnitude, this would mask the leading negative trend of the accelerations in the time interval
456
100÷1000 μs. The positive trend of most of the accelerations during the first instants of time is not
457
surprising and is due to the initial increasing behavior of the corresponding rates. Of course, this
458
behaviour is only secondary to the leading and most important negative trend characterizing all the
459
entropy density accelerations.
460
461
462
3.1 Internal entropy density acceleration: numerical calculations
463
464
In this section, we show the spatial and time dependence of the IEDA obtained from the previous
465
formalism.
466
In Figure 1, we display the IEDA space and time profiles for both normal and cancer cells resulting
467
from the heat and matter transfer inside cells and from the irreversible chemical reactions in the
representative time interval 100 ÷1000 s. The common features are: 1) the negative value of the IEDA
469
corresponding to a “deceleration” and 2) their increase with increasing time. Figure 1(a) and (b) show
470
aiQ calculated according to Equation (5) for a normal and a cancer cell, respectively. For both kinds of
471
cells, ai Q dramatically increases with time close to the cell borders, while in the region close to the cell
472
center exhibits a weak increase and an almost flat profile especially in the cancer cell. For t > 500 μs
473
the spatial and time profile of ai Q is rather flat passing from the borders to the cell center and
474
approaches zero with increasing time.
475
In contrast, aiDobtained from Equation (7) and Equation (8) exhibits a strong increase in the central
476
region of the cell for the initial instants of time in both kinds of cells tending to zero for increasing
477
time in the whole cell and exhibiting a flat profile (Figure 2(c) and (d)). Note the narrower shape of ai
478
Din a cancer cell with respect to that in a normal cell, its higher rate of increase at the initial instants
479
of time and a minimum value that is two orders of magnitude less than that of a normal cell. We
480
attribute the general trend to the prevalence of the fermentation process in the cancer cell, while the
481
lesser deep minimum is related to the bigger size of the cancer cell.
482
Finally, in Figure 1(e) and (f) we depict aircomputed according to Equation (10) and Equation (11).
483
air uniformly increases throughout the whole cell with increasing time but the rate of increase is much
484
higher in a normal cell with respect to a cancer cell. Indeed, for a normal cell air approaches values
485
close to zero for t less than 500 μs, while for a cancer cell this occurs for t more than 500 μs. This slower
486
tendency towards zero in a cancer cell could be due to the prevalence of lactic acid fermentation.
487
Moreover, the minimum value of air in a cancer cell is three orders of magnitude less than that of a
488
normal cell and this is in part due to the bigger size of the cancer cell.
489
In the insets of Fig.1, we have plotted the IEDA for the initial instants of time (interval 0 ÷ 100 μs).
490
Interestingly, every contribution is positive with the exception of ai r for a normal cell that is negative
491
throughout the whole cell and ai r for a cancer cell that is negative especially in the central part of the
492
cell. In particular, ai Q for both a normal and a cancer cell and ai rfor a cancer cell exhibit positive values
493
close to the cell borders, while ai D exhibits remarkable positive values close to the cell centre with
494
some differences as a function of time between a normal and a cancer cell. The positive trend of these
495
contributions reflects the increase of the corresponding rates at the first instants of time. The positive
496
behaviour of ai r in a cancer cell close to the cell borders could be due to the prevalence of the
497
fermentation process with respect to the respiration process.
523
524
525
526
527
528
529
530
531
532
533
534
535
536
537
538
539
540
541
542
543
544
545
546
547
548
549
550
551
552
553
554
555
556
557
558
559
560
561
562
563
564
565
Figure 1. IEDA generated by heat, matter and irreversible reactions during glucose catabolism for a time interval
566
of 1000 μs. (a) Calculated aiQ for a normal cell. Inset: calculated aiQ for a normal cell in the interval 0 ÷ 100 μs. (b)
567
As in panel (a) but for a cancer cell. (c) Calculated aiD for a normal cell. Inset: calculated aiD for a normal cell in
568
the interval 0 ÷ 100 μs. (d) As in panel (c) but for a cancer cell. (e) Calculated ai r for a normal cell. . Inset: calculated
569
air for a normal cell in the interval 0 ÷ 100 μs. (f) As in panel (e) but for a cancer cell.
3.2 External entropy density acceleration: numerical calculations
577
578
In this section, we show the spatial and time dependence of the EEDA obtained from the previous
579
formalism.
580
Figure 2 shows the EEDA spatial and time profiles generated by heat and matter transfer from
581
the cell to the intercellular environment. In Figure 2(a) and (b) we depict the calculated aeQ for a
582
normal and a cancer cell, respectively calculated according to Equation (16) and Equation (17). For
583
this entropy density acceleration, we have performed the numerical calculations taking the interval
584
of time 0 -1000 μs because aeQ, unlike the other contributions, does not exhibit a positive trend during
585
the interval of time 0 -100 μs.
586
The more one gets away from the border of the cell, the more the trend of entropy density
587
acceleration becomes sharp exhibiting a strong increase during the initial instants of time that is very
588
similar both in a normal and in a cancer cell. After the initial instants of time, the spatial and time
589
profile of aeQ becomes flat tending to vanish with increasing t.
590
591
592
593
594
595
596
597
598
599
600
601
602
603
604
605
606
607
608
609
610
611
612
613
614
615
Figure 2. EEDA associated to heat and matter transfer between the cell and the intercellular envinronment. (a)
616
Calculated ae Q for a normal cell. (b) As in (a), but for a cancer cell. (c) Calculated ae exchfor a normal cell. Inset:
617
calculated ae exch for a normal cell in the interval 0 ÷ 100 μs. (d) As in (c), but for a cancer cell.
618
619
In Fig.2(c) and (d) are displayed the ae exch for a normal and a cancer cell calculated according to
620
Equation (19) and Equation (20). The general trend is a uniform increase throughout the intercellular
621
environment during the first instants of time. A sharper increase of ae exch characterizes the cancer cell
622
because of the prevalence of the fermentation process. However, on average the absolute value of ae
623
exch for a cancer cell is less than for a normal cell. For t larger than 500 μs, in both cases ae exch approaches
624
zero with increasing time. In the insets of Figure 2(c) and Figure 2(d), ae exch plotted in the first instants
625
of time (interval 0 ÷ 100 μs) show an opposite behaviour taking positive values for a normal cell, and
626
negative values for a cancer cell. This is not surprising and may be attributed to the different size of
627
the cells
628
Figure 3 shows the IEDA spatial and time profiles (time interval 100 ÷1000 μs) due to matter
629
transfer under the hypothesis of either fermentation or respiration metabolic pathways inside a
representative cell having the size of a normal cell. In Figure 3 (a) and (b), we depict ai D resulting
631
from lactic acid fermentation and respiration processes, respectively and calculated by means of
632
Equation(7). In the first instants of time, there is a strong rate of increase of ai D in the central region
633
of the cell for both processes where ai D is strongly negative. However, there is a broader spatial and
634
time dependence of ai D for respiration leading to a more extended region of the cell having negative
635
ai D for small t. In addition, also the minimum of ai D symmetric on the left and on the right of the
636
centre of the cell is deeper for respiration. For both processes with increasing time ai D becomes flat
637
and approaches zero. Figure 3(c) and (d) display the corresponding ai r of the metabolic pathways
638
calculated via Equation (10). Unlike ai D, there are not relevant differences in the spatial trends of ai r in
639
the two processes that are uniformly negative throughout the cell even though the minimum for
640
fermentation is much deeper than that for respiration. This trend is in part due to the kinetic constant
641
kkinresp that is one order of magnitude less than kkinferm.
642
643
644
645
646
647
648
649
650
651
652
653
654
655
656
657
658
659
660
661
662
663
664
665
Figure 3. IEDA associated to matter transfer inside the cell for lactic acid fermentation and respiration. A
666
representative cell having the size of a normal cell is depicted. (a) Calculated ai D for fermentation process. (b) As
667
in (a), but for respiration process. (c) Calculated ai r for fermentation process. (d) As in (c), but for respiration
668
process.
669
670
671
In Figure 4, we represent the EEDA spatial and time profiles (time interval 100 ÷1000 μs) due to
672
heat transfer and mass exchange from inside the cell to the intercellular environment for the two
673
metabolic pathways. Figure 4(a) and (b) show ae Q for lactic acid fermentation and respiration,
674
respectively calculated using Equation (16). In both cases ae Q exhibits a deep negative minimum the
675
more the distance from the cell border that is of the same order of magnitude but more pronounced
676
for respiration process. The rate of increase of ae Q with increasing time is the same approaching zero
677
uniformly in space still at the initial instants of time. In Figure 4(c) (Figure 4(d)) ae exch computed
678
according to Equation (18) is displayed for lactic acid fermentation (respiration). Like for ae Q the order
679
of magnitude of the negative minimum is the same but, with increasing the distance from the cell
680
border, the trend of ae exch remains uniform for both processes. More specifically, the rate of increase
681
of ae exch is slightly higher for lactic acid fermentation even though, at t > 500 μs, ae exch becomes flat and
682
tends to vanish for both processes.
685
686
687
688
689
690
691
692
693
694
695
696
697
698
699
700
701
702
703
704
705
706
Figure 4. EEDA associated to heat and matter transfer from inside the cell to the intercellular environment for
707
lactic acid fermentation and respiration. A representative cell having the size of a normal cell is depicted. (a)
708
Calculated ae Qfor fermentation process. (b) As in (a), but for respiration process. (c) Calculated ae exch for
709
fermentation process. (d) As in (a), but for respiration process.
710
711
In Figure 3 and Figure 4, we have not shown the trend of the IEDA due to matter transfer for the
712
two main metabolic pathways during the initial time interval 0÷100 μs. Indeed, the main features of
713
the entropy accelerations in this time interval are very similar to those exhibited for the real glucose
714
catabolism process where there is a mixture of lactic acid fermentation and respiration.
715
716
Discussion
717
718
The classical thermodynamic description of glucose catabolism in normal and cancer cells and of
719
fermentation and respiration processes by using the concept of entropy density acceleration allows
720
us to add further important results on irreversible processes in living systems [34, 35]. In particular,
721
the analysis extended to the second order in time has strengthened the results obtained in relation to
722
Prigogine’s minimum dissipation principle formulated for living systems in terms of the rate of
723
entropy density. This has been accomplished transferring from mechanics to statistical
724
thermodynamics the concept of “motion” and of acceleration of entropy. We have found that the
725
“motion” characterizing the entropy density in minimum living systems represented by either
726
normal or cancer cells and associated to glucose catabolism and, more specifically, to lactic acid
727
fermentation and respiration processes can be described as a decelerated “motion” because of the
728
negative IEDA and EEDA. Note, however, the exceptions represented by the trends of ai Q, ai D and ae
729
exch for both kinds of cells and ai r for a cancer cell during the first instants of time (interval 0-100 μs)
730
where the entropy density accelerations are positive because of the peculiar time behaviour of the
731
terms contributing to these accelerations for small t.
732
From the inspection of the trend of the out-of-equilibrium IEDA and EEDA, the entropy density
733
acceleration has a remarkable magnitude because of the strong variation as a function of time of the
734
corresponding rates [35]. As a further confirmation of our previous findings where it was found that
735
the entropy gain per unit time was higher during lactic acid fermentation, the total entropy
736
acceleration during lactic acid fermentation has a more pronounced minimum if compared to the
737
corresponding one exhibited by the total acceleration during respiration. We attribute this behaviour