Modelling and measurement of soil gas flow
Full text
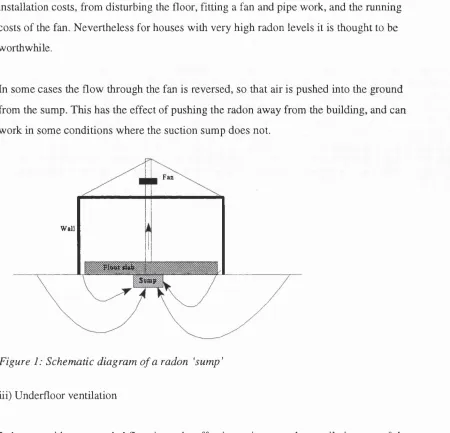
Figure


Outline
Related documents
Local government agencies, or non-profit organizations yes Support public access sites yes Provide computer, software and Internet training yes A Community
Electron micrographs of mannonamide aggregates from water (a-e) or xylene (f): (a and b) details of aged fiber aggregates of D-mannonamide 2 negatively stained
18 th Sunday in Ordinary Time Saint Rose of Lima Parish Parroquia Santa Rosa de Lima.. August
The algorithm will only match applicants employers preferred for NESP positions to NESP positions and applicants employers preferred for NETP positions to NETP positions. This way
In the previous sections, we dis- cuss the expectation that a neural network exploiting the fractional convolution should perform slightly worse than a pure binary (1-bit weights
Customer to pay any amount within ten (10) days after the amount is due and payable, b) abuse of the System or the equipment, c) dissolution, termination, discontinuance,
The chapter consists of a number of sections on the use of Learning Management Systems in higher education in Saudi Arabia and those variables and factors surrounding
