Available online: https://edupediapublications.org/journals/index.php/IJR/ P a g e |
2629
Optimization in Wire-Cut EDM of Nimonic-75 Using Taguchi’s Approach
Atinderjeet Singh*, Harvinder Singh Dhaliwala, Amandeep Singh Wadhwab
aAssistant professor,Department of Mechanical Engineering, Punjabi University, Patiala, India.
bAssistant professor in ME, University Institute of Engg. and Tech., Chandigarh, India
Abstract
Wire electrical discharge machining
removes electrically conductive material by means of spark discharges resulting from local explosion of a dielectric liquid. WEDM machining is used for hard material parts that are difficult to machine by conventional machining processes. This paper presents the investigation on
material removal rate and surface
roughness of Nimonic-75 using WEDM process. Taguchi’s design of experiments approach has been used for planning and designing of experiments. Experiments are performed by using L9 OA. The four input parameters considered were pulse on time, pulse off time, peak current, servo voltage for experimentation.
Keywords WEDM, Nimonic-75, OA
1.Introduction
Recent developments in mechanical
industry have fuelled the demand for materials having high toughness, hardness and impact resistance. These materials are
difficult to machine with traditional
methods. WEDM is an electro thermal
process in which metal is eroded from the workpiece using a series of sparks generated by a thin wire electrode in the presence of dielectric. WEDM can easily machine any conductive metal irrespective of their hardness. Wire-cut EDM process generates a large amount of heating at the machining area which results in melting
*Corrosponding author. Tel:+91-9876812127;
Email address: [email protected]
and vaporization of metal from localized area. The dielectric is fed continuously to the machining area to flush away the eroded particles. Wire EDM efficiency and productivity have been improved through progress in different aspects of WEDM such as quality, accuracy, precision and operation. V et al. [2010] conducted the experiment by optimizing the WEDM
parameters on machining of
INCOLOY800 with various performance characteristics such as MMR, surface roughness and kerf based on the Grey-Taguchi Method. The authors considered various process parameters like a 50V Gap Voltage, 10 µs Pulse ON-time, 6 µs Pulse Off-Time and 8mm/min Wire Feed rate.
Taguchi’s L9 Orthogonal Array was used
to conduct experiments. The experiments were carried out on a four -axes Electronica Ecocut CNC WEDM machine. The electrode material used was.25 mm diameter brass and a small gap of .025mm to .05mm was maintained in between the wire and workpiece. The results obtained from the experiments were analysed by using the ANOVA to find the significance of each input factor on the measures of
process performance, MMR, surface
Available online: https://edupediapublications.org/journals/index.php/IJR/ P a g e |
2630
of nimonic-90 with wire electrical
discharge machining process. The effects of different WEDM parameters were studied in this paper. The results showed that there was considerable effect of parameters like discharge current (Ip), pulse on time (Ton), pulse off time (Toff), servo voltage (SV) and wire feed rate (WF) on Cutting speed of Nimonic-90. Goswami et al. [2012] investigates the influence of machining parameters on cutting speed and material removal rate for machining of nimonic-80A with brass wire as tool electrode using CNC wire electrical discharge machining machine. The authors concluded that cutting speed and material removal rate increases with increase in pulse on time and peak current while
machining of the above mentioned
workpiece. Goswami et al. [2014] studied the material removal rate and surface roughness along with surface topography of the machined surface. The authors were used the taguchi’s approach and utility concept for wire electrical discharge machining of nimonic-80A alloy. In this paper it is assumed that the overall utility is the sum of utilities of individual quality characteristics. In this research, block of 25mm is used as a workpiece.L27 orthogonal array with six input variables was selected for experimentation. They found that by increasing the pulse-on time, discharge energy produced will be higher, hence increased in material removal was increased. They result came out to be from the experiment was that pulse on time was found to be the major factor effecting the MRR with 46.09% followed by pulse-off time with 32.97%, peak current 1.45%, spark gap voltage 6.68%, wire feed .84% and wire tension 44%. In this research, the best MMR was found to be .112g/min and surface roughness was .16 micron on pulse off time 54 micro seconds, pulse on time 106 micro seconds, input current:80A, spark gap set voltage :50v, wire feed:10
respectively. Sreenivasa Rao M, Venkaiah
et al. N Nimonic-263 material has been machined using WEDM of Electronica (India) make. The size of the workpiece material is 120mm×110mm×18.5 mm and 10 mm diameter holes were produced on it. Process parameters considered in the present work are pulse on time, pulse off time, peak current and servo voltage. After conducting trial experiments, levels of each process parameter has been fixed as pulse-on time (Ton): 105-125 μs, pulse-off time (Toff): 50-60 μs, peak current (Ip): 10-12 A and servo voltage (Sv): 40-60 V.
Material removal rate and surface
roughness have been considered as performance measures and aimed to optimize these responses with RSM. B.C. Khatri et.al. the study has been made to optimize the process parameters during machining of Inconnel-600 by wire electrical discharge machining (WEDM)
using response surface methodology
(RSM). Four input process parameters of WEDM (namely Peak Current (IP), Pulse on time (TON), Pulse off time (TOFF) and Wire Feed rate (WF)were chosen as variables to study the process performance in terms of Material Removal Rate (MRR). In the present work, the parametric
optimization method using Taguchi‘s
Available online: https://edupediapublications.org/journals/index.php/IJR/ P a g e |
2631
2. Methodology
2.1 Design of experiment based on taguchi’s method and Material
Experiments were performed on
Electronica Sprintcut CNC wire electrical discharge machine, (as shown in fig. 2) to study the material removal rate and surface roughness, affected by machining process variable at different setting of Pulse on-time (Ton), Pulse off-on-time (Toff), servo voltage (SV) and peak current (IP).
Fig.1.1 CNC WEDM Sprintcut model Brass wire electrode of diameter 0.25mm (900N/mm2 tensile strength) was used for
performing the experiments. The
experiments were conducted by L9 orthogonal array. Nimonic-75 is a nickel based alloy which is used as a workpiece material for the experiments. NIMONIC-75 is a nickel chromium alloy with good corrosion, oxidation and heat resistant,
precipitation hardenable and good
mechanical properties at elevated
temperature. Due to its properties it is used in aerospace industry. The chemical composition of NIMONIC-75 is shown
below. Signal to noise ratio was obtained
using Minitab 16 software. Higher is better (HB) for MRR and lower is better (LB) for WWR were taken for obtaining optimum
machining characteristics. Experiments
were conducted thrice to minimize the
chances of error. Material removal rate (MRR) was calculated by using the formula:
MRR=Cutting rate × Workpiece thickness × Wire diameter
And Cutting speed is calculated by taking mean of three trials. For each trial the value of cutting speed is shown on sprint cut machine display screen.
Surface Roughness is measured with the help of tester named Mitutoyo. The specimen is placed on the horizontal table and the Stylus of tester is placed on it which moves forward and backward and measures the roughness and displays on the screen of the instrument. Taking mean of all the three trials for surface roughness to get the results more accurate.
Table 2.1 Chemical Composition of NIMONIC-75
Material Percentage
Cr 18.9-21
Fe 5.0
Ti .2-.6
C .2
Si .08-.15
Mn 1.0
Cu .5
Ni Balance
Table 2.2 Physical properties
Density 8.37g/cm3
Melting point 1380 0C
Co-efficient of expansion 11 um/m0C
Specific heat j/kg. °C 461 J/Kg.0C
Thermal conductivity
W/m.0C 11.7 W/m.
0C
3. Schematic of machining
Available online: https://edupediapublications.org/journals/index.php/IJR/ P a g e |
2632
.025mm to .05 mm is maintained in between the wire and workpiece. The high density erodes the material from both the wire and workpiece by local melting and
vaporizing. The dielectric fluid is
continuously flashed through the gap along the wire, to the sparking area to remove the debris produced during the erosion. A collection tank is located at the bottom to collect the used wire erosions and then is discarded. The wire once used can’t be reused again, due to the variation in dimensional accuracy.
4. Parameters and design
Input process parameters such as pulse on time, pulse off time, peak current, servo voltage. Each factor is investigated at three levels to determine the optimum settings for the WEDM process. These parameters and their levels were chosen based on the
review of literature, experience,
significance and their relevance as per the few preliminary pilot investigations. The smallest 3-level OA L9 is chosen for this case.
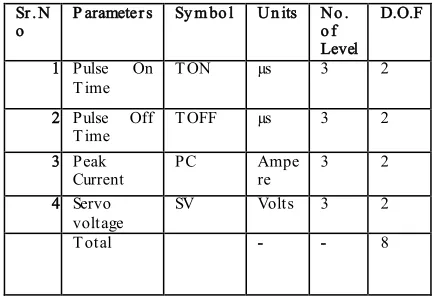
Table 4.1 Degree of Freedom of various parameters
Sr . N
o P arameter s Sy m bo l Un its No . o f Level
D.O.F
1. Pulse 1 On T ime
T ON µs 3 2
2. Pulse Off
T ime T OFF µs 3 2
3. Peak
Current PC Ampere 3 2
4. Servo
voltage SV Volts 3 2
T otal - - 8
The selected orthogonal arrays must have number of experiments greater than the total degrees of freedom of the input parameters. Once the minimum number of experiments are decided the further selection of orthogonal array is based on
the number of independent variables and
number of factor levels for each
independent variable. Now as the number degree of freedom for the selected four parameters is eight, the orthogonal array should have number of experiments greater than eight. For this case L9 orthogonal array having nine experiment trials is found most suitable.
Table No: 4.2 Input Variables with Level values
Table shows the nine experimental runs with the assigned levels of the process parameters according to the selected L9 OA.
5. Effect of different input parameter on Surface Roughness
Sr .
No I n p ut f act o r s L E VE L 1 L E VE L 2 L E VE L 3
1. Pulse on T ime
108 112 116
2. Pulse off
T ime 35 45 55
3. Peak Current
90 130 170
4. Servo
Available online: https://edupediapublications.org/journals/index.php/IJR/ P a g e |
2633
Fig 5.1
The effect of varying pulse on time on surface roughness is shown fig 5.1. It shows that the surface roughness increases with increase in value of pulse on time. It may be due to increase in pulse current produces stronger spark and higher temperatures. This causes more melting of the material and eroding the workpiece and consequent increase in surface roughness. The effect of varying pulse off time on surface roughness is shown in fig 5.1. It shows that with the increased value of
pulse off time, surface roughness
decreases. This may be because of higher the value of pulse off time, lesser is the number of discharges in a given time, resulting in non-uniform sparking and lesser number of particles dislodged near surface of work material. This causes more hills and valleys rather than uniform rounded surface. Similar results have been shown by Subramanyam et al. (2013) who conducted experiments for Evolution of optimal parameters for machining with
Wire-Cut EDM using Grey-Taguchi
method. The effect of varying peak current on surface roughness is shown in fig5.1. The value of surface roughness will increase with increase in value of peak current. The results are inline with
Subramanyam et al. (2013), who
conducted experiments for evolution of optimal parameters for machining with
Wire-Cut EDM using Grey-Taguchi
method and found that the surface roughness decreases with increase in value of peak current. The effect of varying servo voltage on surface roughness is shown in fig 5.1. It shows that with increase in value of servo voltage there is very much negligible change in the value of surface roughness. With increase in servo voltage surface roughness decreases.
5.1 Analysis of S/N Ratio For Surface Roughness
The results observed for the surface roughness are shown in table 5.2. In this table,value of surface roughness is given for each work and also calculate value of S/N ratio in last column for all the nine treatments. In this design situation, surface roughness is find out lower is better, which is a logarithmic function based on a mean square deviation and given by
(𝑆 𝑁)𝐿𝐵
= −10 log(𝑀𝑆𝐷𝐻𝐵)
𝑀𝑆𝐷𝐿𝐵 = −10𝑙𝑜𝑔 [1
𝑟∑(𝑦𝑖2)
𝑟
𝑗=1
]
Where,
𝑀𝑆𝐷𝐿𝐵
= Mean square deviation for lower − the − better response
r= Number of tests in a trial
𝑦𝑗= Observed value of the response
characteristics
∑𝑟𝐿=1𝑦𝑖2 = Summation of all response
values under each trail 116
112 108 -2
-4
-6
-8
55 45 35
170 130 90 -2
-4
-6
-8
45 35 25 Pulse on time
M
e
a
n
o
f
S
N
r
a
t
io
s
Pulse off time
Peak current Servo voltage
Main Effects Plot for SN ratios
Data Means
Available online: https://edupediapublications.org/journals/index.php/IJR/ P a g e |
2634
Table 5.1 Response table for signal to noise ratio “Smaller is Better”
Lev el To n To ff Ip Sv
1 -2.210 -5.380 -4.073 -5.156
2 -5.908 -5.481 -5.384 -5.087
3 -7.322 -4.579 -5.984 -5.197
Delta 5.112 .903 1.911 .110
Ran k 1 3 2 4
Table 5.3 Calculated S/N ratios for CR, MRR and Ra.
SR.
NO. T o n T o ff I p V C.R. M .R.R.
S/N
Ratio Ra
S/N Ratio
1 108 35 90 25 1.60 6 15.563 1.172 -1.378
2 108 45 130 35 1.22 4.57 13.198 1.368 -2.721
3 108 55 170 45 0.54 2.02 6.107 1.338 -2.529
4 112 35 130 45 2.33 8.73 18.820 2.096 -6.427
5 112 45 170 25 2.40 9.0 19.084 2.262 -7.089
6 112 55 90 35 .86 3.22 10.157 1.623 -4.206
7 116 35 170 35 3.12 11.70 21.363 2.610 -8.332
8 116 45 90 45 1.86 6.97 16.864 2.146 -6.632
9 116 55 130 25 1.56 5.85 15.343 2.239 7.001
Table 5.4 Pooled Analysis of Variance for Surface Roughness (Ra)
S.NO So u rce Su m o f
Sq u ares
D.O.F M ean
Sq u are
F-ratio P Percen tag e
Co n trib u tio n
1. PULSE ON
TIME
41.813 2 20.906 56.694 .001 85.263
2. PULSE OFF
TIME
1.467 2 _ _ 2.991
3. PEAK
CURRENT
5.722 2 2.861 7.758 .042 11.668
4. SERVO
VOLTAGE
.008 2 _ _ .016
5. POOLED
ERROR
Available online: https://edupediapublications.org/journals/index.php/IJR/ P a g e |
2635
TOTAL 50.485 12
DF- degree of freedom, SS-sum of squares, MS-mean squares, F-ratio of variance of a source to variance of error, P ≤ 0.05 - determines significance of a factor at 95% confidence level. 6 ANALYSIS OF S/N RATIO FOR
MATERIAL REMOVAL RATE:
Results observed for the material removal rate are shown in table 5.2. The table consists of material removal rate in g/min for all the treatments and also the values of S/N ratio for material removal rate for all treatments. The experimental results for material removal rate were analysed, using ANOVA calculations for S/N ratio. In case of material removal rate, higher is better option has been chosen for calculation of S/N ratio.
(𝑆 𝑁)𝐻𝐵
= −10log(𝑀𝑆𝐷𝐻𝐵)
𝑀𝑆𝐷𝐻𝐵= 1 𝑟∑ (
1 𝑦𝑗2) 𝑟
𝑗=1
Where,
∑ (1
𝑦𝑗2)
𝑟
𝑗=1 = Summation of all response
values under each trial.
𝑀𝑆𝐷𝐻𝐵 = Mean square deviation for
higher-the-better response.
R = Number of tests in a trial.
𝑦𝑖 = Observed value of the response
characteristics.
Table 6.1 Response table for signal to noise ratios “Larger is Better”
Level Ton Toff Ip Sv
1 11.62 18.58 14.19 16.66
2 16.02 16.38 15.79 14.91
3 17.86 10.54 15.52 13.93
Delta 6.23 8.05 1.59 2.73
Rank 2 1 4 3
Available online: https://edupediapublications.org/journals/index.php/IJR/ P a g e |
2636
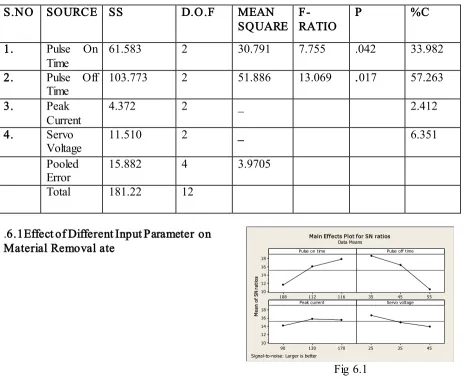
increases with the increase in peak current leading to a faster material removal rate. The results are inline with Shah et al.(2013) and Sarkar et al. (2005) who found that material removal rate increases in peak current. The effect of varying servo voltage on material removal rate is shown in fig. 6.1. It shows that the material removal rate decreases with increase in value of servo voltage. The
decrease in material removal rate is due to the arcing effect that decreases number of discharges which reduces material removal rate. Muthuraman et al. (2012) conducted an experiment to investigate the influences of process variables during WEDM of O1 steel and found that the material removal rate decreases with increase in value of servo voltage
Table 6.2POOLED ANALYSIS OF VARIANCE FOR MATERIAL REMOVAL RATE
S.NO SOURCE SS D.O.F MEAN
SQUARE F-RATIO
P %C
1. Pulse On
Time
61.583 2 30.791 7.755 .042 33.982
2. Pulse Off
Time 103.773 2 51.886 13.069 .017 57.263
3. Peak
Current
4.372 2 _ 2.412
4. Servo
Voltage 11.510 2 _ 6.351
Pooled Error
15.882 4 3.9705
Total 181.22 12
.6.1Effect of Different Input Parameter on Material Removal ate
Fig 6.1
116 112 108 18 16 14 12 10
55 45 35
170 130 90 18 16 14 12 10
45 35 25 Pulse on time
M
ea
n
of
S
N
ra
ti
os
Pulse off time
Peak current Servo voltage
Main Effects Plot for SN ratios Data Means
Available online: https://edupediapublications.org/journals/index.php/IJR/ P a g e |
2637
7.1 CONCLUSION
In this thesis study, the effect of four input parameters or control parameters or process parameters of wire electrical discharge machining such as pulse on time, pulse off time, peak current and servo voltage on the output parameters are
studied and also the experimental
investigation is done on WEDM. The optimal set of response or output parameters which gives maximum cutting speed and material removal rate and minimum surface roughness of WEDM process is obtained. L9 orthogonal array of Taguchi’s design of experiments was used in this study. The parameters that are kept
fixed during the entire work of
experimentations are wire feed, wire tension, flushing pressure and wire speed. The coated wire electrode is used in this set of experiments which zinc coated and having diameter of 0.25mm. The work piece on which the experiments were performed is titanium alloy grade five which is a hard alloy commonly known as hard to machine alloy. Analysis of variance was performed on raw data mean and S/N ratio data. The following
conclusions have been made after
performing set of experiments and made conclusions are:
Material Removal Rate, MMR
(mm³/min)
From the ANOVA tables of raw data and S/N ratio data it was concluded that the four factor such as pulse on time, pulse off time, peak current and servo voltage significantly affect the
mean and variance of material
removal rate and cutting speed. The optimum levels of such parameters for
maximum material removal rate and cutting speed are found as:
Table 7.1 Parameters for maximum material removal rate
Surface Roughness, Ra (µm)
From the ANOVA tables of raw data and S/N ratio data it was concluded that the four factors such as pulse on time, pulse off time, peak current and servo voltage significantly affect the
mean and variance of surface
roughness. The optimum levels for such parameters for minimum surface roughness are found as:
Table 7.2 Parameter setting for minimum surface roughness
1 Pulse on
time
µs 116
2 Pulse off
time µs 35
3 Peak
current
A 170
4 Servo
voltage
V 45
7.2 FUTURE SCOPE The following suggestions may useful for
the future study: In present study the experiments are made on the basis of four input
parameters such as pulse on time,
1 Pulse on
time µs 116
2 Pulse off
time µs 35
3 Peak
current A 130
4 Servo
voltage
Available online: https://edupediapublications.org/journals/index.php/IJR/ P a g e |
2638
pulse off time, peak current and servo voltage for the machining of NIMONIC-75 by WEDM. But it is possible to consider more input parameters like flushing pressure, wire speed and feed, wire tension and dielectric conductivity etc.
The effects of such input
parameters can be investigated on other output parameters like kerf width, surface integrity etc.
In future the methodology used in
this study can also be changed. Instead of using Taguchi’s design of experiments, other methods can also be used.
More experiments can may be
conducted by widening the limits of factors like pulse on time, pulse off time, peak current, servo voltage.
Different materials can also be
investigated taking different wire electrodes and the combination of different input parameters.
The effect of process parameter
such as conductivity of dielectric,
wire diameter, work piece
thickness etc. may also be investigated.
REFERENCES
1. Kumar, M., Babu, S.,
Venkatasamy and Raajenthiren (2010). “Optimization of the
WEDM Parameters on
Machining Incoloy800 Super
alloy with Multiple Quality
Characteristics”, International
Journal of Engineering Science and Technology, Vol. 2(6), 1538-1547.
2. Kumar, V., Jangra K. and
Kumar, V., (2012). “Effect of
WEDM Parameters on
Machinability of Nimonic-90”, Proceedings of the National Conference on Trends and
Advances in Mechanical
Engineering, 511-515.
3. Goswami, A. and Kumar, J.,
(2012). “An Investigation Into The Machining Characteristics Of Nimonic 80AUsing CNC
Wire EDM”, International
Journal of Advanced
Engineering Technology, Vol. 3, 170 - 174.
4. Goswami Amitesh and Kumar,
J., (2014). “Study of Machining Characteristics of Nimonic 80A
Using Wire-Cut EDM”,
International Journal of
Advanced Engineering
Applications, Vol.7, 73-81.
5. Goswami, A. and Kumar, J.,
(2014). “Optimization in Wire – Cut EDM of Nimoni-80A using Taguchi’s Approach and Utility
Concept”, Engineering Science
and Technology,an international journal, 1-11.
6. Rao Sreenivasa, M., Venkaiah,
N. (2015), “Parameteric
Optimization Machining of
Nimonic-263 Alloy using RSM
and Particle Swarm
Optimization”,2nd International
Conference on Nanomaterial’s and Technologies, Vol.10, 70-79.
7. Shah, C.D., Mevada, J.R., and
Khatri, B.C., (2013).
“Optimization of Process
Parameters of WEDM by RSM
on Inconel-600”,International
Journal of Emerging Technology and Advanced Engineering, Vol. 3,Issue 4, 260-67.
8. Mevada J.R., (2013). “A
Comparative Experimental
Investigation on Process
Available online: https://edupediapublications.org/journals/index.php/IJR/ P a g e |
2639
Wire Cut EDM”, International
journal of Scientific &
Engineering Research, Vol.4,
Issue 4,1398-1407.
9. Hewidy, M.S., EI-Taweel, T.A.,
and EI-Safty, M.F., (2005).
“Modelling the machining
parameters of wire electrical discharge machining of Inconel
601 using RSM”, Journal of
Materials Processing
Technology,Vol.162(2),
328-336.
10.Kumar, A., Dr. Kumar, V. and
Dr. Kumar, J., (2011). “A Review on the State of Art in
WEDM Process”, International
journal of Mechanical
Engineering Research and
Development, Vol. 1, 23-29.
11.Ganapathy, S. and
Balasubramanium, S. (2015).
“Study on the Material Removal
Mechanism in WEDM”,
International journal of Scientific & Engineering Research, Vol. 3, 20-27.
12.Ramakrishnan R. and
Karunamoorthy L. (2008).
“Modelling and Multi-response Optimization of Inconel 718 on Machining of CNC WEDM Process”, Journal of Materials
Processing Technology,
Vol.207(1), 343-49.
13.Goswami, A. and Kumar, J.,
(2014). “Investigation of surface integrity, material removal rate and wire wear ratio for WEDM of Nimonic 80A alloy using GRA and Taguchi method”,
Engineering Science and
Technology, an International
Journal,Vol. 30, 1-12.
14.Antar, M.T., Soo, S.L.,
Aspinwall, D.K., Jones, D. and Perez R., (2011). “productivity and Workpiece Surface Integrity When WEDM Aerospace Alloy
using Coated Wires”, Procedia
Engineering 19, 3-8
15.Singh, S. and Pandey, A., (2012).
“ Some studies into electrical
16.discharge machining of
Nimonic-75 super alloy using rotary copper disk electrode”, Journal of Material Engineering and Performance, 1-12.
17.Li, L., Guo, Y.B., Wei, X.T., Li,
W., (2013). “Surface Integrity Characteristics in Wire EDM of
Inconel 718 at Different
Discharge Energy”, Procedia
CIRP, Vol. 6 220-25
18.Bobbili, R., Madhu, V. and
Gogia, A.K., (2013). “Effect of WEDM Parameters on Surface Roughness and MRR of High Strength Armor Steel”, Materials and Manufacturing Processes, Vol.28, Issue 4,364-68.
19.Antar, T.M., Soo, S.L.,
Aspinwall, D.K., Cuttell, M., Perez, R.and Winn A.J., (2011).
“WEDM of Aerospace Alloys Using ‘Clean Cut’ Generator
Technology”, Proceedings of the
16th International Symposium on
Electromachining, 285-290.
20.Patel, J.J, (2014). Optimization
of Wire Cut EDM Process Parameters By Grey Relational
Analysis. Thesis (M.Tech),
Ganpat University.
21.Benedict, G.F., (1987).
“Electrical discharge machining
(EDM), non-traditional
manufacturing process”, Marcel Dekker, Inc, New York & Basel, 231-232.
22.C. Sommer and S. Sommer, “The
Wire EDM handbook”,
www.reliableedm.com.
23.B.L. Juneja, G.S. Sekhon and
Available online: https://edupediapublications.org/journals/index.php/IJR/ P a g e |
2640
Cutting and Machine Tool
handbook”.
24.Farnaz Nourbakash 2012.
“Machining Stability of WEDM
of Titanium alloy Ti6Al4V”,
Industrial and management