Mitigation of Power Quality Disturbances
Using UPQC Based On HDE Optimization
Technique
G. Harish Kumar Varma
1, L. Ravi Srinivas
2, B.Mahesh babu
3, S.S.Tulasiram
4PG Student [PEED] Dept. of EEE, Gudlavalleru Engineering College, Gudlavalleru, Andhrapradesh, India 1
Professor, Dept. of EEE, Gudlavalleru Engineering College, Gudlavalleru, Andhrapradesh, India2
Assistant Professor, Dept. of EEE, Gudlavalleru Engineering College, Gudlavalleru, Andhrapradesh, India3
Professor, Dept. of EEE, JNTU Hyderabad, Hyderabad, Andhrapradesh, India4
ABSTRACT: This paper presents a new synchronous reference frame theory based control strategy to mitigate power
quality disturbances through UPQC to enhance the power quality at distribution level. UPQC is an integration of STATCOM and DVR connected in back-to-back configuration with the help of DC-link capacitor. The proposed UPQC can compensate voltage sag and mitigate current harmonics. The simulations were performed on 33kv line with
non-linear load and results were plotted .To obtain the optimal values of KP, KI, the PI controller in SRF theory is
optimized with HDE technique. The simulations were performed in MATLAB 7.10.0.499(R2010a)/SIMULINK software.
KEYWORDS: Static Synchronous Compensator (STATCOM), Dynamic Voltage Restorer (DVR), Unified Power
Quality Conditioner (UPQC), Synchronous Reference Frame (SRF) Theory, Total Harmonic Distortion (THD), Hybrid Differential Evolution (HDE).
I. INTRODUCTION
It has been always challenge for an electrical engineer to maintain good power quality within the desired tolerance. Poor power quality has several adverse effects. One of the main causes for the degradation of power quality is harmonic currents and voltage sags. Harmonic currents are mainly caused due to the operation of non-linear loads. These harmonic currents at load side are injected back into source side as a result source current becomes distorted. These harmonic currents are mitigated with the help of STATCOM by injecting reverse harmonics into the line. Voltage sags are mainly caused due to energization of heavy loads. These are compensated with the help of DVR [1]-[3]. UPQC is an integration of STATCOM and DVR connected in back-to-back configuration with the help of a DC- link capacitor. The proposed UPQC can mitigate current harmonics as well as compensate voltage sag simultaneously [4].
SRF theory is used to generate reference currents and compensating voltages. This theory was based on Parks transformation. The three phase ac components (a,b,c) from a stationary frame are transformed into (d,q,o)synchronously rotating frame[5]–[6] which are DC quantities. It is easier to analyze DC quantities rather than AC quantities. The phased locked loop (PLL) is used to generate sin (wt), cos (wt) which are needed for synchronizing purpose . To reduce the steady state error PI controller is used. Further simulations were performed based on
knowledge from SRF theory.HDE technique is utilized as a tool for evaluating the optimal values of KP and KI to
II.UPQC
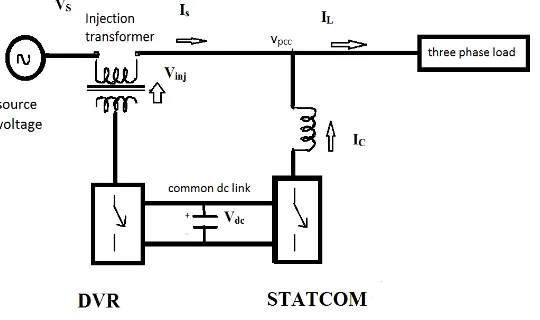
It is a most versatile power quality conditioner that can mitigate power quality disturbances like voltage sag, voltage swell, and current harmonics. UPQC have two voltage source inverters connected in back to back configuration sharing a common dc link capacitance [1]–[5]. One inverter is connected in parallel with the load. It acts as STATCOM that injects reverse harmonics into the line and mitigates the harmonics in the source current and makes the source current harmonic free. The other inverter is connected in series with the line through series transformer. Whenever the supply voltage undergoes sag then DVR injects suitable voltage with supply and makes load voltage balanced.
The main objectives of UPQC in this paper are
A. It eliminates the harmonics in the supply current.
B. It maintains load end voltage at the rated value even at the time of voltage sag
C. To regulate the DC bus voltage.
Fig. 1. Block diagram of UPQC.
III. SRF THEORY
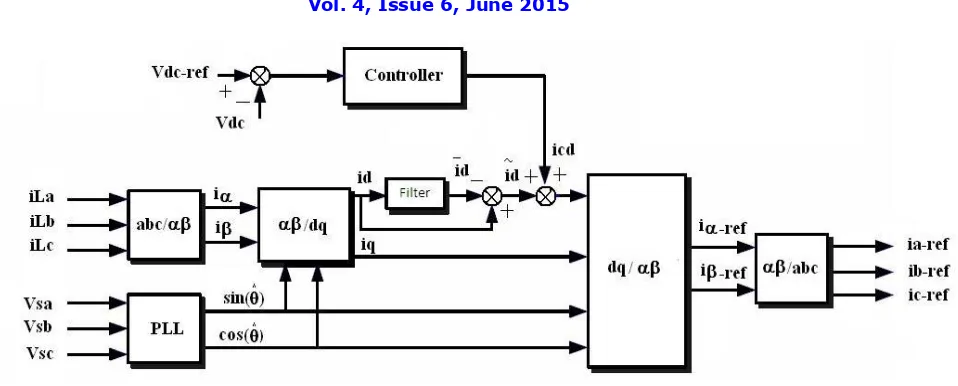
A. STATCOM
This theory is used to generate reference currents. It is based on Park transformation. The load currents from a stationary reference frame (a-b-c) are transformed into synchronously rotating frame (d-q-o) as a result they are converted into DC quantities .It is easier to analyse in DC quantities rather than AC quantities. The phased locked
loop (PLL) is used to synchronize the reference frame with supply voltage. The id and iq components comprises
both AC and DC components. The DC component corresponds to fundamental load currents and ac component corresponds to load current harmonics. The isolation of ac components can be achieved by filtering out the DC-offset. PI controller is used to control the DC link voltage. The (d-q-o) frame is again converted into (a-b-c) frame
to get required reference currents (Ia*, Ib*, Ic*). These are given to hysteresis band current controller to generate the
gating pulses for inverter.
Ids = 2/3 (ia cosθ+ib cos(θ-1200)+ic cos(θ+1200)
(1)Iqs= 2/3(ia sinθ+ib sin(θ-1200)+ic sin(θ+1200)
(2)Ia* = Ids cosθ + Iqs sinθ
(3)Ib *
= Ids cos(θ-120 0
)+Iqssin(θ-120
0
)
(4)Ic *
= Ids cos(θ+120
0
)+Iqs sin(θ+120
0
Fig. 2. Control block diagram of STATCOM
B.DVR
This theory is used to generate reference voltages. The three phase set of voltages are transformed into direct and quadrature components as a result it is possible to control active and reactive power independently. In order to inject the active power into the line the DC quantities are compared with 1 and 0. The active power is injected only when current and voltage are in same phase. The error is given to PI controller and again (d-q-o) frame is converted into (a-b-c) frame to get required voltages. These compensated voltages are given to SPWM to generate the required gating pulses for the inverter.
Vqs Cosθ Cos(θ-2π/3) Cos(θ+2π/3) Vas
Vds = 2/3 Sinθ Sin(θ-2π/3) Sin(θ+2π/3) Vbs
(6)Vos ½ ½ ½ Vcs
(Vqdo) = KVabc
(7)(Vabc)=K-1(Fqdo)T
(8)Cos θ Sin θ 1
K-1 = Cos( θ-2π/3) Sin( θ-2π/3 ) 1
(9) Cos (θ+2π/3) Sin(θ+2π/3) 1
Fig. 3. Control block diagram of DVR
IV.GATING TECHNIQUES
A. HBCC
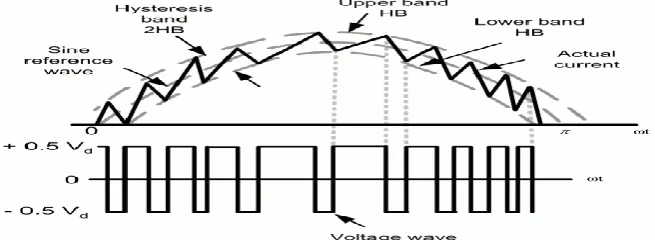
The gating signals to voltage source inverter (VSI) are given with the help of hysteresis band current controller
(HBCC) because of its simplicity and fast response. In this the controlled current is forced to track the reference current within the hysteresis band. The inverter switches should change their states instantaneously when the controlled current touches the upper and lower bands. HBCC generates a sinusoidal reference current of desired magnitude and frequency that is compared with the actual line current
If (iact) > (iref + HB) upper switch of a leg is ON and lower switch is OFF.
If (iact) < (iref - HB) upper switch of a leg is OFF and lower switch is ON.
If the current exceeds the upper limit of hysteresis band then upper switch is turned off and lower switch is turned on similarly when it exceeds the lower limit of hysteresis band then lower switch is turned off and upper switch is turned on. As a result current raises and decays .Thus actual current is forced to track the reference current within the hysteresis band.
Fig. 4. Hysteresis Band Current Controller
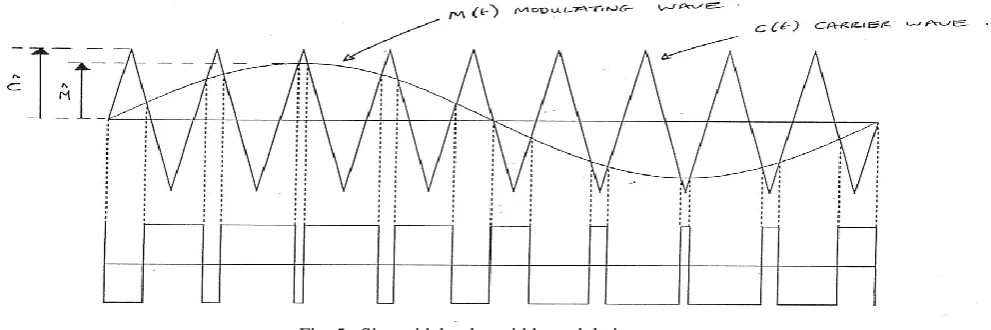
B. SPWM
The amplitude, phase and frequency of the reference signal are set to control the output voltage. The modulating signal is the compensating voltage. The triangular carrier signal is compared with the sinusoidal modulating signal. When the modulating signal is greater than carrier pulse then upper switch of VSI is on and lower switch is off .The range of switching frequency is (5 kHz-20 kHz).
Fig. 5. Sinusoidal pulse width modulation
V. DESIGN SPECIFICATIONS
Design parameters of UPQC: DC bus voltage, DC bus capacitance, voltage rating of series active power filter, KVA
rating of transformer and filter design.
A. DC capacitor voltage: The DC capacitor voltage is calculated based on following relation
Vdc=(2 2*VLL)/ (3 ∗ 𝑚))
(10)Where m is modulation index (m=1)
B .DC bus capacitance of the VSC: The DC bus capacitance is calculated based on the energy required during the Change in load, it is calculated as
E=1/2*Cdc(Vdc12-Vdc2)
(11)Where Vdc is DC bus voltage and Vdc1 is the minimum voltage level of DC bus
Vdc1=(2*Vs)
(12)P*∆t=1/2*Cdc(Vdc12-Vdc2) Where P=3*Vs*Is
(13)C.Voltage rating of series active power filter: The voltage rating of VSC depends on maximum voltage to be injected
if there are any voltage variations in the load. .The injected voltage is calculated as a
Vinj = (𝑉𝑠2− 𝑉𝐿2) =VDVR
(14)D. KVA rating of transformer: The KVA rating of transformer is calculated as
S= (3Vs*Is)/1000
(15)E. Ripple Filter: In order to eliminate the switching frequency ripples from injected voltage the ripple filter is designed.
Ripple filter consists a series connected Rr and Cr.
Fr = 1/(2π*Rr*Cr)
(16)VI. HDE
The one-to-one competition of DE provides a faster convergence speed; this faster convergence yields a premature convergence. This drawback could be overcome by employing a larger population. However, by doing so, much more computation time is required to estimate the fitness function. In order to avoid employing a large population, Hybrid Differential Evolution (HDE) algorithms were developed. Warren Liao (2010) proposed hybrid differential algorithm. The fitness function is defined as
F = F (THD of source current) +F (THD of load voltage) +F (sag)
(17)The optimization parameters are Kp and Ki values of PI controller. Where Kp and Ki are referred as proportional and
integral gains respectively. The transfer function of PI controller is represented as follows.
KC(S) =KP+
KI
s
(18)The following is the procedure
A. Initialization : First initialize the population size, decision variables, fitness function
Xi0 = Xmin+ρi(Xmax-Xmin), i=1,...Np
(19)where ρi Є [0, 1] is a random number. The intial process produces NP individuals of Xi0 randomly
B. Mutation: The main aim of mutation process is to generate mutant vector. A mutant vector is generated based
on the present individual XiG as fallows
YiG+1 = XiG+F((Xr1G-Xr2G) + (Xr3G-Xr4G)
(20)where i =1,2,3……NP; r1,r2,r3and r4 randomly selected and are distinct; F Є [0,2] where F is the mutation rate and it is
determined empirically.
C. Cross Over: The parent vector is mixed with the mutant vector to generate trial vector(offspring). The process
of mixing parent vector with mutant vector is known as cross over.
XhiG, if a random number > Cr
YiG+1 =
Yhi G+1
, otherwise
(21)
where i =1,2,3……NP; h= 1,2……nc; where nC is the dimension of decision parameters; YiG+1, XiG are mutant and
parent vectors; K is the number of genes Cr Є [0,1] where Cr is the cross over constant that controls diversity of
population.
D. Estimation and Selection: The parent is replaced by its offspring if the fitness of the offspring is better than
that of the parent else the parent is retained for the next generation.
XhiG+1=arg min{F(XiG),F(YiG+1)}
(22)Xb G+1
=arg min{F(Xi
G+1
where arg min means the argument of the minimum , and XbG+1 is the best individual.
E. Migration:To regenerate a new diverse population, to effectively enhance the investigation and reduce the
pressure to a small population we go for migration operation. The new populations are produced based on the
best individuals XbG+1. The hth gene of the ith individual as fallows.
XhbG+1+Pi(Xkmin – XhbG+1) ,if P2< XhiG+1 - Xhmin
(24)
XhiG+1
= Xhmin – Xhb G+1
XhbG+1 +Pi(Xkmax – XhbG+1),otherwise
where ρ , ρ2 are randomly generated numbers uniformly distributed in the range of [0,1]; i =1,2,3……NP; h=
1,2……nc; The migration in DE is executed only if a measure fails to match the desired steadiness of population
diversity. The measure is defined as fallows.
P= 𝑁 X
𝑗 =1 𝑁
𝑖=1 𝑖=𝑏
j/ nc(NP - 1)< ɛi i
(25)
1, if XjiG+1 – XjbG+1
Xji = 0,otherwise
]
1 , 0 [
1
2[0,1] Respectively express the desired steadiness for the population diversity and the gene diversity with
respect to the best individual.
F. Repeat from B to E until desired THD is reached
VII. SIMULATION RESULTS
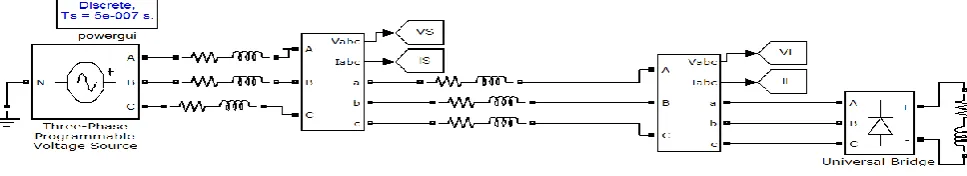
This the basic Simulink diagram showing how the power quality disturbances are created. Voltage sag is created with the help of programmable source by decreasing the input of step during the interval (0.05-0.1). Similarly current harmonics are created with the help of non-linear load.
Fig. 6. Simulink diagram of basic distribution line
. Fig. 7. Source current and load voltage waveform before UPQC
UPQC is a most versatile device that can mitigate current harmonics and voltage sags. It comprises of DVR and STATCOM integrated with the help of a DC-link capacitor. The STATCOM is connected in shunt with the line and DVR is connected in series with the line with the help of series transformer.
Fig. 8.Simulink diagram of UPQC
UPQC is applied to the basic distribution line the reference currents and voltages are generated using SRF theory. The gating pulses to the inverter are generated with the help of Hysteresis Band Current Controller.
0 0.02 0.04 0.06 0.08 0.1 0.12 0.14 0.16 0.18 0.2
-4 -2 0 2 4x 10
4
Time(seconds)
v
o
lt
a
g
e
(v
o
lt
s
)
0 0.02 0.04 0.06 0.08 0.1 0.12 0.14 0.16 0.18 0.2
-2000 -1000 0 1000 2000
Time(seconds)
C
u
rr
e
n
t(
a
m
p
e
re
s
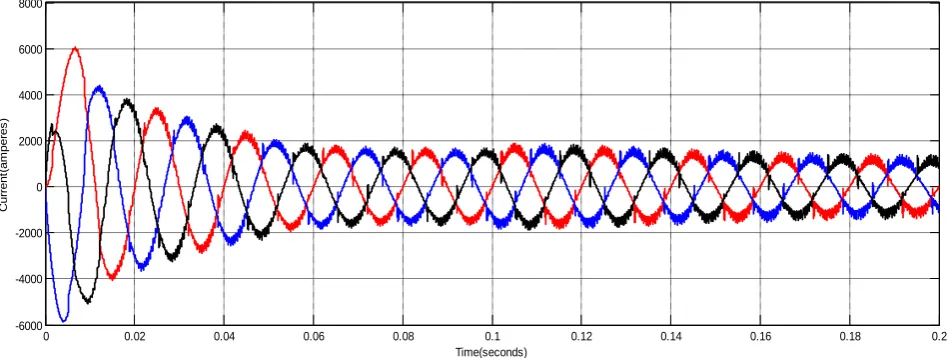
Fig. 9. Injected currents using UPQC
The UPQC injects opposite harmonics into the line and cancel out the harmonic currents present in the source current and helps it to maintain the source current harmonic free. These reverse harmonics are generated with the help of SRF control strategy using HBCC.
Fig. 10.Source current after the application of UPQC
0 0.02 0.04 0.06 0.08 0.1 0.12 0.14 0.16 0.18 0.2
-10000 -5000 0 5000 Time(seconds) C u rr e n t( a m p e re s )
0 0.02 0.04 0.06 0.08 0.1 0.12 0.14 0.16 0.18 0.2
-5000 0 5000 10000 Time(seconds) C u rr e n t( a m p e re s )
0 0.02 0.04 0.06 0.08 0.1 0.12 0.14 0.16 0.18 0.2
-5000 0 5000 Time(seconds) C u rr e n t( a m p e re s )
0 0.02 0.04 0.06 0.08 0.1 0.12 0.14 0.16 0.18 0.2
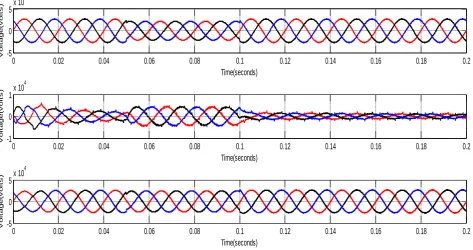
Fig. 11.Source injected and load voltages using UPQC
The UPQC compensates the voltage sag by injecting the voltage during sag interval of time. The compensated voltages are generated using SRF theory based on SPWM technique. Thus the UPQC mitigates current harmonics and compensate voltage sags.
Fig. 12. Source current and load voltage after application of UPQC
0 0.02 0.04 0.06 0.08 0.1 0.12 0.14 0.16 0.18 0.2
-5 0 5x 10
4 Time(seconds) V o lt a g e ( v o lt s )
0 0.02 0.04 0.06 0.08 0.1 0.12 0.14 0.16 0.18 0.2
-1 0 1x 10
4 Time(seconds) V o lt a g e ( v o lt s )
0 0.02 0.04 0.06 0.08 0.1 0.12 0.14 0.16 0.18 0.2
-5 0 5x 10
4 Time(seconds) V o lt a g e ( v o lt s )
0 0.02 0.04 0.06 0.08 0.1 0.12 0.14 0.16 0.18 0.2
-1 -0.5 0 0.5
1x 10
4 Time(seconds) C u rr e n t( a m p e re s )
0 0.02 0.04 0.06 0.08 0.1 0.12 0.14 0.16 0.18 0.2
-4 -2 0 2 4x 10
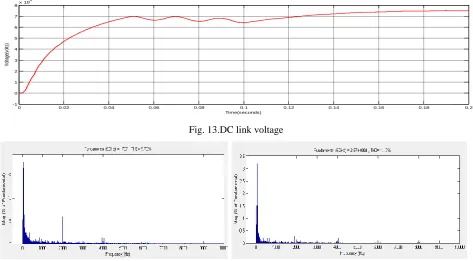
Fig. 13.DC link voltage
Fig. 15 T.H.D of source current and load voltage using PI controller from FFT analysis
It is difficult to change the PI parameters regularly and verify the T.H.D. In order to find the optimal values of Kp and
KI , the PI controller is optimized with HDE technique.
By taking objective function as F = F (THD of source current) ; For 20 iterations for CR =0.6;F=0.9 The T.H.D has
been reduced to 0.0564%
Fig. 15 T.H.D of source current and load voltage using PI-HDE from convergence graph
By taking objective function as F = F (THD of load voltage) ; For 20 iterations for CR =0.9;F=0.4 The
T.H.D has been reduced to 0.00890%
0 0.02 0.04 0.06 0.08 0.1 0.12 0.14 0.16 0.18 0.2
-1 0 1 2 3 4 5 6 7 8x 10
4
Time(seconds)
V
ol
ta
ge
(v
ol
ts
)
0 2 4 6 8 10 12 14 16 18 20
0.056 0.0565 0.057 0.0575 0.058 0.0585 0.059 0.0595 0.06
Number of iterations
%
T.
H
.D
CR=0.6;F=0.9
0 2 4 6 8 10 12 14 16 18 20 0.008
0.01 0.012 0.014 0.016 0.018 0.02 0.022 0.024 0.026 0.028
Number of Iterations
%
T.
H
.
D
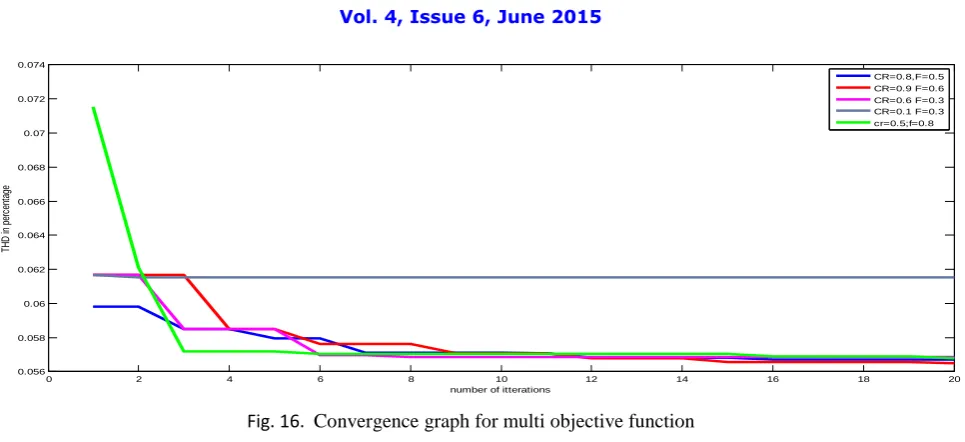
Fig. 16. Convergence graph for multi objective function
The multi objective function is F = F(THD of source current)+F(THD of load voltage)+F(sag)
Source Current %T.H.D
PI Controller 9.70
PI-HDE(CR =0.6;F=0.9) 0.0564
Load Voltage %T.H.D
PI controller 1.28
PI-HDE(CR =0.9;F=0.4) 0.0089
VIII. CONCLUSION
The Power Quality disturbances such as current harmonics and voltage sag are mitigated and compensated with the help of UPQC. Comparative analysis has been made on UPQC with conventional PI controller and PI controller optimized with HDE (PI-HDE) by taking different objective functions. It has been found that PI controller optimized with HDE gives better results than conventional PI controller when THD of source current and THD of load voltage are taken independently as objective function. By taking multi objective function as THD of source current, THD of load voltage and sag the overall THD reduces to a small value.
. REFERENCES
[1] Shyama P. Das, “Unified Power Quality Conditioner for Power Distribution Systems” Department of EEE IIT Kanpur.
[2] Vinod Khadkikar, “Enhancing Electrical Power Quality Using UPQC:A Comprehensive overview,”IEEE Transactions on Power Electronics ,
VOL.27,NO.5,MAY2012”.
[3] RVD Rama Rao and Subhransu Sekhar Dash, “Power Quality Enhancement by Unified Power Quality Conditioner using ANN with Hystersis
Control,”International Journal of Computer Applications,VOL. 6-NO. 1, SEPTEMBER 2010”.
[4] Sudharshan Rao Gandimeni and Vijay Kumar k, “Unified Power Quality Conditioner During Voltage Sag and Swell,” VSRD-IJEECE, VOL.
2 (8),2012,545-565.
[5] Dharmalingam R,Dash SS, Senthilnathan K,Mayilvaganan AB, Chinnamuthu S, “Power Quality improvement by by Unified Power Quality
Conditioner Based On CSC topology using Synchronous Reference Frame Theory,” Scientific World Journal. 2014; 2014:391975. Doi:10.1155/2014/391975. Epub 2014 Jun 11”.
[6] Metin Kesler and Engin Ozdemir, “Synchronous Reference Frame Based Control Method for UPQC Under Unbalanced and Distorted Load
Conditions,” IEEE Transactions on Industrial Electronics, VOL.58, NO.9, SEPTEMBER 2011”.
[7] Ravikanth Mopidevi, L.Ravi Srinivas, B.Mahesh Babu and S.S Tulasiram, “AI Based STATCOM for Power Quality Enhancement,” ijareeie,
VOL. 3,Issue 8, AUGUST 2014
[8] Ying-Pin Chang and Chi-Jui Wu, “Optimal Multi objective Planning of Large-scale Passive Harmonic Filters Using Hybrid Differential
Evolution Method Considering parameter and Loading Uncertainty,”IEEE Transaction on Power Delivery, VOL. 20, NO. 1, JANUARY 2005”.
[9] Aniruddha Bhattacharya and Pranab Kumar Chattopadhyay, “Hybrid Differential Evolution with Biogeography-Based Optimization for
solution of Economic Load Dispatch,” IEEE Transactions on Power Systems, VOL. 25, NO. 4, NOVEMBER 2010”.
0 2 4 6 8 10 12 14 16 18 20
0.056 0.058 0.06 0.062 0.064 0.066 0.068 0.07 0.072 0.074
number of itterations
TH
D
in
p
er
ce
nt
ag
e