Performance Evaluation and Analysis of
Direction of Arrival Estimation Using MUSIC,
TLS ESPRIT and Pro ESPRIT Algorithms
N. A. Dheringe
1, Prof. B. N. Bansode
2PG Student [Digital Systems], Dept. of Electronics Engg, AVCOE, Sangamner, Maharashtra, India1 Assistant Professor, Dept. of Electronics Engg, AVCOE, Sangamner, Maharashtra, India2
ABSTRACT: Source Direction of arrival (DOA) estimation plays an important role in array signal processing, and has a wide range of application. Array signal processing is an important branch in the field of signal processing. In recent years, it has developed dramatically. It can be applied in fields such as radar, communication, sonar, earthquake, exploration, astronomy and biomedicine. Over the past few years, all kinds of algorithms which can be used in DOA estimation have made great achievements, the most classic algorithms among which are Multiple Signal Classification (MUSIC) and Estimation of Signal Parameters via Rotational Invariance Technique (ESPRIT).In this paper, we will give an overview on performance of the DOA estimation based on MUSIC as well as ESPRIT (both TLS and Pro ESPRIT) algorithm on uniform linear array (ULA) and in the presence of white noise. We will describe what DOA estimation is, and give a mathematical model of DOA estimation for subspace based DOA methods such as MUSIC, TLS ESPRIT and Pro ESPRIT. Then estimate DOA based on the MUSIC, TLS ESPRIT as well as Pro ESPRIT algorithm, with simulations with MATLAB to simulate factors that affect accuracy and resolution of DOA estimation. The performance of these DOA algorithms for a set of input parameters such as number of snapshots, number of array elements, signal-to-noise ratio, angular separation, element spacing are investigated.
KEYWORDS: DOA Estimation, Subspace Based DOA algorithms, MUSIC, TLS ESPRIT, Pro ESPRIT.
I. INTRODUCTION
Direction-of-arrival (DOA) estimation of the incoming signals is a basic and important technique in array processing. It is applied not only for wireless communication but also for audio/speech processing systems. A lot of applications such as hearing aids and speech recognition require the knowledge of the source localization. Therefore, a correct DOA detection becomes very important. Over the past few years, all kinds of algorithms which can be used in DOA estimation have made great achievements[1][2].
This paper introduces the field of Direction Of Arrival with the well known Algorithms such as MUSIC, TLS ESPRIT and Pro ESPRIT. In the following section, the reader is introduced to direction of arrival. Third section describes in detail the three types of DOA estimation algorithms with description. In fourth section, the simulation results for MUSIC, TLS ESPRIT and Pro ESPRIT are analyzed with different parameters. Lastly, a conclusion is made.
II. LITERATURE REVIEW
DOA estimation is a key research area in array signal processing and many engineering applications that need to be supported by direction of arrival estimation. In modern society, DOA estimation is normally researched as a part in the field of array processing, so many works highlight radio direction finding. Signal processing in smart antenna systems concentrates on the development of efficient algorithms for Direction of Arrival (DOA) estimation [3]. Signal processing in smart antenna systems concentrates on the development of efficient algorithms for DOA estimation.
Background And Significance:
most popular and widely used subspace-based techniques to estimate the DOA of multiple signal sources is the MUSIC algorithm. Large numbers of computations are needed to search for the spectral angle when using the MUSIC algorithm, so in real applications its implementation can be difficult. It can only be used in uniform linear array (ULA) or non-uniform linear array whose arrays are restricted to a uniform grid[5]. ESPRIT arithmetic and its improved arithmetic such as TLS-ESPRT, Pro ESPRIT have a high resolution. The most important thing is that this kind of arithmetic avoids large computation in search of the spectrum, so it can accelerate the speed of Direction of arrival estimation. And hence further we will move towards ESPRIT algorithm to overcome the disadvantages of MUSIC algorithm.
Overview Of The Development Of Direction Of Arrival (DOA):
Initially, the Direction of Arrival Estimation estimated the linear spectrum based on the method of Fourier transform. Afterwards, based on the statistical analysis of maximum likelihood[1] spectrum estimation, which has a high-resolution performance and robust character, people began to pay attention to this method. In 1967, Burg[1] proposed the maximum entropy estimation method, which opened a modern research area on spectrum. This method includes maximum entropy, AR, MA, ARMA parameter method. All those methods have a high resolution. Nevertheless, they all need a large amount of calculation and a low robustness. When it came to the 1980s, the academic community put forward a series of spectrum estimations based on decomposition of eigenvalues. All those estimations were represented by MUSIC and ESPRIT.
Various DOA Estimation Algorithms :
DOA methods has been widely studied in the literature and can be grouped into two categories.
In the first category, they are called as classical[5] methods which first compute a spatial spectrum and then estimate DOAs by local maxima of the spectrum. However, these conventional methods do not get a good resolution. The Barltett and Capon are quadratic type algorithms[5]. The both methods are highly dependent on physical size of array aperture, which results in poor resolution and accuracy[6].
The second category is known as subspace method [5]. Subspace based DOA estimation method is based on the eigen decomposition. The subspace based DOA estimation algorithms MUSIC and ESPRIT provide high resolution; they are more accurate and not limited to physical size of array aperture[6].
Basic Principle of DOA Estimation:
DOA is for the direction of array antenna of the radio wave. If the radio wave received meets the condition of far field / narrowband, it can take the front of the radio wave as a plane. The angle between the array normal and the direction vector of the plane wave is the Direction of arrival (DOA). The estimated target of DOA gives N snapshots data: X(1)…X(N), using an algorithm to estimate the value of multiple signals DOA (θ). For generally far and wide signals, a wave-way difference exists when the same signal reaches different array elements. This wave-way difference leads to a phase difference between the arrival array elements. Using the phase difference between the array elements of the signal one can estimate the signal azimuth, which is the basic principle of DOA estimation.
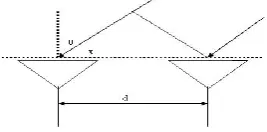
Figure 1: The principle of DOA estimation
For instance, Fig. 1 considers two array elements, d is the distance between the array elements, c is the speed of light, θ is the incident angle of the far field signal, τ is the time delay of the array element. The signal received by the antenna
due to the path difference is τ = d sin θ
c thus one can obtain the phase difference between the array elements as
υ = e−jωτ = e−jωd sin θ
c = e−j2π d sin θ
λ f0 fwhere fo is the centre frequency. For narrow band signals, the phase difference is
direction of the signal can be gained according to Formula, which is the basic principle of spatial spectrum estimation techniques [4].
III. MUSIC AND ESPRIT ALGORITHMS MUSIC Algorithm:
MUSIC algorithm was proposed by Schmidt and his colleagues in 1979. The basic idea of MUSIC algorithm is to conduct characteristic decomposition for the covariance matrix of any array output data, resulting in a signal subspace orthogonal with a noise subspace corresponding to the signal components. Then these two orthogonal subspaces are used to constitute a spectrum function, be got though by spectral peak search and detect DOA signals.
Consider that the signal sources are narrow bands, and each source has the same centre frequency ω0. The
number of testing signal source is D. Antenna array is a spaced linear array which consists of M(M>D) array elements; each element has the same characteristics, and it is isotropic in each direction. The spacing is d, and the array element interval is not larger than half the wavelength of the highest signal frequency. Each antenna element in the far field source, namely, an antenna array receiving the signals coming from the signal source is a plane wave. Both array elements and test signals are uncorrelated; variance σ2
is zero-mean Gaussian noise nm(t). Each receiving branch has
the same characteristics.
The implementation steps of MUSIC algorithm are shown below.
1) Obtain the following estimation of the covariance matrix based on the N received signal vector:
𝑅𝑥 = 1
𝑁 𝑋 𝑖 𝑋
𝐻 𝑁
𝑖=1 (𝑖),
Or collect the data and estimate [4] Rx = E|XX H
| 2) For eigenvalue, decompose the above covariance matrix 𝑅𝑥=𝐴𝑅𝑠𝐴𝐻+𝜎2𝐼.
3) According to the order of eigenvalues, take eigenvalue and eigenvector which are equal to the number of signal D as signal part of space; take the rest, M-D eigenvalues and eigenvectors, as noise part of space. 4) Get the noise matrix En: AHvi=0, i=D+1, D+2,…,M, En=[VD+1,VD+2,…,VM].
5) Vary θ; according to the formula Pmu(θ) = 1/𝑎𝐻(𝜃)𝐸𝑛𝐸𝑛𝐻𝑎(𝜃).
6) Calculate the spectrum function; then obtain the estimated value of DOA by searching the peak[3][4][9].
TLS ESPRIT Algorithm :
To solve the complex computation problem in the MUSIC algorithm, an algorithm called ESPRIT, which is also based on signal subspace technique was introduced by Richard Roy and Thomas Kailath in 1989[10]. The idea of ESPRIT is that the sensor array is decomposed into two identical sub-arrays. In the sub-arrays, two elements which are corresponding to each have the same pan. That is to say, the array has translational invariance. Every two shifts match the same array element pairs. Fortunately, in practice many of the arrays satisfy this condition, such as ULA.
Assume there are d < m narrowband stationary zero-mean sources centered at frequency wo, and located
sufficiently far from the array such that in homogeneous isotropic transmission media, the wavefronts impinging on the array are planar. Additive noise is present at all the 2m sensors and is assumed to be a stationary zero-mean random process that is uncorrelated from sensor to sensor[10]. To exploit the translational invariance property of the sensor array, consider the array as being comprised of two identical subarrays, X and Y, displaced from each other by a known displacement vector[10].
The computation step of ESPRIT algorithm can be summarized as follows:
1) From two subarrays X & Y, we get measurements and subarrays are displaced by
xi t = dk=1ai θk sk(t) + nxi(t) ,
yi t = dk=1ai θk sk(t)ejω0Δ sin θk/v+ nyi(t) ,
combine the two subarray outputs, z(t) = x t
y t = A s t + nz t
2) Then calculate the covariance matrixes of two arrays; Rzz = E[z(t)zH(t)] = ARssAH + σ2I
3) Find their eigenvalues and eigenvectors from the measurements; RZZ = Mi=1λieieiH = EsΣsEsH+ σ2EnEnH
4) Decompose signal subspace Es to obtain Es =
Ex
5) Compute the Φk = -FxFy-1
6) Estimate the angle of arrival using the eigenvalues of, Φk = eigen values of (-FxFy -1
)
7) Estimate the Angle-Of-Arrival as θk = sin−1 arg (ϕk)
βΔ .
Pro ESPRIT Algorithm :
A new concept „Propagator‟ for array signal processing is recently introduced, the properties of which have been proven useful for DOA estimation. This attractive concept is the propagator which can easily be extracted from the cross spectral matrix of the received signals for DOA estimation without Eigen-decomposition. It brings more accuracy without increasing computation complex, and another has faster speed of signal processing. The simulation shows effectiveness and high resolution of proposed methods[11].Consider the uniform Linear array(ULA) in x-z and y-z plane. Each linear array consists of M elements. Suppose that there are D narrow band sources, s(t) , with same wavelength λ impinging on the array, such that i-th source has an elevation angle θi. We divide the cells on z-axis into
two sub-array X,Y.
The computation step of Pro ESPRIT algorithm can be summarized as follows: 1) The received data model of both of the sub-arrays is given by
x (k) = AM-1 s(k) + n(k)
y (k) = AM-1Φ1s(k) + n(k)
2) Divide the steering matrix AM −1 into two sub-matrix as: AM−1=
A1
A2
3) Define a new matrix , C = AAM−1
M−1 Φ1 =
A1
C1
4) The propagator P is a unique linear operator which can be give by, PHA1 = C1
5) The crosscorrelation matrix of received data can be defined as, R = 1
NBB H =1
N b k b
H k N
k=1
Where matrix b(k) = x(k)T y(k)T T, and N snapshots data matrix can be written as B = [b(1),…,b(N)] . 6) The partitions cross-correlation matrix R = R 1 R2
7) Compute propagator by, PCSM = (R1R1H)−1R1R2H
8) Partition CSM PCSM as following, PCSM = P1T P2T P3T T
9) Estimation of the diagonal elements of matrix Φ1 can be obtained by finding the K eigen-values of P3PΓ1. Φi = eigen-values of ( P3PΓ1)
10) Estimate the Angle-Of-Arrival for each source can easily found as, θk = cos−1
arg Φ1kk 2π d
λ
IV. RESULTS AND DISCUSSION
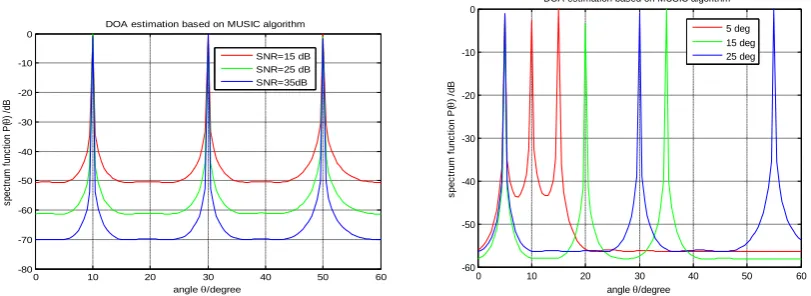
A. SIMULATION RESULTS FOR MUSIC ALGORITHM Case1: MUSIC Spectrum For Varying The Values Of SNR:
Fig 2: MUSIC spectrum for SNR variations Fig 3: MUSIC spectrum for horizontal angle separation variation
The effect of the signal to noise ratio on the estimation are simulated and results are given in Fig 2. It is seen that as the value of SNR increases, estimation performance increases. At low SNR, MUSIC performance would drop dramatically.
Case 2: MUSIC Spectrum For Varying The Horizontal Angle Separation:
Fig 3 shows that sharper peaks increases as the angle separation between signals increases.
Case.3: MUSIC Spectrum For Varying Number Of Elements:
Fig 4: MUSIC spectrum for no of array element variations Fig 5: MUSIC spectrum for snapshots variations Fig 4 shows that if array parameters are the same, the more number of array elements, the better estimation performance. Estimation performance increases with small reduction in beamwidth and noise level.
Case.4: MUSIC Spectrum For Varying Number Of Snapshots:
Fig 5 shows that by the increasing the number of snapshots, peaks in the MUSIC spectrum become further sharper for higher number of snapshots.
0 10 20 30 40 50 60
-80 -70 -60 -50 -40 -30 -20 -10 0
angle /degree
s
p
e
c
tr
u
m
f
u
n
c
tio
n
P
(
)
/d
B
DOA estimation based on MUSIC algorithm SNR=15 dB SNR=25 dB SNR=35dB
0 10 20 30 40 50 60
-60 -50 -40 -30 -20 -10 0
angle /degree
s
p
e
c
tr
u
m
f
u
n
c
ti
o
n
P
(
)
/d
B
DOA estimation based on MUSIC algorithm
5 deg 15 deg 25 deg
0 10 20 30 40 50 60
-60 -50 -40 -30 -20 -10 0
angle /degree
s
p
e
c
tr
u
m
f
u
n
c
ti
o
n
P
(
)
/d
B
DOA estimation based on MUSIC algorithm
M=4 M=8 M=10
0 10 20 30 40 50 60
-70 -60 -50 -40 -30 -20 -10 0
angle /degree
s
p
e
c
tr
u
m
f
u
n
c
ti
o
n
P
(
)
/d
B
DOA estimation based on MUSIC algorithm
Case 5: MUSIC Spectrum For Element Spacing Of The Sensor Array:
Fig 6: MUSIC spectrum for element spacing variations Fig 7: TLS ESPRIT for SNR variations
When the elements of the sensor array are placed too close to each other, mutual coupling effects dominate resulting in inaccuracies in the estimated angles of arrival, as shown in Fig.6
B. SIMULATION RESULTS OF TLS ESPRIT ALGORITHM
Firstly, the directions of arrival of three incident signals which are received by the antenna array which has 15 array elements, element spacing lambda /2, are chosen respectively as 10, 30 and 50 deg.
Case.1: TLS ESPRIT For Varying The Values Of SNR:
Effect of signal to noise ratio (SNR) on estimation performance are simulated. Fig 7 clearly shows that changing SNR value affects the estimation performance. Performance is better with higher values of SNR.
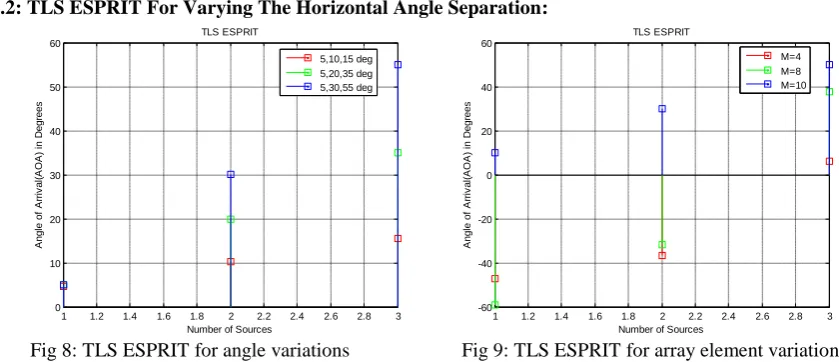
Case.2: TLS ESPRIT For Varying The Horizontal Angle Separation:
Fig 8: TLS ESPRIT for angle variations Fig 9: TLS ESPRIT for array element variations
From fig.8, it is observed that for this algorithm DOA detection decreases as angular separation between arriving signals increases.
Case.3: TLS ESPRIT For Varying Number Of Elements:
It is seen from fig 9 that as the number of array elements increases, the estimation performance increases.
0 10 20 30 40 50 60
-60 -50 -40 -30 -20 -10 0
angle /degree
s
p
e
c
tr
u
m
f
u
n
c
ti
o
n
P
(
)
/d
B
DOA estimation based on MUSIC algorithm
d=0.15 lambda d=0.25 lambda d=0.5 lambda
1 1.2 1.4 1.6 1.8 2 2.2 2.4 2.6 2.8 3
0 10 20 30 40 50 60
TLS ESPRIT
Number of Sources
A
n
g
le
o
f
A
rr
iv
a
l(
A
O
A
)
in
D
e
g
re
e
s
SNR=15 dB SNR=25 dB SNR=35 dB
1 1.2 1.4 1.6 1.8 2 2.2 2.4 2.6 2.8 3
0 10 20 30 40 50 60
TLS ESPRIT
Number of Sources
A
n
g
le
o
f
A
rr
iv
a
l(
A
O
A
)
in
D
e
g
re
e
s
5,10,15 deg 5,20,35 deg 5,30,55 deg
1 1.2 1.4 1.6 1.8 2 2.2 2.4 2.6 2.8 3
-60 -40 -20 0 20 40 60
TLS ESPRIT
Number of Sources
A
n
g
le
o
f
A
rr
iv
a
l(
A
O
A
)
in
D
e
g
re
e
s
Case.4: TLS ESPRIT For Varying Number Of Snapshots:
Fig 10: TLS ESPRIT for snapshots variations Fig 11: TLS ESPRIT for element spacing variations
From fig 10, it can be seen that the spectrum and DOA estimates for this algorithm are almost close to the actual DOA even at lower number of snapshots. Therefore, it outperforms MUSIC technique.
Case 5: TLS ESPRIT For Varying Element Spacing Of The Sensor Array:
When the elements of the sensor array are placed too close to each other, mutual coupling effects dominate resulting in inaccuracies in the estimated angles of arrival, as shown in Fig.11.
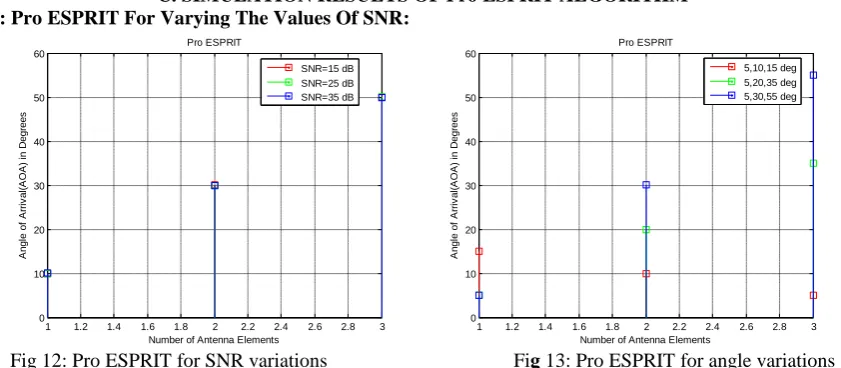
C. SIMULATION RESULTS OF Pro ESPRIT ALGORITHM Case.1: Pro ESPRIT For Varying The Values Of SNR:
Fig 12: Pro ESPRIT for SNR variations Fig 13: Pro ESPRIT for angle variations Fig 12 shows the results for Pro ESPRIT algorithm for varying SNR for 15 dB, 25 dB and 35 dB. It clearly shows that as the value of SNR goes on increasing, results are much improved. At lower value of SNR, also estimates good DOA.
Case.2: Pro ESPRIT For Varying The Horizontal Angle Separation:
From Fig 13, it is clear that as the horizontal angle separation between the elements is increased better is the performance of Pro ESPRIT algorithm.
1 1.2 1.4 1.6 1.8 2 2.2 2.4 2.6 2.8 3
0 10 20 30 40 50 60
TLS ESPRIT
Number of Sources
A
n
g
le
o
f
A
rr
iv
a
l(
A
O
A
)
in
D
e
g
re
e
s
K=100 K=500 K=1000
1 1.2 1.4 1.6 1.8 2 2.2 2.4 2.6 2.8 3
0 10 20 30 40 50 60
TLS ESPRIT
Number of Sources
A
n
g
le
o
f
A
rr
iv
a
l(
A
O
A
)
in
D
e
g
re
e
s
d=0.15 lambda d=0.25 lambda d=0.5 lambda
1 1.2 1.4 1.6 1.8 2 2.2 2.4 2.6 2.8 3
0 10 20 30 40 50 60
Pro ESPRIT
Number of Antenna Elements
A
n
g
le
o
f
A
rr
iv
a
l(
A
O
A
)
in
D
e
g
re
e
s
SNR=15 dB SNR=25 dB SNR=35 dB
1 1.2 1.4 1.6 1.8 2 2.2 2.4 2.6 2.8 3
0 10 20 30 40 50 60
Pro ESPRIT
Number of Antenna Elements
A
n
g
le
o
f
A
rr
iv
a
l(
A
O
A
)
in
D
e
g
re
e
s
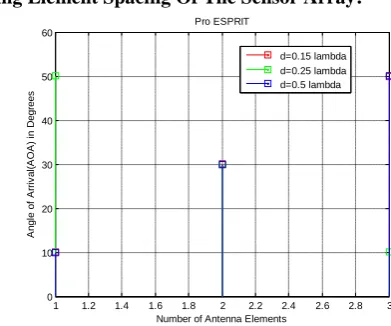
Case.3: Pro ESPRIT For Varying Number Of Elements:
Fig 14: Pro ESPRIT for no of sensor array variations Fig 15: Pro ESPRIT for snapshots variations
Fig 14 shows the results for Pro ESPRIT algorithm for varying no of sensor array elements. It clearly shows that as the sensor array elements are increased, performance is better as compared to less number of array element.
Case.4: Pro ESPRIT For Varying Number Of Snapshots:
Fig 15 shows the results for Pro ESPRIT algorithm for varying number of snapshots. It clearly shows that at lower number of snapshots it gives good DOA results but also there is improvement with increase in number of snapshot.
Case 5: Pro ESPRIT For Varying Element Spacing Of The Sensor Array:
Fig 16: Pro ESPRIT for element spacing variations
Fig 16 shows the results for Pro ESPRIT algorithm for varying the element spacing between the sensor array elements. It shows that as the spacing is increased, improvement in results is getting better
D. COMPARISON AND ERROR ANALYSIS OF TLS ESPRIT & Pro ESPRIT ALGORITHM
The estimation performances of ESPRIT algorithm are simulated and the results obtained are given in Tables 1 to 5.
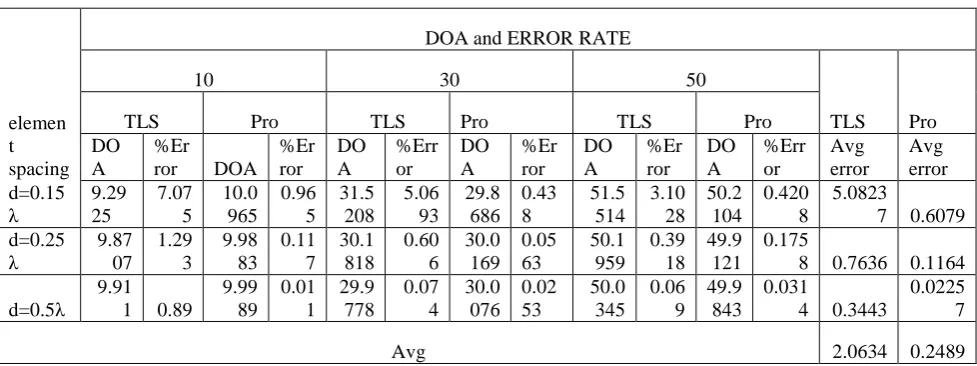
Case.1: Error Analysis For Varying The Element Spacing:
The effect of the element spacing between the sensor array elements is simulated and the results are given in Table 1. When the results are analysed, it is seen that as the spacing between the sensor array elements is increased, the error rate sharply decreases and the estimation performance of ESPRIT algorithm increases.
1 1.2 1.4 1.6 1.8 2 2.2 2.4 2.6 2.8 3
0 10 20 30 40 50 60
Pro ESPRIT
Number of Antenna Elements
A
n
g
le
o
f
A
rr
iv
a
l(
A
O
A
)
in
D
e
g
re
e
s
M=4 M=8 M=15
1 1.2 1.4 1.6 1.8 2 2.2 2.4 2.6 2.8 3
0 10 20 30 40 50 60
Pro ESPRIT
Number of Antenna Elements
A
n
g
le
o
f
A
rr
iv
a
l(
A
O
A
)
in
D
e
g
re
e
s
K=100 K=500 K=1000
1 1.2 1.4 1.6 1.8 2 2.2 2.4 2.6 2.8 3
0 10 20 30 40 50 60
Pro ESPRIT
Number of Antenna Elements
A
n
g
le
o
f
A
rr
iv
a
l(
A
O
A
)
in
D
e
g
re
e
s
Table 1: Error analysis & comparison of TLS & Pro ESPRIT for variations in element spacing
elemen t spacing
DOA and ERROR RATE
10 30 50
TLS Pro
TLS Pro TLS Pro TLS Pro
DO A
%Er
ror DOA
%Er ror DO A %Err or DO A %Er ror DO A %Er ror DO A %Err or Avg error Avg error d=0.15 λ 9.29 25 7.07 5 10.0 965 0.96 5 31.5 208 5.06 93 29.8 686 0.43 8 51.5 514 3.10 28 50.2 104 0.420 8 5.0823
7 0.6079 d=0.25 λ 9.87 07 1.29 3 9.98 83 0.11 7 30.1 818 0.60 6 30.0 169 0.05 63 50.1 959 0.39 18 49.9 121 0.175
8 0.7636 0.1164
d=0.5λ 9.91
1 0.89 9.99 89 0.01 1 29.9 778 0.07 4 30.0 076 0.02 53 50.0 345 0.06 9 49.9 843 0.031
4 0.3443
0.0225 7
Avg 2.0634 0.2489
Case.2: Error Analysis For Varying The Horizontal Angle Separation:
When the results from Table 2 are analysed, it is seen that as the angular separation is increased, the error rate decreases and the estimation performance of ESPRIT algorithm increases.
Table 2: Error analysis & comparison of TLS & Pro ESPRIT for variations in horizontal angle separation
horizo ntal angle separa tion
DOA and ERROR RATE
5 10,20,30 15,35,55
TLS Pro
TLS Pro TLS Pro TLS Pro
DO A %Err or DO A %Er
ror DOA
%Er ror DO A %Er ror DO A %Er ror DO A %Er ror Avg error Avg error 5 deg 4.57 06 8.58 8 5.00 83 0.16 6 10.19 86 1.98 6 9.98 45 0.15 5 15.4 81 3.20 66 14.9 833 0.11 13 4.593 5 0.144 1 15 deg 4.97 16 0.56 8 5.00 93 0.18 6 19.97 71 0.11 45 19.9 971 0.01 45 35.0 15 0.04 285 35.0 241 0.06 885 0.241 7 0.089 78 25 deg 5.02 48 0.49 6 4.99 24 0.15 2 30.08 16 0.27 2 30.0 2172 0.07 24 55.0 174 0.03 163 54.9 743 0.04 672 0.266 5 0.090 3
Avg 1.700 0.108
Case.3: Error Analysis For Varying Number Of Elements:
Table 3: Error analysis & comparison of TLS & Pro ESPRIT for variations in number f sensor array elements
no of array ele
DOA and ERROR RATE
10 30 50
TLS Pro
TLS Pro TLS Pro TLS Pro
DO A %Err or DO A %Er ror DO A %Er ror DO A %Er ror DO A %Er
ror DOA
%Er ror Avg error Avg error M=4 6.24
3 37.57 10.0 485 0.48 5 36.7 036 22.3 453 30.0 5297 0.17 65 47.3 589 5.28 22 49.92 47 0.15
06 21.7325 0.2707
M=8 31.7 177 217.1 77 9.99 71 0.02 9 37.5 648 25.2 16 29.9 795 0.06 833 59.0 448 18.0 896 49.99 11 0.01
78 86.8275 0.0383 M=1
0
10.0
173 0.173 10.0 139 0.13 9 29.8 79 0.40 33 29.9 909 0.03 03 49.9 599 0.08 02 50.01 2 0.02
4 0.2188 0.0644
Avg 36.2596 0.1244
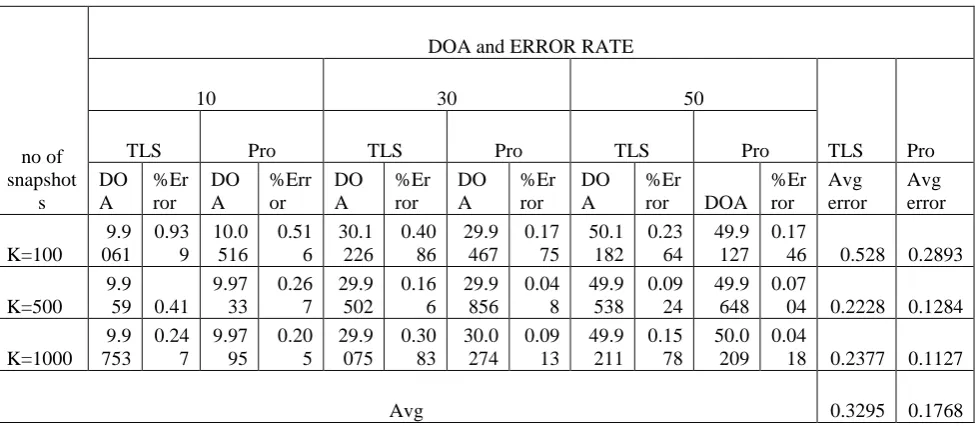
Case.4: Error Analysis For Varying Number Of Snapshots:
The effect of variations in number of snapshots are analysed in table 4. It clearly shows that as the number of snapshots increases, results are improved for both and error rate is reduced.
Table 4: Error analysis & comparison of TLS & Pro ESPRIT for variations in number of snapshots
no of snapshot
s
DOA and ERROR RATE
10 30 50
TLS Pro
TLS Pro TLS Pro TLS Pro
DO A %Er ror DO A %Err or DO A %Er ror DO A %Er ror DO A %Er
ror DOA
%Er ror Avg error Avg error K=100 9.9 061 0.93 9 10.0 516 0.51 6 30.1 226 0.40 86 29.9 467 0.17 75 50.1 182 0.23 64 49.9 127 0.17
46 0.528 0.2893
K=500 9.9
59 0.41 9.97 33 0.26 7 29.9 502 0.16 6 29.9 856 0.04 8 49.9 538 0.09 24 49.9 648 0.07
04 0.2228 0.1284
K=1000 9.9 753 0.24 7 9.97 95 0.20 5 29.9 075 0.30 83 30.0 274 0.09 13 49.9 211 0.15 78 50.0 209 0.04
18 0.2377 0.1127
Avg 0.3295 0.1768
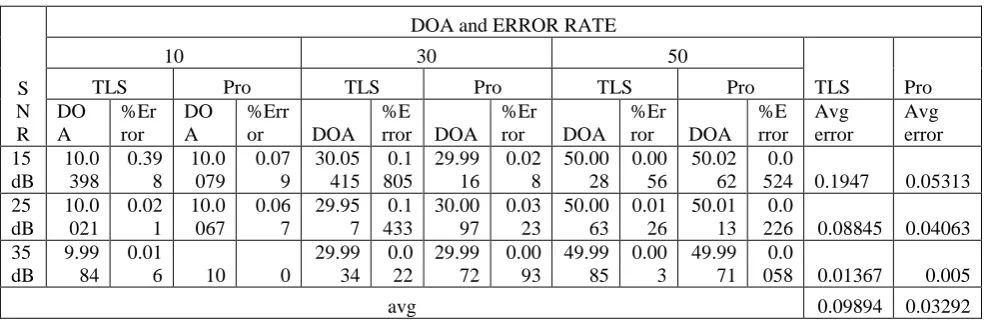
Case 5: Error Analysis For Varying SNR :
Table 5: Error analysis & comparison of TLS & Pro ESPRIT for variations in SNR
S N R
DOA and ERROR RATE
10 30 50
TLS Pro
TLS Pro TLS Pro TLS Pro
DO A
%Er ror
DO A
%Err
or DOA
%E
rror DOA %Er
ror DOA
%Er
ror DOA
%E rror
Avg error
Avg error 15
dB 10.0
398 0.39
8 10.0
079 0.07
9 30.05
415 0.1 805
29.99 16
0.02 8
50.00 28
0.00 56
50.02 62
0.0
524 0.1947 0.05313 25
dB 10.0
021 0.02
1 10.0
067 0.06
7 29.95
7 0.1 433
30.00 97
0.03 23
50.00 63
0.01 26
50.01 13
0.0
226 0.08845 0.04063 35
dB 9.99
84 0.01
6 10 0
29.99 34
0.0 22
29.99 72
0.00 93
49.99 85
0.00 3
49.99 71
0.0
058 0.01367 0.005
avg 0.09894 0.03292
VI. CONCLUSION
In this paper, MUSIC algorithm as well as ESPRIT (both TLS and Pro) were implemented in MATLAB, and simulations were performed. These methods have greater resolution and accuracy than the other considered classical methods. Extensive computer simulations were performed to demonstrate the effect of various parameters on the performance of the MUSIC and ESPRIT algorithms and their ability to resolve incoming signals accurately and efficiently. From the simulated results, it is observed that algorithms provide an accurate estimation of the DOA with improved resolution power than other classical DOA techniques. The simulation results show that their performance improves with more elements in the array, with large snapshots of signals and greater angular separation between the signals, higher SNR value. These improvements are seen in form of the sharper peaks and a smaller error in angle detection. From error analysis table‟s, it clears that Pro ESPRIT is better than TLS ESPRIT. This can be widely used in the design of smart antenna system. The results also improve and accelerate the design of wireless networks.
REFERENCES
[1] Richard Roy And Thomas Kailath, “ ESPRIT-Estimation Of Signal Parameters Via Rotational Invariance Techniques”, IEEETransactions
On Acoustics Speech. And Signal Processing, Vol 37. No 7, pp. 984-995,July 1989.
[2] M. M. Abdalla, M. B. Abuitbel, and M. A. Hassan, “Performance Evaluation of Direction of Arrival Estimation Using MUSIC and ESPRIT
Algorithms for Mobile Communication Systems”, IEEE, pp , 2013.
[3] Z. I. Khan, “Performance Evaluation Of MUSIC And ESPRIT Algorithms In Estimating Direction Of Arrival For Linear Array”, 2007
[4] Richard Roy And Thomas Kailath, “ ESPRIT-Estimation Of Signal Parameters Via Rotational Invariance Techniques”, IEEETransactions
On Acoustics Speech. And Signal PMcessing, Vol 37. No 7, pp. 984-995,July 1989.
[5] T. B. Lavate, V. K. Kokate & A. M. Sapkal, “Performance Analysis Of Music And Esprit DOA Estimation Algorithms For Adaptive Array
Smart Antenna In Mobile Communication” , IEEE, pp.152-158, 2010.
[6] M. M. Abdalla, M. B. Abuitbel, and M. A. Hassan, “Performance Evaluation of Direction of Arrival Estimation Using MUSIC and ESPRIT
Algorithms for Mobile Communication Systems”, IEEE, pp , 2013.
[7] C. L. Srinidhi, Dr. S. A. Hariprasad, “Comparative Study on Performance Analysis of High Resolution Direction of Arrival Estimation
Algorithms” , IJARCET, pp 67-79,Vol. 1, Issue 4, June 2012.
[8] T.Nageswara Rao, V.Srinivasa Rao, “ Implementation of MUSIC Algorithm for a Smart Antenna System for Mobile Communications”,
IJSER, Vol 2, Issue 12, pp. 1-6, December-2011.
[9] Daniels Pielman, A. Paulraj And Thomas Kailath, “Performance Analysis Of The Music Algorithm”, IEEE, pp. 1909-1912, 1986.
[10] R. Roy, A. Paulraj And T. Kailath, “ Estimation Of Signal Parameters Via Rotational Invariance Techniques – ESPRIT”, IEEE, pp. 41.6.1-
41.6.5, 1986.