ISSN (Print) : 2320 – 3765 ISSN (Online): 2278 – 8875
I
nternational
J
ournal of
A
dvanced
R
esearch in
E
lectrical,
E
lectronics and
I
nstrumentation
E
ngineering
(An ISO 3297: 2007 Certified Organization)
Website: www.ijareeie.com
Vol. 6, Issue 2, February 2017
An Artificial Neural Network Based Approach
for Forecasting the Frequency of Power Grid
to Achieve Optimal Frequency Stabilization
Divyansh Chourey1, Amit Kumar1, Himanshu Gupta1, Jitesh Kumar1, Anand Kumar1, Dr. Anup Mishra2
Bachelor of Engineering, Dept. of Electrical & Electronics Engg., Bhilai Institute of Technology, Durg, India1 H.O.D., Dept. of Electrical & Electronics Engg., Bhilai institute of Technology, Durg, India2
ABSTRACT: Significant involvement of soft computing techniques like neural network and neuro-fuzzy system, leads to the computation of different parameter in advance for the purposes like safety, operation, expansion, risk management, market analysis, etc. A large variety of approaches have been developed in load and electricity price forecasting using the neural network techniques with appreciable accuracy. Still, the frequency is the parameter of the power grid which is notforecast. It is also believed that the frequency is somewhat the constant parameter and need not be forecast which never attracted the attention of research analysts. Random and fast switching of load faced by the grid in a typical practice causes the frequency disturbance and this disturbance is quite dangerous even in small amount with respect to grid operation and safety. A small percentage change in frequency may lead to even grid failure. In this paper, Artificial Neural Network is used to make frequency forecastzz.
KEYWORDS: Frequency Forecasting, Frequency Response, Grid Model, Neural Networks
I.INTRODUCTION
The frequency forecasting will surely be a key issue for power system operation and grid security. Significant involvement of soft computing techniques like neural network and neuro-fuzzy system, lead the computation of different parameter in advance for the purposes like safety, operation, expansion, risk management, market analysis etc. [1]. It is also very much important for those grids which adopted deviation settlement mechanism or unscheduled interchange mechanism for frequency stabilization. Frequency forecasting will certainly behelping tool for this type of grids and its entities in economic point of view also.
ISSN (Print) : 2320 – 3765 ISSN (Online): 2278 – 8875
I
nternational
J
ournal of
A
dvanced
R
esearch in
E
lectrical,
E
lectronics and
I
nstrumentation
E
ngineering
(An ISO 3297: 2007 Certified Organization)
Website: www.ijareeie.com
Vol. 6, Issue 2, February 2017
II.GRIDFREQUENCYRESPONSES
In this section, we examine the frequency responses for alternator in different systems and frequency responses for grid system.
A. ALTERNATOR FREQUENCY RESPONSE & GRID FREQUENCY RESPONSE
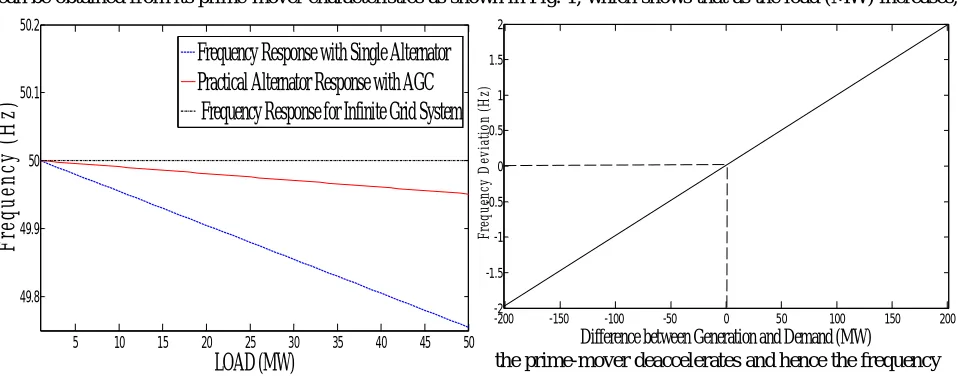
In a single alternator system, the frequency response
can be obtained from its prime-mover characteristics as shown in Fig. 1, which shows that as the load (MW) increases,
the prime-mover deaccelerates and hence the frequency
of alternator decreases. Similarly, for idealinfinite bus systems, the frequency is strictly constant and independent of the load as shown in Fig.1. But the practical power system is neither belongs to first case nor to second case, but belongs in between the two. Although by using the automatic gain control at boiler-turbine arrangement this characteristic can be improved to get characteristics closer to the ideal one that is the infinite grid frequency response which is also shown in Fig. 1 [2][3]. Clearly, the slopes of practical cases, one with AGC and other without AGC are different. Hence, down-fall in frequency by increasing the load in practical case is much less then single generator case.On extending the concept to grid level, this statement can be mathematically described as:
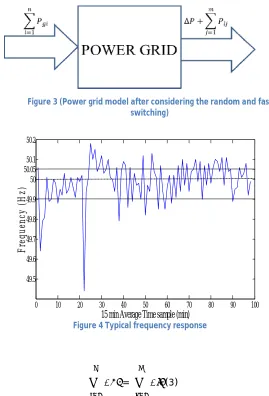
∆ ∝ ∆ (1)
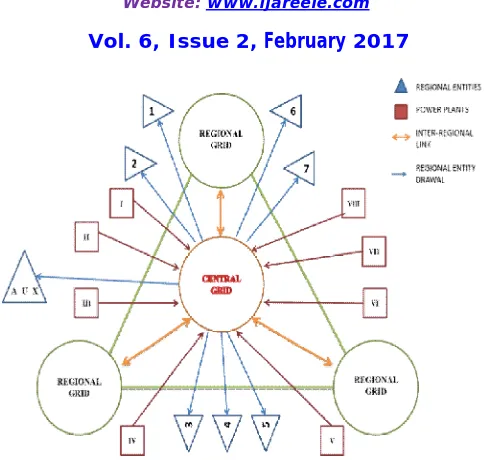
Hence, the characteristicsdrawn from the equation (1) & considering negligible transmission loss is shown in Fig. 2 [3]. Where ∆f is the frequency deviation and ∆P is the difference between generation and load. In this paper, grid with n number of generating plants and m number of load centres is assumed&this can be shown in Fig. 3.Where;
PGi = Generation in MW by ith unit or station
PLj = Load drawn in MW by jth load centre or load bus
Hence, to make frequency forecast, each grid should be generalized in the form as shown in Fig. 3. Figure 2(Frequency response of alternator in different
systems)
-200 -150 -100 -50 0 50 100 150 200
-2 -1.5 -1 -0.5 0 0.5 1 1.5 2
Difference between Generation and Demand (MW)
F re q u en c y D e v ia ti o n ( H z)
5 10 15 20 25 30 35 40 45 50
49.8 49.9 50 50.1 50.2
LOAD (MW)
F
re
q
u
e
n
c
y
(
H
z
)
Frequency Response with Single Alternator
Practical Alternator Response with AGC
Frequency Response for Infinite Grid System
ISSN (Print) : 2320 – 3765 ISSN (Online): 2278 – 8875
I
nternational
J
ournal of
A
dvanced
R
esearch in
E
lectrical,
E
lectronics and
I
nstrumentation
E
ngineering
(An ISO 3297: 2007 Certified Organization)
Website: www.ijareeie.com
Vol. 6, Issue 2, February 2017
B. CAUSES OF FREQUENCY DEVIATION OR DISTURBANCE
As seen from equation (1), if value of ∆P is zero, the deviation in frequency is also zero, hence, the frequency will be constant and effect of disturbance will be zero. Following are the causes of frequency disturbance in the grid:
Fast and random switching of load [4]
Transients in steam inlet and prime-mover rotational transients. [5] Contingencies (loss of load block or generating block) [5]
Power harmonics in grid due to various types of load(mainly non-linear loads)
This paper deals with the main and continuously observed reason of frequency disturbancei.e. fast and random switching of load and steam inlet transient that causes transient in prime mover rotational speed.
From Fig. 3, if;
= (3)
Then, value of ∆P would be zero.Hence, the frequency will be constant.If the random and fast switching resultsunbalance in total generation and total demand as shown in Fig. 3, Where;
0 10 20 30 40 50 60 70 80 90 100
49.5 49.6 49.7 49.8 49.9 50 50.1 50.2
50.05
15 min Average Time sample (min)
F
re
q
u
en
c
y
(
H
z
)
Figure 4 Typical frequency response
ISSN (Print) : 2320 – 3765 ISSN (Online): 2278 – 8875
I
nternational
J
ournal of
A
dvanced
R
esearch in
E
lectrical,
E
lectronics and
I
nstrumentation
E
ngineering
(An ISO 3297: 2007 Certified Organization)
Website: www.ijareeie.com
Vol. 6, Issue 2, February 2017
Figure 5(Generalized grid model)
∆P<0; is termed as power chock (Pc);
∆P >0; is termed as power lapse (PL);
Excess generation then demand leads to chock of power within the grid. The energy corresponding to this chock power results in two major scenario;
Increases in grid frequency Transmission losses increases
Similarly, for power lapse, the energy corresponding to the power lapse results in frequency also.Similar cases can be judged, if prime-mover rotation transients are considered which also leads to the problemof power chock or power lapse [6][7]. Power chock will be having random value depending upon the switching instants.
C. DIFFICULTIES IN FREQUENCY FORECASTING
A typical frequency profile of anIndian utility system is shown in Fig. 4. This grid has an allowable frequency deviation band of 0.15 Hz and since the bandwidth of the frequency is very low and deviation from its fixed value is(in this case it is 50Hz) of order 1-2% are very critical and may lead to grid failure. So, the first difficulty in forecasting the grid frequency is its accuracy, as the bandwidth itself is very small, so the forecasting accuracy must be very high (more than 94%).
In this paper, the suggested accuracyof forecasting frequency will be in terms ofthe absolute error & is 33% of its maximum bandwidth. If the bandwidth is 0.15 Hz, the absolute error should range about 0.05 Hz for appreciable forecasting.
The second difficulty encountered in frequency forecasting is its very random characteristics and time independence. In this paper, the mutual disturbance is considered as zero which is caused by grid connected by inter-regional linkages of central grid [8].
ISSN (Print) : 2320 – 3765 ISSN (Online): 2278 – 8875
I
nternational
J
ournal of
A
dvanced
R
esearch in
E
lectrical,
E
lectronics and
I
nstrumentation
E
ngineering
(An ISO 3297: 2007 Certified Organization)
Website: www.ijareeie.com
Vol. 6, Issue 2, February 2017
III. GRID MODEL & FREQUENCY FORECASTING PARAMETERS
In this section, the power grid is generalized to find out the parameters to decide the grid frequency and then the model is reduced to make frequency forecast.
A. MODELLING GRID
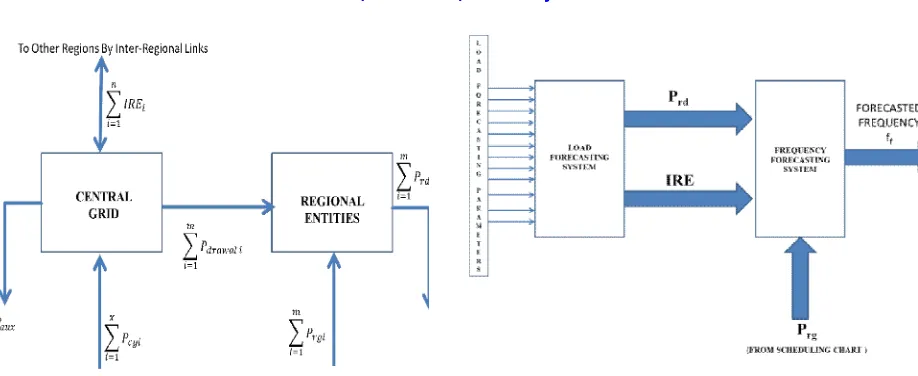
To make frequency forecasting, entire grid needs to be converted into a form as shown in Fig.3.In this paper, a generalized grid is considered which is named as central grid whose frequency is to be forecast. Letn number of regional grids which makes a completenetwork with the central grid. m number of regional entities are considered with their own generating stations. Central grid is connected to the regional grid via inter-regional corridor in which power exchange is termed here as inter-regional exchange (IRE),x number of generating stations (which are actively working) dump their power into central grid. These power stations may be inter-state generatingstation, captive power plant or independent power plant. An auxiliary power drawal is also considered. The complete structure of grid system is shown in Fig.5.
B. MODEL REDUCTION
The grid model is shown in Fig. 5is to be reduced to calculate the chock power (Pc) or lapse power (Pl). The
reduced grid model is shown in Fig. 6 with its entire considered component network;The central grid can further be divided into twosimilar smaller blocks in which net power input to the grid would be;
= (4)
And net demand of central grid;
= + (5)
In the perspective of frequency forecasting, the impact on frequency due topower chock caused by the regional entities would be different from thepower chock caused by inter-regional exchange, because IRE is power exchange withinthe same network and Pdrwl is power exchange to another network.Hence, the reduced grid model for
frequency forecasting is shown in Fig. 6. The Prg is total regional generation, Prd is total regional demand, and IRE is
total power exchange within the same network. The Pdrwlis power drawal by the regional entities from the central power
grid.Prg, Prd and IRE will decide the chockor lapse in a grid with their own effect on frequency asa different non-linear
function and are input vector to the ANN.
If IRE is considered as export;
Pc = Prg – Prd –IRE (6) So,
Grid frequency = non-linear function (Prg, Prd, IRE) (7)
C. PARAMETER GENERALIZATION
Input vector to the ANN would now be;
[V] = [Prg Prd IRE] (8)
ISSN (Print) : 2320 – 3765 ISSN (Online): 2278 – 8875
I
nternational
J
ournal of
A
dvanced
R
esearch in
E
lectrical,
E
lectronics and
I
nstrumentation
E
ngineering
(An ISO 3297: 2007 Certified Organization)
Website: www.ijareeie.com
Vol. 6, Issue 2, February 2017
Generalized [V] = [Prd / Prg IRE / Prg] ×100 (9)
Figure 6(Reduced model of central grid) Figure 7(Frequency forecasting system complete structure)
Generalized target [T] = [f]/f0 (10)
Where f0 is rated operating frequency of system.
IV. FREQUENCY FORECASTING
In this section, the complete structure of the frequency forecasting system is discussed along with its advantages and limitations.
A. FORECASTING SYSTEM
The value of the input vector [V] can be easily forecast using load forecasting techniques and Prg can be taken from
ISSN (Print) : 2320 – 3765 ISSN (Online): 2278 – 8875
I
nternational
J
ournal of
A
dvanced
R
esearch in
E
lectrical,
E
lectronics and
I
nstrumentation
E
ngineering
(An ISO 3297: 2007 Certified Organization)
Website: www.ijareeie.com
Vol. 6, Issue 2, February 2017
B. LIMITATIONS OF FREQUENCY FORECASTING SYSTEM
The grid frequency forecasting system has fewlimitations as given below;
The system should be harmonic free or effect of harmonics on grid frequency is neglected. Power trading is not considered in this paper
Effect of load type on grid frequency is negligible
Frequency forecasting system’s accuracy depends on the accuracy of load forecasting system. System inertia is considered to be same for industrial and commercial loads.
V. CASE STUDY & NUMERICAL RESULTS
The forecast is performed on the western regional grid of PGCIL, India considering it to be central grid. Data are recorded from 1’st SEP 2016 in every minute to record about 5000 training sets for ANN, which is further divided into
training, validation and testing sets to avoid overfitting[11][12]. Central grid considered for forecast is one of the 5 regional grids of India with all regions connected via inter-regional corridor.
This grid has 7 regional entities (Gujrat, Madhya-Pradesh, Chhattisgarh, Maharashtra, Goa, Daman-Diu, and Dadra Nagar Haveli). The recorded data set is used to train Backpropagation feed-forward network using MATLAB NEURAL NETWORK TOOLBOX. The training rule used is Levenberg-Marquat. The forecasting performance is evaluated by using the mean absolute percentage error (MAPE) and mean absolute error (MAE).ff is the frequency
forecast,fa is the actual frequency and T is sampling time and n is the number of samples.
Then;
= 1 − × 100 % (11)
And;
ISSN (Print) : 2320 – 3765 ISSN (Online): 2278 – 8875
I
nternational
J
ournal of
A
dvanced
R
esearch in
E
lectrical,
E
lectronics and
I
nstrumentation
E
ngineering
(An ISO 3297: 2007 Certified Organization)
Website: www.ijareeie.com
Vol. 6, Issue 2, February 2017
The net regression line obtained after training the ANN is close to 0.6 which is appreciable result.The frequency forecastingsystem is tested on selected day of SEP 2016 to get 24-hour profile with an input vector taken from real time readings uploaded by WRLDC, Mumbai on the web with an average 10% error in input vector to acknowledge load forecasting system.The forecast frequency profile is shown in Fig. 9 along with actual profile. Error encountered in this forecasting system considering instantaneous forecast is also shown in Fig. 8 [12].The reason behind this type of error plot is mainly due to the fact that the data sets used for the training consist of maximum number of sets belonging to that category or range of frequency which is close to rated frequency.
In other words, ANN is best trained to forecast the grid frequency when the actual frequency of the grid is its rated frequency.
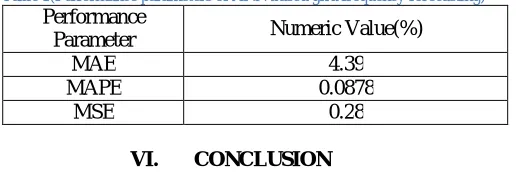
Table 1(Performance parameters of ANN based grid frequency forecasting)
Performance
Parameter Numeric Value(%)
MAE 4.39
MAPE 0.0878
MSE 0.28
VI. CONCLUSION
This paper represents the importance of frequency forecasting for the power grid and bring the frequency response of grid system in practical scenario. The grid is generalized to make a model that was reduced to get a frequency forecasting input vector of ANN. This approach is an elementary and effective way to forecast frequency at grid level. Although, system has fewlimitations and initial consideration over which further research is expected.
REFERENCES
[1] Shu Fan, KittipongMethaprayoon, Wei-Jen Lee, “Multiregion Load Forecasting For System With Large Geographical Area,”IEEE Trans.
Industry Application, Vol. 45, No. 4, pp. 1452-1458, July 2009.
[2] Allen J. Woods and Bruce F. Woolenberg,“PowerGeneration, Operation& Control”, (2nd Ed., NY, John Wiley & Sons Inc.), 1996. [3] Hadi Sadat, “Power System Analysis”,(2nd Ed., PSA Pub.,)2010.
[4] Xiaorong Sun, Peter B. Luh, Kwok W. Cheung,“An Efficient Approach To Short Term Load Forecasting At The Distribution Level”, IEEE
Trans. Power System, Vol. 31, No. 4, pp. 2526-2536, July 2016.
[5] S.K. Soone, S.C. Saxena,“Frequency Response Characteristics Of An Interconnected Power System-A Case Study Of Regional Grid In India”,
6thIntentional R&D Conference On Sustainable Development Of Water & Energy Resources-Needs And Challenges- 13-16 Feb 2007,
Lucknow, U.P., India.
[6] Henrique SteinherzHippert, Carlos Eduardo Pedreira and Reinaldo Castro Souza,“Neural Networks for Short-Term Load Forecasting: A
Review and Evaluation”, IEEE Trans, Power System, Vol. 16, No.1, pp. 44-55, Feb. 2001.
[7] G. Zhang, B.E. Patuwo and M.Y, Hu,“Forecasting With Artificial Neural Networks: The State Of Art”, Int. J. Forecast, Vol.14,pp. 35-62, 1998.
[8] CheGua, Peter B. Luh, Laurent D. Michel, Yuting Wang, Peter B. Friendland,“Very Short-Term Load Forecasting; Wavelet Neural Network
With Data Pre-Filtering”, IEEE Trans, Power System, Vol 28, No.1, pp. 30-41, Feb 2013.
[9] Jack M Zurada,“Introduction to Artificial Neural System”, (1st Ed, St. Paul, MN, West Pub. Comp.), 2006
[10] F.O. Karray, Carence De Silva,“Soft Computing And Intelligent System Design”, (1st Indian Ed., Noida U.P. IND, Pearson Edu.),2009 [11] S. Rajasekaran, G.A. Vijayalakshmi Pai,“Neural Networks, Fuzzy Logic And Genetic Algorithms; Synthesis And Application”(1st Ed., ND, PHI
Learning Private Ltd,) 2011
[12] Rajni kanth, G.V. Marutheswar,”Distribution system short term load and frequency forecast (STLFF) for optimal UI charges: A neural wavelet