ISSN 2286-4822 www.euacademic.org
Impact Factor: 3.4546 (UIF) DRJI Value: 5.9 (B+)
Labour Force Participation in Economic
Development: Coffee in Rwanda
RUTURWA S. DANIEL
PhD Research Scholar Department of Population Studies Annamalai University, India
Abstract:
Coffee production and labour force participation, both have been decreased and increased respectively during the same. This shows that at the same time the change of Labour Force implies the change of Coffee production quantity in the same direction and vice versa. The figure 1, shows the trends between coffee production and the Labour force participation. Due to, above multi results the researcher confirmed that the production of coffee dependent of labour force used.
Key words: Labour force, Coffee production, Economic Development, Rwanda
INTRODUCTION
Rwanda is a hilly and evergreen country located in East Africa, between the 1°04‟ and 2°51‟ Southern Latitudes and between the 28°53‟ and 30°53‟ Eastern Longitudes of the Equator. The climate of the country is temperate to subtropical, with two rainy seasons and two dry seasons each year. The shortest route to the Indian Ocean is 1,200 km long. Rwanda has an area of 26,338 km2 with an estimated population of about 11millions inhabitants. Arable land is estimated at 1, 3 million hectares. Labor force growth is determined by the native-born population, net immigration, and the labor force participation rate, which is the percentage of the working-age population (16+) working or looking for work. In Rwanda, the population is regarded as the major factor to consider when it comes to the nation existence both in terms of its economy development and inhabitants‟ life style. The Rwandan labour force increases national income through coffee agricultural production which led to the creation of local farms such as coffee agricultural industries.
development sectors of its economic growth, due to growing and cheap labour force.
According to the Dependency theorists argue that poor countries have sometimes experienced economic growth with little or no economic development initiatives; in the same context Rwanda has established initiatives to facilitate the enhancement of coffee sector, in order to generate foreign currencies through their exports. Therefore, encouraged foreign investors to come in and invest in above mentioned agricultural sectors, consequently, involve the overpopulation‟s labour force employment.
PROBLEM STATEMENT
This paper is based on of labour force participation in coffee agricultural development sector in Rwanda. Labour force is an important element of agricultural development. Nowadays, the main major and most pressing problems facing Rwanda is unemployed population. The increase of population in Rwanda remains a problem on its economic growth in the case that Rwanda‟s population is not involved mostly in agricultural development. According to this statement, rapid population growth has and will cause many social issues if the Rwandan government policies and strategies doesn‟t emphasize on this overpopulation involvement in modern intensive agricultural activities especially in coffee which plays a key role in export, generating foreign currencies. Additional clear policies and strategies must be taken by Rwanda‟s leaders in order to contribute drastically in the involvement of this overpopulation in improved agricultural development.
OBJECTIVES
growing population as labour force. The objectives of this paper are:
(1) examining the role of labour force in coffee agricultural development sector,
(2) Analyzing the labour force participation in economic development.
CONCEPTUAL FRAMEWORK OF LABOUR FORCE IN AGRICULTURE DEVELOPMENT
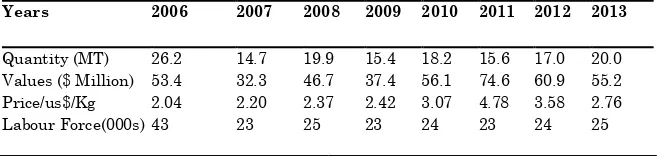
Population Theories suggest that an economy supports population (Malthus, 1803), but labour force too, in sense, boosts the economy. It is the aim of an economy to supply people‟s needs for foods and services, but the people too make an important participation to the productive capacity of an economy, the labour force in Rwandan economy has played a tangible role through coffee production (See Table 1).
larger number of people; and (b)innovation demand pulled, because larger population creates new needs and increases those already existing granting higher rewards for the innovator (Ahlburg 1998). The higher and probably more stable demand for consumption and investment goods is another positive effect of population growth that can lead to expansionary economic cycles.
The second group of scholars argue that declining population growth, fertility and mortality are conducive for economic growth and argue rather for the accumulation of qualified human capital an educated, skilled, and healthy population to be employed in the farm and non-farm sectors (e.g. Strulik, 2005; Barro, 2001), according to Malthus, population growth is supposed to decrease the per capita output, because output growth rate cannot keep the same pace. Preventive and positive checks on population growth are necessary to keep the natural balance between production especially food and consumption (Malthus 1826).
The ideas that lead current development interventions of this paper sit within the first school of thinking outlined above, which encourages population growth as source of labour force in pursuit of economic development.
DATA AND METHODS
Data
Table 1: Coffee production 2006-2013
Years 2006 2007 2008 2009 2010 2011 2012 2013
Quantity (MT) 26.2 14.7 19.9 15.4 18.2 15.6 17.0 20.0 Values ($ Million) 53.4 32.3 46.7 37.4 56.1 74.6 60.9 55.2 Price/us$/Kg 2.04 2.20 2.37 2.42 3.07 4.78 3.58 2.76 Labour Force(000s) 43 23 25 23 24 23 24 25
METHODS
The data used in this study was secondary and provided in coffee agricultural sectors, especially collected and used as material for analysis. The statistical tools methods have been used for analyzing the contribution of labour force in coffee agricultural sectors and it is used to examine its role in the agricultural development. It is focused essential on the relationship between the quantities productions due to the Labour force used in that production activity. Finally, software package social statistics (SPSS) was applied to interpret data and listing below finding results.
Descriptive Statistics
Table 2: Descriptive Statistics
Mean Std. Deviation N
Quantity(MT) 18.34 3.724 8
Labour Force(000s) 26.04 6.755 8
Values(US$ million) 52.07 13.353 8
Price(us$/Kg) 2.90 .909 8
Correlations Analysis
Table 3: Relationship between Dependent and Independent Variables (2006 - 2013)
Quantity(Kgs) Labour Force Values(US$) Price(us$/Kg) Quantity(Kgs) 1.000 .905 .143 -.413 Pearson Labour Force .905 1.000 .068 -.397 Correlation Values(US$) .143 .068 1.000 .838
Price(us$/Kg) -.413 -.397 .838 1.000
The table 3 presents the matrix of correlation in which the principal diagonal is presented by unit (1), and all elements of this matrix are symmetrical related from left side to right side of that diagonal and vice versa. The observation of elements of the above table explains or proves that there degrees of correlation between the chosen indicators are effectives and positives correlated. The Pearson‟s Coefficient of Correlation was found very high and approached to the unit with the value of R = 0.995. Therefore, the involvement of the Labour Force Participation in agricultural production of Coffee increase or improve the quantity production which consequently boost the money values and contribute to the country‟s Economic Development.
Regression Analysis
Table 4: Regression Analysis used
Model Coefficients Std. Error Coeff. Beta
t Sig.
(Constant) 12.152 .987 12.310 .000 Labour Force .154 .035 .279 4.344 .012 Values(US$) .353 .030 1.265 11.697 .000 Price(us$/Kg) -5.578 .481 -1.362 -11.587 .000
Dependent Variable: Quantity (MT), Predictors: (Constant), Labour Force, Values (US$), Price (us$/Kg)
According to the regression Methods, with the student‟s t - test by using software SPSS, we found that the values of t - statistics are (12.310, 4.344, 11.697 and -11.587) as showed in (Table4). At confidence level of 0.95, with the significance level of 0.05, for 7 degrees of freedom (DF=7), the critical value is (Tc = 2.36). Due to the values of t statistics which are highly significant as significant values for two -tailed tests which are also (0.000, 0.012, 0.000, and 0.000), (Table4). Therefore, we reject the null hypothesis (there is no relationship between Coffee Production and Labour Force Participation). Then, there is significant between the two variables and the statistical tests are said to be significant because p-values are all less than the significance level of (0.05). The Coffee Production depend of the Labour Force Participation. With regression, an estimation linear model is determine and could forecast the future Coffee production quantities in different years. The Estimated Model here is linear regression or bivariate called “Vector Auto regression” expressed as: Qt
LFP
t ut, with Qt, Coffee production quantity, LFPt, Labour force Participation,
is intercept,
as coefficient of Labour Force and ut is the error committed during model estimation. Table 4 gives the values of the constants (
12.152,
0.154 and ut 0 ). Estimated ModelAnalysis of Variance
Table 5: Analysis of Variances
Model Sum of Squares
df Mean
Square
F Sig.
Regression 96.610 3 32.203 262.783 .000b
Residual .490 4 .123
Total 97.100 7
D Dependent Variable: Quantity(MT), Predictors: (Constant), Labour Force, Values(US$), Price(us$/Kg
For more evidence, the table 5 shows the analysis of variances, for the numerator degrees of freedom (df1= 3) and the denominator degrees of freedom (df2 = 4), with the significance level o of (0.05), the F critical is (Fc=6.59), compare to F ratio calculated (Fcal = 262.783), the null hypothesis was rejected in favour of the alternative hypothesis, which is that there is significant relationship between Coffee production and Labour Force Participation. Again we say that Labour Force is an explanatory of Coffee production quantity. At level of significance of 0.05 the p-value is less than 0.05, (0.000< 0.05) (Table 5), there is significant relationship between LLabour Force Participation and the quantity produced for the Coffee production.
Relationship between Coffee Production and Labour Force Participation
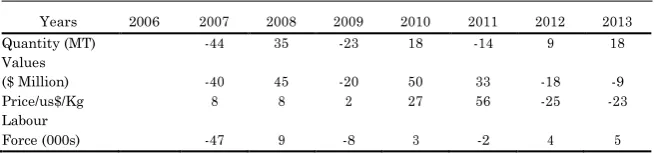
Table 6: Percentages of Variation of Indicators during the period of study (2006-2013)
Years 2006 2007 2008 2009 2010 2011 2012 2013 Quantity (MT) -44 35 -23 18 -14 9 18 Values
($ Million) -40 45 -20 50 33 -18 -9 Price/us$/Kg 8 8 2 27 56 -25 -23 Labour
MAJOR FINDINGS
According to results found, we can summarize some of them which ended at a good conclusion.
First: Student‟s t-test, shows that t-statistics (tcal=4.344) was greater than its critical value (tcri=2.36). This means that the null hypothesis is rejected and we conclude that there is significant relationship between Labour Force Participation and the Coffee quantity produced.
Second: The p-values for statistical tools such as regression analysis and analysis of variances are both respectively less than significance level of 0.05 (0.012<0.05) and (0.000<0.05) which confirm that there exist a positive relationship between the dependent and independent variables.
Third: According to the Analysis of Variances (ANOVA), the value of F ratio (Fcal = 262.783)is greater than F critical value with the degrees of numerator and denominator respectively equals to (dl1=3) and (dl2=4) of (Fcri = 6.59). This also confirm the existence of relationship which is significant between both variables (dependent and independent).
Fourth: The estimated Model: Qt =12.152 + 0.154LFPt, with Qt the quantity of Coffee produced. LFPt the labour force participation which elements help to forecast and make projection for different years and predict the quantity of Coffee productions.
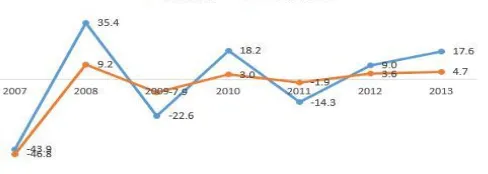
change of Labour Force implies the change of Coffee production quantity in the same direction and vice versa. The figure 1, shows the trends between coffee production and the Labour force participation.
Figure 1: Relationship between production and labour force
CONCLUSION
Labour force is one of the factors that has an important influence on the agricultural development. Based on finding results, the paper‟s output shows that labour force has direct impact on coffee agricultural sectors in Rwanda. It has been observed that whenever the labour force increased, it affects the production of coffee. Therefore, the results found above confirm that statement.
Acknowledgement
The author acknowledges valuable contributions in terms of data gathering from the research assistants BIGANIRO R.Guy, MUHOZA Caleb, and REMEZO Aimable.
REFERENCES
1. Abbot, P. (2011). Population Growth and Development: Report of the workshop and facilitated discussion. IPAR, Kigali, Rwanda.
2. Barlow, R. (1994). “Population Growth and Economic: Some More Correlations” Population and Development Review, 20(1):153-65.
3. Bevan, D. et al. 2003. Discussion Paper on Economic Growth, Investment, and Export Promotion. Kampala: MFPED.
4. Bizoza, R. A. and Havugimana, J.M.V. (2013). Land Use Consolidation in Rwanda: A case study of Nyanza District. International Journal of Sustainable Land Use and Urban Planning. ISSN 1927-8845 | Vol. 1 No. 1, pp. 64-75 (2013) 5. Coale AJ; Hoover EM Population growth and economic
development in low-income countries: a case study of India's prospects. Princeton, New Jersey, Princeton University Press, 1958. 389 p.
6. De Malque, D. and Verwimp, P. (2009). The demographic and socio-economic distribution of excess mortality during the 1994 Genocide in Rwanda. The World Bank Group, population policy research working paper 4580.USA.
7. Furuoka, Fumitaka (2009) “Population growth and economic development: New empirical evidence from Thailand” Economics Bulletin 29(1), 1-13
9. Minagri (2013). Strategic Plan for the Agricultural Transformation in Rwanda. Ministry of Agriculture and Animal Resources. Kigali, Rwanda.
10. NISR (2012). EICV3 Thematic Report- Economic Activity. National Institute of Statistics of Rwanda. Kigali, Rwanda. 11. Perotti, R. (1993) „Political equilibrium, income distribution, and growth‟, Review of Economic Studies, 60. 12. S. H. Ominde; C. N. Ejiogu and K. M. Barbour. Population
Growth and Economic Development in Africa. The Geographical Journal, Vol. 139, No. 1 (Feb., 1973), pp. 135-136.
13. Schultz, T. P. 1994. “Human Capital, Family Planning, and their Effects on Population Growth.” American Economic Review 84: 255-260
14. Strulik, H (2005). The Role of Human Capital and Population Growth in R&D based Models of Economic Growth. Review of International Economics, 13 (1): 129-145).
15. Dawson, D.J. and R. Tiffin (1998) “Is there a long-run relationship between population growth and living standard? The case of India” Journal of Development Studies 34(5), 149-156.