DOI: http://dx.doi.org/10.26483/ijarcs.v8i8.4852
Volume 8, No. 8, September-October 2017
International Journal of Advanced Research in Computer Science
RESEARCH PAPER
Available Online at www.ijarcs.info
ISSN No. 0976-5697
A PROPOSAL FOR PREDICTING MISSING VALUES IN A DATASET USING
SUPERVISED LEARNING
Shivani Rawal
M.tech Student
Department of CSE
PIET,Samalkha(India)
Dr. S.C Gupta
Professor
Department of CSE
PIET,Samalkha(India)
Mr. Shekhar Singh
Assistant Professor
Department of CSE
PIET,Samalkha(India)
Abstract: Missing values occur frequently in various field experiments and trials of data. These missing values in a dataset pose challenges for the data miners and analysts working on that dataset. Hence knowing how to predict those missing values is important. The process of replacing missing value with the predicted value is called Imputation. In this paper we propose an Imputation method to predict the missing values based on supervised learning classification scheme. The proposed method first maps the missing value problem into a classification problem by discretization of the known available values. Further we make use of C 4.5 decision tree algorithm for prediction of the discrete nominal values corresponding to the missing values. Finally we predict the numeric values for the missing places using Local Closet Fit algorithm where the term local is defined by the discretization of the known values of the attribute with missing values. The performance of the proposed method is compared with the existing schemes for data imputation where the results show that the proposed method has higher prediction accuracy.
Keywords: Dataset, Data mining, Imputation, Supervised Learning, Discretization, C 4.5 Algorithm, Local Closest Fit algorithm.
I.INTRODUCTION
Missing data in a data set refers to an instance wherein no data value is stored for the variable in the observation of interest. Various problems are faced with missing data while mining the dataset [1]. Firstly, the absence of data reduces the probability that the test will reject the null hypothesis when it is false since it does not have the complete data. Secondly the lost data causes bias in the estimation of parameters. Also missing values reduces the significance of the samples obtained. Hence, missing values makes the analysis of dataset highly complicated and leads to invalid conclusions several times.
Due to frequent occurrence of missing values in the training observation, prediction of the missing data has always remained at the center of attention of knowledge discovery in databases and data mining search community [2]. One could also think of discarding the instances with missing value but this would lead to loss of important information and inaccurate inference from about the data [3]. Hence prediction of missing data is a better choice than eliminating the instance as whole. A number of approaches for prediction of missing values have been devised over time. Some of these methods include concept mean method, k-means clustering [5], unsupervised learning [4], event covering, LEM2 [6] etc.
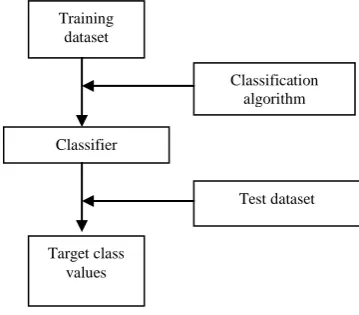
[image:1.595.336.516.521.678.2]The objective of this paper is to predict the missing value of an attribute using a supervised classification scheme. Classification is a data mining function that assigns items in a collection to target class [7]. It not only studies the sample data but also predicts the future behavior of that sample data. The classification process includes two phases represented as follows:
Fig. 1 Phases of a Supervised Classification Scheme
The first phase is the learning phase in which training data is analyzed and based on that analysis a classifier model is built as shown in figure 1. In the second phase the test set is evaluated on the developed classifier to predict the class values.
Training dataset
Classification algorithm
Classifier
Target class values
The rest of the paper is organised as follows: Section 2 includes the background study where we discuss various discretization approaches and classification techniques. In section 3, the proposed method for prediction of missing values for an attribute in a dataset is explained. Section 4 shows the results and analysis of the proposed algorithm on weka tool. Section 5 finally concludes the paper along with the future scope of research in the present study.
II. BACKGROUNDSTUDY
Prediction of missing values of an attribute in a data set using classification involves mapping the missing value problem into classification problem. This mapping in turns requires discretization of the continuous normal attributes. Then the so generated discrete normal attribute is used as the target or the class attribute in the classification.
A. Normal Distribution
The normal distribution can be specified completely by two parameters, which are Mean (µ) and Standard Deviation (σ). If the mean and the standard deviation are known then one essentially knows as much as if one had the entire data set. A quick estimate of the spread of data that follows the normal distribution is known as empirical rule [8] provided the mean and the standard deviation are known. It says that 68% of data lies within the first standard deviation of the mean, 95% of the data lie in two standard deviations of the mean where as almost 97% of the data will fall in three standard deviations of the mean.
B. Discretization
Discretization is a process of converting or partitioning continuous attributes to discrete or nominal attributes. Thus it transforms quantitative data into qualitative data. The discretization process consists of two steps [9]. First, number of discrete intervals is chosen either by some heuristic technique or by running multiple times with different number of intervals and deciding the best choice by using some criterion. Secondly, the cut points must be determined, which is often done by the discretization algorithm itself. Some of the popular discretization techniques are as follows:
i. Equal Interval Binning
This method of discretization divides the entire range into a predetermined number of equal intervals. Uneven distribution of data points is a drawback of this method as some intervals may contain much more data points than other. This can seriously impair the ability of the attribute for building good decision structures.
ii. Equal Frequency Binning
This method of discretization tries to overcome the limitations of the above discussed equal width binning
by dividing the domain into intervals with same number of data points. It works by obtaining the maximum and minimum values of the attribute and sorts all values (n) in increasing order. Further it divides the interval from min to max value into k intervals such that every interval contains the same number (n/k) of the sorted values.
Entropy based Discretization
Entropy based discretization hinges on two ideas. First, the data should be split into intervals that maximize the information, measured by entropy. Secondly, the partitioning should not be too fine grained to avoid refitting. Out of the all possible splitting values, it takes the one that generates the best gain and repeats in recursive fashion.
C. Classification
Classification is a data mining technique typically used to extract models describing important data classes. It helps in finding out in which group each data instance is related within a given dataset. This technique can also be used to predict categorical class labels for the test set provided the training set. Following are the existing prominent classification algorithms:
i. K- Nearest neighbour Algorithm:
K nearest neighbours [10] is a simple algorithm that stores all the available cases and classifies new classes based on similarity measure like distance function. An object is classified by the majority vote of its neighbours, with the object being assigned to the class most common amongst its K nearest neighbours where K is a small positive integer.
ii. ID3 Algorithm:
ID3 is an algorithm proposed by Ross Quinlan that generates decision trees which can be further used for classification problems. The algorithm starts with original set as the root hub [10]. It then chooses the attribute with the lowest entropy to split the set and produce subset of information. The algorithm then recurs on each and every item in the subset and considering only the items that were never selected before.
iii. C 4.5 Algorithm:
referred to as feature selection measure that is evaluated by entropy [10].
III.PROPOSEDMETHODOLOGY
Predicting missing values is generally considered to be a part of the data cleansing phase done before data mining or any further analysis. Our proposed method for prediction of missing values is restricted to a single attribute with numerical values. This method first maps the missing value problem into a classification problem using a proposed discretization algorithm based on normal distribution. Then the values are predicted using classification algorithm. The proposed method consists of three modules namely Discretization, Classification and Prediction.
A. Discretization:
The proposed Normal Distribution based discretization method consists of following steps:
Step 1: Take all the available instance of the attribute with the missing value.
Step 2: Find the maximum and minimum values for it. Step 3: Compute the Mean (µ) and Standard Deviation (σ). Step 4: Partition into k number of classes based on (µ) and (σ).
B. Classification:
The classification in our proposed method is done using the C 4.5 classification method that generates classifiers expressed as decision tree [11]. It is one of the best decision tree algorithms that can be easily interpreted and can deal with noise.
C. Prediction:
We use Local Closest Fit (LCF) approach [12] for performing the prediction of numerical value from the interval predicted by the trained classifier as output. The LCF algorithm works as follows: Suppose a dataset Dold having missing value in attribute ai is separated in two datasets F and M where in A is the class label then the pseudo code for LCF algorithm is given as:
For each instance X in M with X.class = A do
Compute the distance (X, Y) between X and every instance
X such that Y.class = A
MinInstance ← the instance with the minimum value of distance(X, Y)
X.ai← MinInstance.ai
End For
Where the value of distance(X, Y) is calculated as Xi-Yi divided by the difference of maximum and minimum values in that class (r).
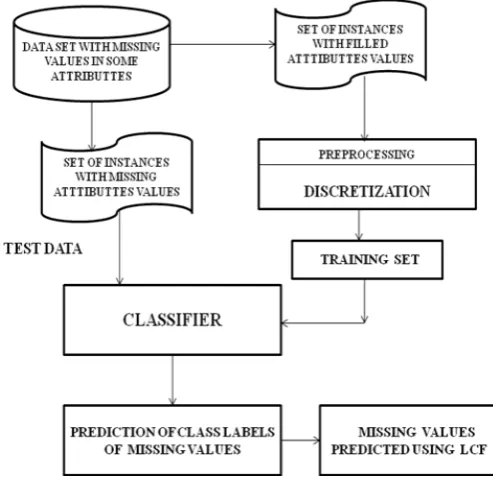
[image:3.595.318.565.55.298.2]Figure 2 represents the proposed prediction algorithm in terms of a flowchart as follows:
Fig. 2 Flow chart of proposed Prediction Scheme
We can briefly say that the proposed algorithm consists of following steps:
Step 1: Take the supplied data set Dold with missing values in the attribute ai.
Step 2: Split Dold into two datasets F (containing all filled instances) and M (containing all instances with missing attribute values).
Step 3: Discretize the attribute ai in F using normal distribution based discretization.
Step 4: Build a C 4.5 classifier by training the dataset F with nominal values of ai as the target class.
Step 5: Test the dataset M on the above classifier to predict the nominal values corresponding to the missing values. Step 6
: Use the Local Closet Fit algorithm to predict the numeric value corresponding to the nominal value of ai.
IV.RESULTS AND ANALYSIS
The proposed approach for predicting missing values has been tested with two different datasets which are Iris dataset (5 attributes and 150 instances), Shuffle dataset (9 attributes and 14500 instances). Before performing the analysis we first manually replace some of the values of a single attribute in these datasets with “?”. Then the instances having the “?” are separated from those without it resulting in the formation of a training data set F (with all filled instances) and a test data set M (containing all missing value instances).
A. Tool used: Weka
New Zealand. It provides extensive support for the whole process of experimental data mining, evaluating learning schemes statistically and visualizing results of learning algorithms.
B. Results
First we apply discretization to the entire range for a given attribute in K (where K=5, 7and 9) number of intervals (also called binning) as follows:
TABLE 1Cut points, Intervals and Class Labels for 5 bin Discretization
Cut Point (4)
Symbol (4) Interval (5) Class Label (5)
(µ - 3σ) A1 [min, A1) A
(µ - σ/2) A2 [A1, A2) B
(µ + σ/2) A3 [A2, A3) C
(µ + 3σ) A4 [A3, A4) D
- - [A4, max) E
From the above table it is clear that in a K bin analysis we get K discrete intervals and K-1 cut points.
After discretization of the known values of the missing attribute (subset F) we get a new class label corresponding to nominal values for that attribute. But for the missing value set (subset M) we don’t have any class label. So we build a classifier model using C 4.5 algorithm on training set F obtained after discretization with new class labels in weka. The classifier model so built is tested upon by the test set M to predict its new class labels. Next we replace the predicted class labels of the test set by a continuous numerical value. The prediction of this continuous numeric value is done by LCF technique following consecutive instance approach.
TABLE 2Actual value vs Predicted value for Iris Dataset
Attribute no Actual value CM value MCV value LCF value Proposed Method Predicted Value 5 Bins 7 Bins 9 Bins
1 4.8 5 5.1 4.9 4.8 4.9 4.9
2 3.4 3 3 3.1 3.4 3.5 3.5 3 4.8 5.5 5.1 4.9 4.9 4.9 4.7 4 2.5 2 1.8 2.4 2.4 2.3 2.6
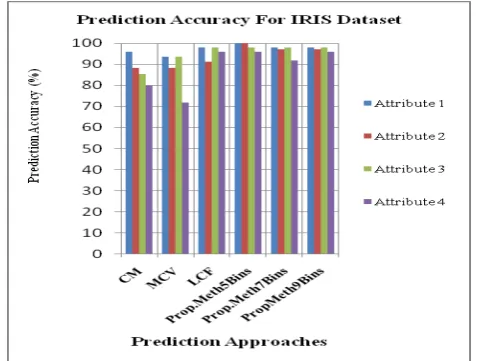
[image:4.595.315.559.65.191.2]Table 2 shows the comparison of actual value and the predicted value of an attribute using the existing concept mean (CM) method, most common value (MCV) method and the proposed prediction method with 5, 7 and 9 interval binning for Iris dataset.
Table 3 shows the comparison of average error in the prediction of missing values for the concept mean (CM) method, most common value (MCV) method and the proposed prediction method with 5, 7 and 9 interval binning for Iris dataset.
TABLE 3Average error in prediction for Iris Dataset
Attr ibute no CM error MCV error LCF error Proposed Method Prediction error 5 Bins 7 Bins 9 Bins 1
0.0416 0.0625 0.0208 0 0.02
08 0.02
08 2
0.1176 0.1176 0.0882 0 0.02
94 0.02
94 3
0.1458 0.0625 0.0208 0.02 08 0.02 08 0.02 08 4 0.2 0.28 0.04 0.04 0.08 0.04
Table 4 shows the comparison of the prediction accuracy percentage for the concept mean (CM) method, most common value (MCV) method and the proposed prediction method with 5, 7 and 9 interval binning for Iris dataset.
TABLE 4Comparison of Average Accuracy for Iris Dataset
A ttrib ute no CM Acc uracy % MCV Accuracy % LCF Accurac y % Proposed Method Prediction Accuracy %
5 Bins 7 Bins 9 Bins
1 95.83 93.75 97.91 100 97.9 1
97.9 1 2 88.23 88.23 91.17 100 97.0
5 97.0
5 3 85.41 93.75 97.91 97.91 97.9
1 97.9
1 4 80 72 96 96 92 96
From Table3, Table 4, it is clear that the proposed method provides better result in terms of average error of prediction and percentage prediction accuracy over the existing state of art methods for the Iris dataset. Also we observe that increasing number of intervals of discretization do not have any advantage to the prediction result at the cost of increase in computation time.
Furthermore comparing the accuracy of prediction of each attribute of the proposed method with different number of intervals of discretization, it is found that the proposed method with 5 Bins gives the better results for the prediction. Following figure 3 represents the obtained results for the Iris dataset in graphical form.
[image:4.595.318.557.577.757.2]Following Table 5 shows the comparison of actual value and the predicted value of an attribute using the existing concept mean (CM) method, most common value (MCV) method and the proposed prediction method with 5, 7 and 9 interval binning for Shuttle dataset.
TABLE 5Actual value vs Predicted value for Shuttle Dataset
Attribute no
Actual value
CM value
MCV value
LCF value
Proposed Method Predicted Value 5
Bins 7 Bins
9 Bins
1 57 44 37 58 57 58 56 3 77 106 106 95 77 77 77 5 34 20 20 27 34 34 36 7 40 69 69 58 40 40 40 9 16 4 4 8 16 16 14
Table 6 shows the comparison of average error in the prediction of missing values for the concept mean (CM) method, most common value (MCV) method and the proposed prediction method with 5, 7 and 9 interval binning for Shuttle dataset.
TABLE 6Average error in prediction for Shuttle Dataset
Attr ibute
no
CM error
MCV error
LCF error
Proposed Method Prediction
error 5 Bins
7 Bins
9 Bins
1 0.228070 0.350877 0.01754 0 0.01 7
0.01 7 3 0.376623 0.376623 0.23376 0 0 0 5 0.411764 0.411764 0.20588 0 0 0.05
88 7 0.725 0.725 0.45 0 0 0 9 0.75 0.75 0.5 0 0 0.12
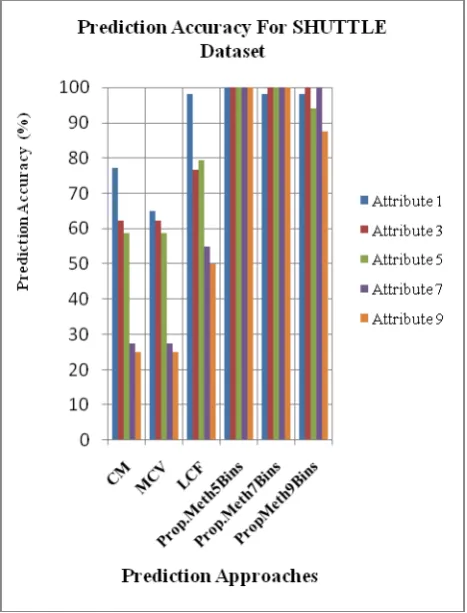
[image:5.595.35.280.155.268.2]Table 7 shows the comparison of the prediction accuracy percentage for the concept mean (CM) method, most common value (MCV) method and the proposed prediction method with 5, 7 and 9 interval binning for Shuttle dataset.
TABLE 7Comparison of Average Accuracy for Shuttle Dataset
Attri bute no
CM Accuracy %
MCV Accuracy %
LCF Accu racy %
Proposed Method Prediction Accuracy %
5 Bins
7 Bins
9 Bins
1 77.19 64.91 98.24 100 98.24 98.24 3 62.33 62.33 76.62 100 100 100 5 58.82 58.82 79.41 100 100 94.11 7 27.5 27.5 55 100 100 100 9 25 25 50 100 100 87.5
From Table 6, Table 7, it is clear that the proposed method provides better result in terms of average error of prediction and percentage prediction accuracy over the existing state of art methods for the Shuttle dataset. Also we observe that the proposed method with 5 Bins gives the better results for the prediction than with 7 or 9 Bins.
Following figure 4 represents the comparison of prediction accuracy for the concept mean (CM) method, most common value (MCV) method and the proposed prediction method with 5, 7 and 9 interval binning for the Shuttle dataset in graphical form.
Fig. 4 Comparison of Prediction Accuracy for Shuttle Dataset
V. CONCLUSIONANDFUTUREWORK
In this work, we proposed a method for prediction of missing values in a dataset based on classification scheme. The proposed method first maps the missing value problem into a classification problem by performing normal distribution based discretization of the known values of the missing attribute. Then it performs the prediction of the nominal value corresponding to the missing values using classification. Finally known prediction approaches are employed on the new data set to predict the values.
[image:5.595.37.282.380.506.2] [image:5.595.35.282.589.685.2]VI.REFERENCES
[1] D.J. Prajapati, J.H. Prajapati, “Handling Missing Values: Application to University Data Set”, Issue 1, Volume 1, ISSN 2249-6149, 2011
[2] A. Petrozillo and I. Jordanov, “Coulmn wise guided data imputation”, Elsevier B.V, 2017
[3] G. Ssali, T. Marwala, “Estimation of missing data using computational intelligence and decision trees”, Proceeding of IEEE International Joint Conference on Neural Networks, Hong Kong.
[4] D. Lam, M. Wei, D. Wunsh, “Clustering data of mixed categorical and numerical type with unsupervised feature learning”, IEEE, 2015
[5] S. Sugana, K.G. Thanushkodi, “Predicting missing values using K-means Clustering”, Journal of Computer Science, Issue 2, Volume 7, Pages 216-224, 2011
[6] J.W Busse, “MLEM2: A new algorithm for rule induction from imperfect data”, In proceedings of 9th International conference on Information Processing and Management of Uncertaininty in Knowledge Based Systems, Pages 243-250, 2002
[7] G. Ssali, T. Marwala, “Estimation of missing data using computational intelligence and decision trees”, Proceeding of IEEE International Joint Conference on Neural Networks, Hong Kong
[8] Web Link: Normal Distribution,
[9] https://en.wikipedia.org/wiki/Normal_Distribution
[10]K. Cios, W. Pedrycz, “Data Mining A Knowledge Discovery Approach”, Springer, 2007
[11]S.S Nikam, “A Comparative Study of Classification Techniques in Data Mining Algorithms”, Oriental Journal of Computer Science and Technology, ”, Issue 1, Volume 8, ISSN 0974-6471, 2015
[12]R. Kumar, R. Verma, “Classification Tree Algorithms”, International Journal of Innovations in Engineering and Technology, Issue 2, Volume 1, ISSN 2319-1058, 2012 [13]J. W Busse, L. K Goodwin, “ A Comparison of three closest
fit approaches to missing attribute values in preterm birth data”, International journal of Intelligent Systems, 2002 [14]I. H Witten, E. Frank, “ Data Mining: Practical Machine
Learning Tools and Techniques”, Second Edition, Morgan Kaufmann Publishers, 2005