2825
Comparative Study on Feature Extraction Approaches
of Man-Made Objects Extraction from Satellite Images
Sure.Venkata.Padmavathi Devi
1, D.Murugan
2,
T.Ganesh Kumar
3Research Scholar
1, Professor
2, Associate Professor
3Department of Computer Science and Engineering, Manonmaniam Sundarnar University,Tirunelveli, India 1,2 School of Computing, Galgotia’s University, Greater Noida, India3
Email: [email protected], [email protected], [email protected]
Abstract- This paper provides the comparison analysis of feature retrieving techniques for extracting man-made object (buildings) automatically from the given satellite images Retrieving features from satellite imagery is an important task prior to classify that images. When registered territories are grouped with land cover, the most important thing is to retrieve the image features. Usually, satellites have multiple groups, and perhaps there is a lot of information on abbreviations, and it is difficult to retrieve the main features of the image. Therefore, it is necessary to study methods regarding how to retrieve the important features from satellite imagery in very efficient manner. Among several feature extraction techniques, this paper investigates three feature retrieving methods such as First Order Features, Gray Level Co-Occurance Matrix (GLCM) and Local Binary Pattern (LBP). In this work initially the input satellite image is denoised by using the Wavelet Shrinkage Denoising approach. And then the Artificial Bee Colony (ABC) approaches are applied to the de-noised image to segment the vegetation and non vegetation areas and then extract the features from that affected area using First Order Features, GLCM and LBP Technique. Finally the retrieved features are given as input into the ELM classifier to get the building map and then the change detection process is applied. The experimental results shown that the LBP approach performs better than First Order Feature and GLCM.
Index Terms- Building Extraction; Vegetation; Non Vegetation; Wavelet Shrinkage; ABC; First Order; GLCM; LBP; ELM
1. INTRODUCTION
Building information plays a significant role in various applications, such as city and regional planning, transportation planning, population estimation and forecast, pollution analysis, and energy budget [1]. As a result of the acceleration of urban development, creating an automated approach to obtaining building information is essential for city planners.
With traditional photography, the building is pulled out manually by looking at expensive and time taken process because of stereo viewing approach. However, the automatic discovery of the building is difficult because of the complexity of the building and the roofing material [2].Therefore, the growth of automatic building retrieving approaches drew the interest of researchers in remote sensing field in current decades.
. Gruen introduced a semi-automated scheme and process for creating a building model with a build roof, which was deliberated by a stereo model by operator [3]. Some scholars took benefit of previous knowledge rather than manual measurements. For example, Fischer et. Al. introduced a model-based method for the automatic retrieving of buildings from the remote sensing images [4].
Ogawa et al. proposed a method which is based on map to get information about human-made objects from satellite imagery. [5]. regrettably, the current methods have always been a challenge to retrieve buildings. Occasionally, the current geographical information is not accurate and not in very detailed manner. In addition when the information is retrieved from the scanning map, the scanning process may produce some added errors [6].
With the enormous progression of image acquisition knowledge in remote sensing filed, several powerful tool such IKONOS and QuickBird is introduced to get high-quality satellite images. This technology has proven to be an effective option for aerial photography in many applications. Some scholars extracted the building parts from the given input remote sensing images using spectral information and building properties such as shape, tone, context, texture and shadow information. After that researchers are introduced edge detection approaches such canny and Hough transform on each extracted building parts[7,8].
2826 terrain data. So it provides new chances and limitation
for retrieving the building. Buildings can be found using the examination of the connection between the LiDAR points.
This concept is used by plane fitting [9] and region growing algorithms [10]. These two approaches are very useful methods for finding the roof of building which are taken from LiDAR datasets. Nevertheless, the majority of the building detection methods using only LiDAR datasets.These methods have general limitations of differentiating the features of vegetation and non vegetations parts. To overcome these drawbacks, high-quality images is used with LiDAR data. For example, Zhang K et al. included region based clustering and object-based classification approach to refine vegetation areas and then the LiDAR point cloud is evaluated to create a roof in the building region [11].
Similarly, Gunho et al. initially retrieved vegetation features from the images of LiDAR dataset and then extracted vegetation features are eliminated based on the NDVI which are extracted from the IKONOS images. [12]. To this end, remote observers have made tremendous progress in the development of building techniques, but the accuracy of the detected building regions has been minimized in the context of this program, especially for the accuracy of building detection with a specific purpose.
With the growth for automatic object recognition approaches, a variety of techniques have been introduced to retrieve the man-made objects from VHR images in the last few decades [13] - [15]. As we know, due to different roofing material, it is not easy to divide the building from the background by spectral- based classification approaches. In this situation, the usual shape and line segments of human-made buildings have been identified as the most obvious and apparent characteristics of recognition. Accepting the limitations of the building as a basic idea, a revision of the literature intended to retrieve buildings from VHR images was made.
Cote and Saeedi [16] have created a common framework between different angles and the development of various layouts to retrieve new buildings. Mayer [17] has evaluated the method of building detection with clear criteria, paying close attention to both models and strategies. In the meantime, Shufelt [18] has evaluated the performance of four building retrieving methods using a complete relative study and said that new techniques are needed to achieve better retrieving of buildings. More accurately, our research has shown that its associated work is often faced with weaknesses, which are basically due to the less effectiveness of the conventional line detection algorithms.
For example, Cui et al. [19] applied Hough transform (HT) method [20] to retrieve the building, but this approach has significant limitations in setting
parameters and execution time. Even though Burns developed a line segment scheme to navigate through a gradient direction and can lead to a slower execution time of the algorithm. This approach has problems with constructing a definite parameter and finds some positive buildings. The detection of buildings using burning algorithms is illustrated in [14].
Then, the paradoxical model, based on the principle of general understanding principle known as the Helmholtz principle. It was applied in [22] for enhancing the efficiency of burn algorithm and it found little false positives, but it is really a comprehensive algorithm. Consequently, an effective method of building detection approach by rapid and exact discovery of line segments from building parts is a possible way to avoid the general shortcomings of prolonged processes in these studies.
The rest of the article is structured as follows Section I contains the introduction of man-made object extraction and the related work of man-made object extraction methods. In Section II, the details of the methods which are involved in comparative analysis are depicted, including its design idea and practical implementation approach. In Section III, the performance of this comparative work is evaluated. Finally, conclusions are discussed in Section VI.
2. METHODOLOGY
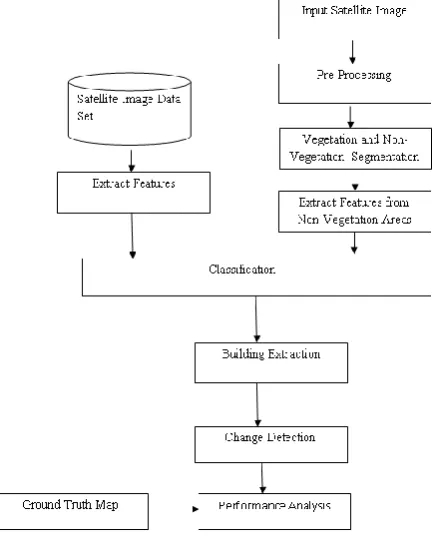
In this procedure, first the input satellite image is pre-processed. The schematic diagram of the comparative analysis of feature retrieving approaches is shown in Fig.1.In the segmentation step, the remote sensing image is partitioned into vegetation and non vegetation regions. After that, vegetation regions are eliminated and only non vegetation candidate regions are left. In the feature extraction step, multiple features are extracted to describe each non vegetation regions. Once the features are produced, the earlier trained classifier model is employed to classify the vegetation candidate regions into buildings. After that the change detection is done on the classified building images based on distance metrics. Finally, the retrieved results are evaluated and analysised by using the performance metrics. In the rest of the section the proposed method are explained in detailed manner. The proposed work is divided into five steps. They are
2827
2.1. Preprocessing
[image:3.595.76.294.336.610.2]This is the initial step of change detection of man-made objects. The change detection technique used in this work is depends on the retrieving of the borders of each building. The results of this process are highly based on the quality of the input satellite images. Noisy information in the satellite image is one of the great reasons to reduce accuracy of the detection of changes. Therefore, this work employs the speckle noise elimination technique. The typical speckle noise elimination technique is likely to produce blurring effect onto the image. Especially the edges are smooth and the high insulation shot is removed. Because these two features are very important, Pizurica has proposed a method of reducing speckle noise based on the wavelet shrinkage. The idea is to calculate the statistical distribution of the wavelet coefficients which indicating the noise and the useful edge representation.
Fig. 1. Overall Flow Diagram of Classification Methods
2.2. Segmentation
This is the next step of the change detection of man-made objects. After completing the pre-processing step the vegetation and non- vegetation area are need to be divided from the pre-processed image to detect the rough location of the buildings. To do this work, the segmentation approaches are used. Among several
segmentation approaches this chapters only deals with the Artificial Bee Colony approach.
2.2.1 Artificial Bee Colony Clustering
ABC was first developed by Dervis Carabaga under the motivation of cooperative activities of honey bees with better performance in functional efficiency. There are three key elements of the ABC optimization model for selecting a source of food that leads to a common understanding of cooperative cleverness of bees colony: sources of food, employee bees and unemployed bees.
ABC Algorithm
1) First obtain the subsets. Take the each subsets as the initial food sources 2) Repeat
3) Launch the employee bee onto the food sources and find out their nectar amounts 4) Compute the probability value of the sources
with which they are chosen by the onlooker bees
5) Launch the onlooker bees onto the food sources and calculate their nectar amounts 6) Discontinue the exploitation procedure of the
sources exhausted by the bees
7) Dispatch the scouts into the search area for finding the new food sources, arbitrarily 8) Store the best food source found up to now 9) Until the requirements are met
2.3. Feature Extraction
This is the third step of the proposed work. After completing the segmentation step the vegetation and non-vegetation area are divided from the pre-processed image and it gives the location of the non- vegetation objects. From that, it is necessary to find the accurate location of the buildings. Then only we find the changes. To do this work, the feature extraction approaches are used. Among several feature extraction approaches this paper only deals with First Order Features, GLCM and LBP.
2.3.1 First Order Features
The first level feature retriever specifies the retrieving of features by First-Order Statistics based techniques (FOS). It depends on One dimensional probability density function on the occasion of pixels between pair of gray level were considered as the technical features. The non vegetation region is extracted from the segmented image and then the four first order features are calculated. The features such as Standard Deviation, Mean, Skewness, and Entropy were computed from the non vegetation region of the segmented image.
Mean ̅= ∑ ∑ (1)
2828 Skewness = ∑
(3)
Entropy = (∑ ∑
∑ ∑
) (4)
2.3.2 GLCM
The texture information of the satellite image is formed by the alternation of the gray scale value in the spatial position, so there is a certain spatial relationship between the two pixels separated by a certain distance in the image. It is a proper way to express the texture by learning the spatial correlation of gray scale. The gray level co-occurrence matrix (GLCM) is a familiar technique for representing the spatial correlation of the pixel grayscale image. It mainly describes the image from the interval of adjacent pixels, direction and the extent of variation. Its essence is to count the occurrence frequency of two pixels of grayscale in a certain spatial relationship, which can represent the regional consistency and relativity in the image. GLCM changes rapidly in the fine texture as the distance changes, whereas the coarse texture changes slowly. The GLCM describes a square matrix whose size corresponds to the possibility of the gray value g1 distanced from a preset spatial position association (size and direction) to another gray value g2.
2.3.3 Local Binary Pattern
The local binary pattern (LBP) is one of texture feature retrieving operator. This method was developed for computing the local contrast value of image. In this method the feature value is retrieved by using the comparing the contrast value of eight pixel with the current pixel value based on threshold. And then LBP code is generated for a current pixel by multiplying the thresholded values with weights specified to the corresponding pixels values, and summing up the resultant values. This feature retrieving operator was, is invariant to image rotation operation and this operator was enhanced by an independent measure of local contrast.
LBP Algorithm
Apply the below steps for all pixel in an input image 1. Get the adjacent pixels of current pixel based
on the pixel Distance
2. Then compare the current pixel with that the neighboring pixels
3. If the color value of current pixel is larger than the neighboring pixel put the value 1 4. Else put the value 0
5. Then convert these binary number into the decimal value
This decimal value is termed as local binary pattern description.
2.4. Classification
This is the fourth step of the proposed work. Only feature retrieving step is not enough for detecting the exact location of the building from the given pre-processed satellite image. After extracting the features, it must be passed onto the classification approaches then only it gives the accurate location of the buildings. Among several classification approaches this chapters only deals with the Extreme Learning Machine approach.
2.4.1 ELM – Extreme Learning Machine
ELM is one of the classifier techniques in feed forward networks but the hidden layers of ELM do not require to be tuned. Such feed forward networks contain but are not restricted to support vector machine, polynomial network, RBF networks, and the conventional feed forward neural networks. Diverse from the tenet in neural networks that all the hidden nodes in feed forward networks require to be tuned, ELM approach illustrates that the hidden nodes of generalized feed forward networks does not require to be tuned and these hidden nodes can be randomly selected. In the training sets, the parameters of all the hidden node are independent from the target functions. All the parameters of ELMs can be logically confirmed rather than being tuned.
ELM Algorithm
In a training set = {
, activation function u, and the no of hidden
nodes P,
Allocate arbitrarily input weight vectors or centers
w, i= 1 , ….. , R.
Detect the hidden layer output matrix B. Detect the output weight =
B+ is the generalized inverse of hidden layer output matrix B by using Moore-Penrose.
B+ = (BDB)-1BD (5)
3. RESULT AND DISCUSSION
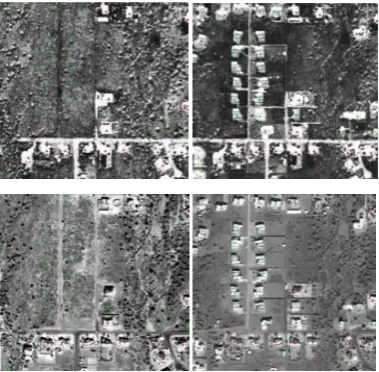
3.1 Experimental Images
2829 Fig. 2. Experimental Images
3.2 Performance Metrics
To analysis the performance of the change detection techniques of man-made objects, several performance metrics are available. This chapter uses the Detection Accuracy, Precision Rate, Recall Rate, Error Rate and F-Measure to analyses the performance. 3.2.1 Detection Accuracy
Detection Accuracy is the measurement system, which measure the degree of closeness of measurement between the original detected buildings and the detected buildings by the change detection method.
Accuracy= (TP+TN)/(TP+FP+TN+FN) (5) Where, TP – True Positive (building regions that are identified as building)
FN – False Negative (building regions that are identified as non-building)
TN – True Negative (non-building regions that are identified as non-building)
FP – False Positive (non-building regions that are identified as buildings)
3.2.2 Error Rate
Error Rate is the measurement system, which measure no of falsely detected buildings form the given input satellite images.
(6)
3.3 Result and Analysis
To analysis the performance of the classifier system, it is compared with various techniques by using the performance metrics which are mentioned above. This is shown in the below tables and graphs.
In this experiment, this work will analysis the contribution of each type of feature extraction approaches in the finding the change of building task. This experiment take First Order, GLCM and LBP are the segmentation approaches. For classifier, this experiment uses the ELM approach as the classifier. Among five performance metrics this experiment takes only detection accuracy and error rate as the performance metric. In table 3.8 shows the detection accuracy analysis of the First Order, GLCM and LBP.
Table 1. Detection Accuracy Analysis for Feature Extraction Method
[image:5.595.303.570.451.611.2]From the table 1 it is concluded that the detection accuracy value of the LBP method is larger than the other two approaches. So the LBP method is best than the other two approaches. The graph of detection accuracy analysis is shown in Fig.3.
Fig. 3. Detection Accuracy Analysis of Feature Extraction Method
From the Figure 3, it is concluded that the detection accuracy value of the LBP method is larger than the other two approaches. So the LBP method is best than the other two approaches.
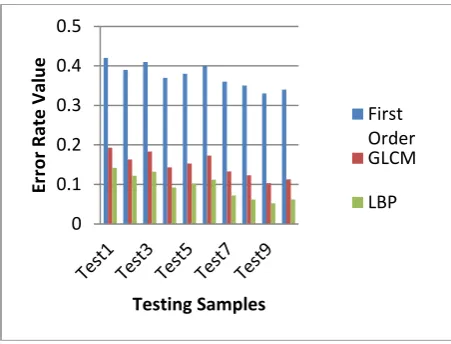
Table 2. Error Rate Analysis for Feature Extraction Method
0 0.2 0.4 0.6 0.8 1
Te
st1
Te
st2
Te
st3
Te
st4
Te
st5
Te
st6
Te
st7
Te
st8
Te
st9
Te
st10
A
cc
u
rac
y Value
Testing Samples
First Order
GLCM
LBP
Test Data First Order
GLCM LBP
2830 From the table 2 it is concluded that the error rate
[image:6.595.73.299.179.351.2]value of the LBP method is lesser than the other two approaches. So the LBP method is best than the other two approaches. The graph of detection error rate analysis is shown in Fig.4.
Fig. 4. Error Rate Analysis of Feature Extraction Method
From the Fig. 4 it is concluded that the error rate value of the LBP method is lesser than the other two approaches. So the LBP method is best than the other two approaches.
4. CONCLUSION
In this chapter the change detection techniques of man-made objects of urban areas are taken for the comparison. The comparison is done on feature extraction steps of the building extraction work. This work utilized three feature extraction methods, namely, First Order, GLCM and LBP for comparison process. As shown in Table 1, LBP obtain an overall accuracy 90%. So the results indicate that LBP approach performs well for change detection of man-made objects. So these three approaches such as ABC, LBP and ELM are used for development of new automated technique of change detection in man- made objects.
REFERENCES
[1] Gruen A,Nevatia R. Automatic building extraction from aerial images. Computer Vision and Image Understanding,Vol.72, pp. 99- 100,1998.
[2] Mayunga SD,Zhang Y,Coleman DJ. Semi-automatic building extraction utilizing QuickBird imagery. CMRT05 : International Archives of
Photogrammetry and Remote Sensing (IAPRS),
Vienna ,2005
[3] Gruen A. TOBAGO - a semi-automated approach for the generation of 3-D building models. Vol. 53, pp. 108-118, 1998..
[4] Fischer A,Kolbe TH,Lang F,et al. Extracting buildings from aerial images using hierarchical aggregation in 2D and 3D. Computer Vision and Image Unerstanding,Vol. 72, pp. 185-203,1998. [5] Ogawa Y,Iwamura K,Kakumoto S. Extracting object information from aerial images: A map-based approach. IEICE Trans. Inf. Syst., Vol. E83-D(7), pp. 1450-1457, 2000.
[6] Baltsavias EP. Object extraction and revision by image analysis using existing geodata and knowledge: current status and steps towards operational systems. ISPRS Jouranl of Photogrammetry & Remote Sensing,Vol. 58, pp. 129-151, 2004.
[7] Wei Yanfeng , Zhao Zhongming , and Song Jianghong. Urban building extraction from high-resolution satellite panchromatic image using clustering and edge detection. IGARSS '04:
Geoscience and Remote Sensing Symposium, Alaska,2004.
[8] Liu ZJ , Wang J , Liu WP. Building Extraction from High Resolution Imagery based on Multi-scale Object Oriented Classification and Probabilistic Hough Transform. IGARSS '05: Geoscience and Remote Sensing Symposium,
Seoul,2005
[9] Nardinocchi C,Scaioni M,Forlani G. Building extraction from LiDAR data. IEEE/ISPRS Joint Workshop on Remote Sensing and Data Fusion over Urban Areas,Rome,2001
[10] Stefan A , Stefan H. Automatic extraction of salient geometric entities from LiDAR point clouds. I GARSS '07:Geoscience and Remote Sensing Symposium,Barcelone,2007
0 0.1 0.2 0.3 0.4 0.5
Er
ro
r
R
ate
Value
Testing Samples
First Order GLCM
LBP
Test Data First Order
GLCM LBP
2831 [11] Zhang K.,Yan J.,Chen S. Automatic Construction
of Building Footprints From Airborne LIDAR Data. IEEE Transactions on Geoscience and Remote Sensing, Vol. 44, pp. 2523-2533, 2006. [12] Sohn G,Dowman I. Data fusion of
high-resolution satellite imagery and LiDAR data for automatic building extraction. ISPRS Journal of Photogrammetry & Remote Sensing,Vol. 62, pp. 43-63,2007.
[13]S. Noronha and R. Nevatia, ―Detection and modeling of buildings frommultiple aerial images,‖ IEEE Trans. Pattern Anal. Mach. Intell., vol. 23,no. 5, pp. 501–518, May 2001.
[14]M. Izadi and P. Saeedi, ―Three-dimensional polygonal building modelestimation from single satellite images,‖ IEEE Trans. Geosci. RemoteSens., vol. 50, no. 6, pp. 2254–2272, Jun. 2012.
[15]A. O. Ok, ―Automated detection of buildings from single VHR mul-tispectral images using shadow information and graph cuts,‖ ISPRS J.Photogramm. Remote Sens., vol. 86, pp. 21–40, Dec. 2013.
[16]M. Cote and P. Saeedi, ―Automatic rooftop extraction in nadir aerialimagery of suburban regions using corners and variational level set evo-lution,‖ IEEE Trans. Geosci. Remote Sens., vol. 51, no. 1, pp. 313–328,Jan. 2013.
[17]H. Mayer, ―Automatic object extraction from aerial imagery—A surveyfocusing on buildings,‖ Comput. Vis. Image Understand., vol. 74, no. 2,pp. 138–149, May 1999.
[18]J. A. Shufelt, ―Performance evaluation and analysis of monocular buildingextraction from aerial imagery,‖ IEEE Trans. Pattern Anal. Mach. Intell.,vol. 21, no. 4, pp. 311–326, Apr. 1999. [19]S. Y. Cui, Q. Yan, and P. Reinartz, ―Complex
building description andextraction based on Hough transformation and cycle detection,‖ RemoteSens. Lett., vol. 3, no. 2, pp. 151–159, Mar. 2012.
[20]D. H. Ballard, ―Generalizing the Hough transform to detect arbitraryshapes,‖ Pattern Recognit., vol. 13, no. 2, pp. 111–122, 1981.[12] J. B. Burns, A. R. Hanson, and E. M. Riseman, ―Extracting straight lines,‖ IEEE Trans. Pattern Anal. Mach. Intell., vol. PAMI-8, no. 4, pp. 425–455,Jul. 1986. [21] A. Desolneux, L. Moisan, and J.-M. Morel, ―Meaningful alignments,‖ Int. J. Comput. Vis., vol. 40, no. 1, pp. 7–23, Oct. 2000.
Authors Profile
Sure Venkata Padmavathi Devi received Master of Computer Science from Andhra University in the year 1999. She had completed her Master of Technology in Computer Science and Engineering from Dr MGR Educational and Research Institute, Chennai in 2006. She is currently pursuing PhD at Manonmaniam Sundaranar University, Tirunelveli and currently working as Assistant
Professor in the Department of Computer Science and Engineering, Narayanaguru College of Engineering, since 2013. She has 15 years of teaching experience.
D.Murugan is a Professor at Manonmaniam Sundaranar University, India. He received a bachelor degree in Electronics and Communication from Madurai Kamaraj University and master’s degree in Computer Science and Engineering from Madurai Kamaraj University, India. He Completed his PhD in Computer Science and Engineering from M.S University, India. He has 25 years of teaching
experience and has 10 years research experience and published more than 50 papers. His area of expertise in Face Recognization
T.Ganesh Kumar received his Master of Engineering in Computer Science and Engineering at Manonmaniam Sundaranar University in the year 2010. He has completed Fulltime PhD in Computer Science and Engineering in Department of Computer Science and Engineering, Manonmaniam Sundaranar University, Tirunelveli in the year 2016. Currently, He