Volume 3, No. 1, Jan-Feb 2012
International Journal of Advanced Research in Computer Science
RESEARCH PAPER
Available Online at www.ijarcs.info
ISSN No. 0976-5697
Association Rules Mining Using Majority Voting in the Stock Data
Mukesh Kumar *and Arvind Kalia
Dept. of Computer Sciences
Himachal Pradesh University, Shimla, INDIA [email protected]*, [email protected]
Abstract:A time series data set consists of sequence of values or events that change with time. Stock data mining plays an important role to visualize the behavior of financial market. Every investor wants to know or predict the trends of the stock trading. Association rule mining algorithms can be used to discover all item associations (or rules) in a dataset that satisfy user-specified constraints, i.e. minimum support and minimum confidence. The traditional association analysis is intra-transactional because it concerns items within the same transaction. Patterns are evaluated in this paper by means of generating association rules with a majority voting approach. The rules having the same consequent and higher voting are picked up to determine the stock pattern. The experimental results demonstrate notable similar pattern as well as categorization of stocks. The pattern so generated helps investors to build their portfolio and use these patterns to learn more about investment planning and financial market.
Keywords: Stocks data mining, association rules, majority voting
I. INTRODUCTION
Data mining has drawn the attention of the research and business sector for more than a decade now, since it has provided decision makers with a set of powerful tools to exploit very large amounts of data. Data mining tools employ a number of methods mainly from statistics, artificial intelligence, machine learning and database technology, in order to produce predictive or descriptive models of the data. Association rules mining is an important subject in the study of data mining. This problem was introduced in [1] in 1993, since then, it has been widely used in business, scientific research and management of enterprise, etc. Many researchers have studied the mining of one dimensional boolean association rules, multi-level association rules, multi-dimensional association rules and sequential patterns, but the traditional association rules are mainly concerned about the rules within same transaction or same sequence, the intra-transactional association rules.
A time series data set consists of sequences of values or events that change with time. Time series data is popular in many applications, such as the daily closing prices of a share in a stock market, the daily temperature value recorded at equal time intervals, and so on. According to the number of involved time series, the association rules mining problem can be divided into two categories as association rules mining from single series and that from a multiple series. The association rules mining problem from single series can be viewed as the mining problem of sequential pattern. If the values of different series were taken at same time as a transaction, the association rules mining problem from multiple series can be divided into two types: intra-transactional association rules mining, and inter-transactional association rules mining. The traditional association analysis is intra-transactional because it concerns items within the same transaction. Intertransactional association rules comprise a new kind of association rules that associate items within a window of many transactions. In that sense, intra-transactional rules are a subset of the inter-transactional ones.
The stock market provides an area in which large
volumes of data is created and stored on a daily basis, and hence an ideal dataset for applying data mining techniques [1, 4, 7]. The data mining can be applied to discover the interesting behavior within a time series or the relationship among a set of time series so that investors can collect more useful information from the already available but huge amount of data [7, 13]. For example, looking for repetitive patterns in a stock time series can be very useful for stock investors. In this paper, a pattern-based stock data mining problem is considered. Two different types of the problem are considered, namely, intra-stock pattern mining and inter-stock pattern mining. Intra-inter-stock pattern mining concerns with the discovery of repetitive temporal association patterns for the stock itself across a time span, may be a week or a month.
The inter-stock pattern mining picks several stocks and finds the relationship (association) among them. Inter-stock mining can be used to find the non-sequential association of stock symbols/patterns within a trading interval (e.g. the same trading day) may be within a day or a week. With such formulation, the inter relationship of stocks from different sectors can be studied. Intra stock pattern mining of a stock SBI is shown in Fig. I. It is represented by a candlestick daily chart, where a price movement of a single day is represented by a candle.. A big candle represents an abnormal movement in the prices of that stock. In Jan 2008 there was a fall of Rs. 2100 to 1700 in SBI stock and a big price fluctuation on a single day followed by a rally.
In this paper, patterns are evaluated by means of generating association rules with a majority voting approach. The rules having the same consequent and higher voting are picked up to determine the stock pattern. By identifying individual stocks in a generated pattern and their similar behavior or category, one can build its portfolio to have better returns. One can gain insight into the underlying pattern, which is helpful in further analysis, such as stock market forecasting. The experimental results demonstrate notable similar pattern as well as categorization of stocks.
II. RELATED WORKS
Event prediction is very similar to time series prediction. Classical time series prediction, which has been studied extensively within the field of statistics, involves predicting the next n successive observations from a history of past observations [3]. These statistical techniques involve the building of mathematical probabilistic models, which are based on specific data, since they are strongly dependent on various theoretical assumptions regarding the underlying nature of variation (probability distributions etc). The main goal is not to build certain mathematical models, but to discover patterns and rules, which are related to certain critical events and which are going to provide us an alarm for the early identification of such events. Financial data are conventionally represented in numeric format for data mining purpose. However, recent works have demonstrated promising results of representing financial data symbolically. It was argued [9, 12] that symbolic relational data mining is more suitable in incorporating background knowledge.
[image:2.595.322.554.64.327.2]Sequential and non-sequential association rule mining were used to perform intra and inter-stock pattern mining [11, 14, 15], where each stock is represented symbolically based on its performance with respect to a user-defined threshold. In [4], the authors apply significance testing to associations, essentially searching for correlation using a chi- squared test. Another approach involves sampling [16], in which a subset of the dataset is analyzed for likely associations. These associations from the sample are then verified in the complete dataset. However, the predictive power of sequential association rules is questionable. Sequence analysis or sequential pattern mining was extensively studied initially by Aggarwal et al. [1], where the notions of sequence and subsequence were defined. .
III. METHODOLOGY
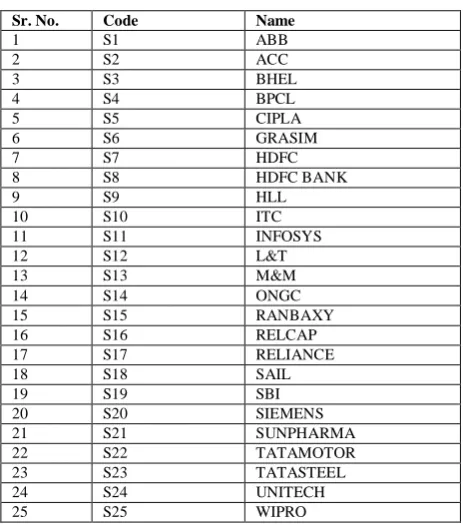
For the purpose of this study, we used the stock dataset of thirteen years period i.e. from Jan. 1996 to Dec.2008 of NSE stock exchange that amounted to 3 2 5 2 days [17]. The trading of the stock market within a day was recorded in a single text file. Each line represented the trading information of a stock. The thirteen year data was divided into thirteen classes. The 25 stocks were selected for this purpose. A list of stocks selected for data mining was presented in Table 1.
Table 1 List of stocks
Sr. No. Code Name
1 S1 ABB
2 S2 ACC
3 S3 BHEL
4 S4 BPCL
5 S5 CIPLA
6 S6 GRASIM
7 S7 HDFC
8 S8 HDFC BANK
9 S9 HLL
10 S10 ITC
11 S11 INFOSYS
12 S12 L&T
13 S13 M&M
14 S14 ONGC
15 S15 RANBAXY
16 S16 RELCAP
17 S17 RELIANCE
18 S18 SAIL
19 S19 SBI
20 S20 SIEMENS
21 S21 SUNPHARMA
22 S22 TATAMOTOR
23 S23 TATASTEEL
24 S24 UNITECH
25 S25 WIPRO
In a time series data, it was represented as symbols (item units) instead of data points, interesting patterns can be discovered and it became an easier task to mine them [5, 7]. Thus, it was emphasized to convert the basic unit into symbols, i.e., numeric-to-symbolic conversion. The numeric-to-symbolic conversion transformed the available features (e.g. Open, High, Low, Close prices) of a financial instrument into a string of symbols. In other words, the numeric data sequences from each stock time series were interpreted and a unique symbol was then used to label them individually. Such a conversion process can be extended to granulate the numerical data into different time granularities and it provided a large collection of symbol strings at various time granularities, which can then be used for different applications.
First of all the numeric representation of the data was converted to symbolic one. For symbolic representation use of the Open, High, Low and Close prices was made to carry out the numeric-to-symbolic conversion [9]. Here, one of the challenges being faced was to determine an appropriate number of symbols that was representative and also flexible enough for different time series. If the number of symbols is too many, then the occurrence of each symbol would be infrequent, making the mining process and the subsequent prediction task difficult. Even the rule can be generated with highest confidence, say 100%, the pattern may not happen again and hence the rule was useless. On the other hand, if the number of symbols were too few, the support of each symbol would be increased but the confidence may not be higher enough and the interestingness of the mined rules is questionable.
Symbol Definition
up (close-open)/close> threshold
down (open-close)/close> threshold
neutral (close-open)/close>= threshold
E.g., for open=100, close=101.25 and threshold=1%, a up feature value will be generated.
for open=100, close=98.9 and threshold=1%, a down feature value will be generated.
for open=100, close=99.3 and threshold=1%, a neutral feature value will be generated .
The Threshold was a user-defined parameter.
A. Association Rules:
The association rules were being generated for each year for discovering inter stock pattern. Many association rules were generated but only top twenty association rules were considered. The minimum Confidence for association Rules was taken 70 and minimum support level for them was taken as .15. To express simply and clearly, first the meaning of the formula, ―Stock A -> Stock B‖ was explained. In the mined rules, Stock A was called antecedent and Stock B was called as consequent. The interpretation of the mined rule was as, those who purchase Stock A are likely to purchase Stock B with the possibility of confidence, and Stock B is the frequent partner (FP) stock of Stock A.
First the association rules were generated for each year and then those were being used to classify the stock price movements. The problem was not straightforward and some issues need to be resolved. For example,
a. Which rule or set of rules should be selected for making prediction?
b. If the consequents of the selected rules are different from each other, which one(s) should be adopted? c. How to combine the predictions from multiple rules
and generate the final prediction?
[image:3.595.316.562.52.209.2]In this paper, Majority Voting [15] was used to determine the effectiveness of the mined rules and on the basis of this approach the consequent was chosen and its accuracy is determined. The thirteen tables of association rules were generated. Because of limited space one table was shown with all association rules with a minimum specified confidence and a consolidated table was prepared of all the thirteen years are on the basis of two classification strategies consequent was decided. Maximum 20 association rules were taken for the study with minimum selected confidence. In some cases more rules were generated while in some cases, few rules were generated but for the sake of clarity, maximum 20 rules were considered.
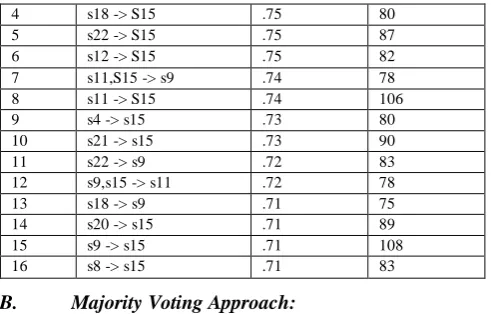
Table 2 Association Rules for year 1996
Rules Association Rules Confidence Instances
1 s9,s11 -> S15 .79 78
2 s3 -> S15 .77 77
3 s13 -> S15 .76 78
4 s18 -> S15 .75 80
5 s22 -> S15 .75 87
6 s12 -> S15 .75 82
7 s11,S15 -> s9 .74 78
8 s11 -> S15 .74 106
9 s4 -> s15 .73 80
10 s21 -> s15 .73 90
11 s22 -> s9 .72 83
12 s9,s15 -> s11 .72 78
13 s18 -> s9 .71 75
14 s20 -> s15 .71 89
15 s9 -> s15 .71 108
16 s8 -> s15 .71 83
B. Majority Voting Approach:
In the best confidence approach, the rule with the highest confidence among all the mined rules matching the fact of the testing data was selected for classifying the testing data. Generally speaking, higher confidence should yield better prediction. Majority voting was perhaps the most typical choice and was adopted here. With the example shown in Table 2, the mined rules, with any window size, which matched with the antecedent of the testing data sequence, would be selected. There were sixteen rules here and according to our majority approach the classification result should be ―S15‖. It was because majority vote for ―S15‖ is 78 + 77 + 78 + 80 + 87 +82 + 106 + 80 + 90 +89 + 108 + 83 = 1038 , majority vote for ―S9 ‖ is 78 + 83 + 75 = 236, whereas majority vote of S11 is 78.
IV. EXPERIMENTAL RESULTS
On the basis of TABLE 1 such thirteen tables were generated. The consequent with highest voting value was presented in the tables year wise. In the mined rules the antecedent may comprise of single stock, two stocks or three stocks. Not more than three stocks were picked in any tables, thereby indicating a maximum itemsets of size 3.
Table 3 Single Consequent with Highest Majority for Year 1996
Rules Association Rules Confidence Instances
1 S9,S11 -> S15 .79 78
2 S3 -> S15 .77 77
3 S13 -> S15 .76 78
4 S18 -> S15 .75 80
5 S22 -> S15 .75 87
6 S12 -> S15 .75 82
7 S11 -> S15 .74 106
8 S4 -> S15 .73 80
9 S21 -> S15 .73 90
10 S20 -> S15 .71 89
11 S9 -> S15 .71 108
12 S8 -> S15 .71 83
Table 4 Single Consequent with Highest Majority for Year 1997
Rules Association Rules Confidence Instances
1 S25 -> S15 .80 64
2 S7,s12 -> S15 .79 49
3 s16,s23 -> S15 .78 56
4 S7,s9 -> S15 .78 49
5 S9 -> S15 .76 86
6 s19 -> S15 .75 54
7 S7,s21 -> S15 .75 50
8 S16 -> s15 .74 67
[image:3.595.53.266.54.105.2]In the first two years, the same consequent was generated which indicates that the confirmation of one stock for the complete next year and the pattern was again represented for the third year also.
Table 5 Single Consequent with Highest Majority for Year 1998
Rules Association Rules Confidence Instances
1 S2,s16,s19 -> s17 .96 50
2 S12,s19,s23 -> s17 .96 50
3 S16,s19,s23 -> s17 .95 53
4 S19,s22,s23 -> s17 .95 52
5 S12,s16,s19 -> s17 .94 51
6 S16,s19,s22-> s17 .93 51
7 S16,s19 -> s17 .93 63
8 S19,s23 -> s17 .92 57
9 S2,s16 -> s17 .92 54
Table 6 Single Consequent with Highest Majority for Year 1999
Rules Association Rules Confidence Instances
1 S17,s22 -> s16 .85 53
2 S17,s19 -> s16 .82 54
3 S18,s19 -> s16 80 57
4 S19 -> s16 .77 71
5 S19,s22 -> s16 .77 54
6 S8 -> s16 .75 61
Table 7 Single Consequent with Highest Majority for Year 2000
Rules Association Rules Confidence Instances
1 S17,s22,s23 -> s16 .98 41
2 S17,s23,s25 -> s16 .98 39
3 S19,s22,s23 -> s16 .95 40
4 S22,s23,s25 -> s16 .95 39
5 S2,s17,s23 -> s16 .95 37
6 S17,s19,s21 -> s16 .95 38
7 S17,s22,s25 -> s16 .95 38
8 S23,25 -> s16 .94 44
9 S12,s22,s23 -> s16 .93 42
Table 8 Single Consequent with Highest Majority for Year 2001
Rules Association Rules Confidence Instances
1 S22,s25 -> s16 .91 41
2 S12,s25 -> s16 .88 43
3 S19,s25 -> s16 .87 41
4 S11,s22 -> s16 .86 38
5 S2,s25 -> s16 .85 39
6 S13,s25 -> s16 .85 37
7 S6,s25 -> s16 ..83 44
8 S13,s22 -> s16 .83 38
9 S19,s23 -> s16 .82 37
10 S6,s11 -> s16 .81 39
Again, in the previous three years, the same consequent was generated which indicated that the confirmation of one stock for the complete next two years and the same pattern was again generated for the fourth year also.
Table 9 Single Consequent with Highest Majority for Year 2002
Rules Association Rules Confidence Instances
1 S25 -> s5 .76 63
2 S12,s21 -> s5 .76 69
3 S15,s21 -> s5 .76 68
4 S4 -> s5 .74 63
5 S8,s21 -> s5 .74 84
6 S22 -> s5 .74 .67
7 S6,s21 -> s5 .73 72
8 S21 -> s5 .73 119
9 S3 -> s5 .73 88
10 S18 -> s5 .72 68
Table 10 Single Consequent with Highest Majority for Year 2003
Rules Association Rules Confidence Instances
1 S13,s17,s22 -> s23 .90 38
2 S2,s22 -> s23 .87 41
3 S18,s22 -> s23 .86 50
4 S17,s22 -> s23 .85 41
5 S12,s18 -> s23 .84 38
6 S22,s25 -> s23 .84 43
7 S18,s20 -> s23 .82 46
8 S17,s18 -> s23 .82 40
9 S18,s25 -> s23 .82 40
10 S13,s22 -> s23 .81 37
Table 11 Single Consequent with Highest Majority for Year 2004
Rules Association Rules Confidence Instances
1 S17,s19 -> s23 .91 43
2 S18,s19 -> s23 .90 45
3 S18,s22 -> s23 .87 46
4 S3,s18 -> s23 .86 38
5 S2,s18 -> s23 .86 42
6 S17,s18 -> s23 .86 42
7 S6,s18 -> s23 .85 39
In the previous two years, the same consequent was generated which indicates that the confirmation of one stock for the complete next year and the pattern was again represented for the third year also.
Table 12 Single Consequent with Highest Majority for Year 2005
Rules Association Rules Confidence Instances
1 S3,s7 -> s6 .79 38
2 S7,s10 -> s6 .75 44
3 S5,s9 -> s6 .74 43
4 S9,s17 -> s6 .74 45
5 S7,s20 -> s6 .74 39
6 S3,s22 -> s6 .73 40
7 S17,s22 -> s6 .73 40
8 S9,s20 -> s6 .72 39
Table 13 Single Consequent with Highest Majority for Year 2006
Rules Association Rules Confidence Instances
1 S16,s18 -> s23 .86 42
2 S2,s16 -> s23 .82 37
3 S16,s18 -> s23 .82 37
4 S18,s25 -> s23 .81 39
5 S2,s18 -> s23 .81 38
6 S10,s18 -> s23 .81 39
7 10,s22 -> s23 .81 42
In the last four years single consequent was repeated three times clearly indicating strength of that stock.
Table 14 Single Consequent with Highest Majority for Year 2007
Rules Association Rules Confidence Instances
1 S12,s14 -> s18 .91 39
2 S14,s17 -> s18 .90 48
3 S12,s23 -> s18 .89 41
4 S6,s23 -> s18 .88 38
5 S8,s23 -> s18 .86 37
6 S12,s17 -> s18 .83 40
7 S2,s23 -> s18 .82 37
Table 15 Single consequent with highest majority for year 2008
Rules Association Rules Confidence Instances
1 S16 -> s24 .79 89
2 S19 -> s24 .78 84
3 S17 -> s24 .76 80
4 S18 -> s24 .76 81
5 S12 -> s24 .76 79
6 S7 -> s24 .76 83
Table 16 the Consequent with Highest Majority Voting Is Presented Below In a Table
Year Consequent Majority voting
1996 S15 1038
1998 S17 481
1999 S16 350
2000 S16 358
2001 S16 397
2002 S5 761
2003 S23 414
2004 S23 295
2005 S6 328
2006 S23 274
2007 S18 280
2008 S24 496
[image:5.595.40.279.52.162.2]In Fig 2 a candlestick weekly chart of a stock TATA STEEL was illustrated, where each candle represented one week duration, and it clearly displayed the price movement from Rs. 477 at the end of 2006 and its price reached to a high of 1001 in the month of Oct. 2007 giving more than 100% return.
Figure. 2 Tata Steel weekly chart of year 2007
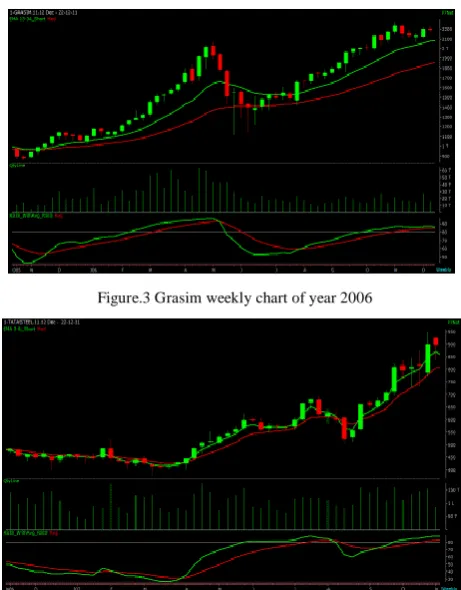
[image:5.595.45.268.246.380.2]In Fig 3 a candlestick weekly chart of GRASIM stock was displayed, where each candle represented one week duration, and it clearly indicated the price movement from Rs. 1390 at the end of 2006 and its price reached to a high of 2600 in the month of May. 2007 giving more than 100% return in a five month period.
Figure.3 Grasim weekly chart of year 2006
Figure 4 Tata Steel weekly charts in year 2004
On the same basis, in Fig 4 a candlestick chart of TATA STEEL is shown, in which in the beginning prices of that stock remained almost flat, followed by a steep rally, which thus yielded good returns.
V. CONCLUSION AND FURTHER WORK
In this paper, the pattern was presented about how a portfolio was built and how an investor can make use of this to learn more about investment plan and help understanding the finance market. In this paper, the association rules were generated from a real time dataset, and a group of association rules obtained for each year. The consequent was chosen with a majority voting, because the result from the best confidence method may be deteriorated by low support count. The generated pattern by means of consequent is presented, which will be of much use for an investor. In the first six years one consequent was repeated twice and another consequent was repeated thrice. In the last four years single consequent was repeated three times clearly indicating strength of that stock
Further the time granularity may be extended to months or weeks in stead of yearly data for getting a better prediction and pattern because in a stock market the pattern generated did not work for a longer period. Normally a trend was determined from a longer data but it will be difficult to have the same for a longer duration. Also if the period was divided into number of months and a weekly pattern be looked into in a quarterly basis, a better pattern may be emerged. Further an emerged pattern may be authenticated by applying moving average techniques.
VI. REFERENCES
[1]. Agrawal R., Imielinski T. and Swami A. ―Mining association rules between sets of items in large databases‖, Proceedings of the ACM SIGMOD Conference on Management of Data, Washington, D.C.1993,, pp. 207-216..
[2]. Bayardo R.J.‖ Efficiently mining long patterns from databases‖. In SIGMOD 1998, pp. 85-93.
[3]. Brockwell P. and Davis R., Introduction to Time Series and Forecasting. Springer-Verlag New York, 1996.
[4]. Gerardo BD, Lee J, Lee J, Park M, Lee M. ―The association rule algorithm with missing data in data mining‖. In: Proceedings of Computational Science and its Applications— ICCSA 2004, 97–105.
[5]. Han, J. and Kamber, M. ― Data Mining Concepts and Techniques‖. Morgan Kauffman Publishers, Elsevier, San Francisco, CA.2006.
[6]. Han, J., and Fu, Y. ―Discovery of multiple-level association rules from large databases‖. In VLDB'95, Proceedings of 21th International Conference on Very Large Data Bases, September 11-15, 1995, Zurich, Switzerland (1995).
[7]. Keogh, E. A Decade of Progress in Indexing and Mining Time Series data, Tutorial of the 32nd International Conference on Very Large Data Bases, Seoul, Korea, 2006. [8]. Kovalerchuk, B. and Vityaev, E. ―Data Mining in Finance,
Advances in Relational and Hybrid Methods‖. Kluwer Academic Publishers, Massachusetts.2000.
[image:5.595.40.271.468.763.2]Knowledge Discovery, San Diego, CA.2003.
[10].Liu, B., Hsu, W., and Ma, Y. ―Mining association rules with multiple minimum supports‖. In Knowledge Discovery and Data Mining (1999), pp. 337-341.
[11].Meo, R., Psaila, G., and Ceri, S. ―A new sql-like operator for mining association rules‖. In VLDB'96, Proceedings of 22th International Conference on Very Large Data Bases, September 3-6, 1996, Mumbai (Bombay), India.
[12].Silberschatz A, Tuzhilin A,‖What makes patterns interesting in knowledge discovery systems‖. IEEE Trans. Knowledge Data Eng. 1996,8: 970–974
[13].Soon, L.-K. and Lee, S.H. , ― Explorative Data Mining on Stock Data Experimental Results and Findings‖ . In Proceedings of the 3rd International Conference on
Advanced Data Mining and Applications, Harbin, China 2007, 562-569.
[14].Soon, L.-K. and Lee, ―An Empirical study of Similarity Search in stock data‖ In C on fere n ce i n Resear ch a nd Pr a cti ce in In for mati on Te chn ol ogy( C RP IT 2 007), A u s t r a l i a .
[15].Ting, J., Fu, T. and Chung, F. ―Mining of Stock Data: Intra- and Inter-Stock Pattern Associative Classification‖. In Proceedings of 2006 International Conference on Data Mining, Las Vegas, USA, 30-36.
[16].Toivonen H. ―Sampling Large Databases for Association Rules‖. In Proceedings of the 22nd International Conference on Very Large Data Bases, 1996, Bombay, India,