Volume 8, No. 5, May-June 2017
International Journal of Advanced Research in Computer Science RESEARCH PAPER
Available Online at www.ijarcs.info
An Effective Stone Image Classification using Surface Patterns based on Reduced
Dimension and Gray Level Range Model
G.S.N Murthy
Research Scholar, Rayalaseema University, Kurnool, India
Dr. V Srinivasa Rao
Prof & HOD, Dept of CSE,
V.R. Siddhartha Engineering College, Vijayawada, India
K. Vanitha
Assistant Professor, GITAM institute of science GITAM University, Visakhapatnam, India
Abstract: This Texture classification plays an important role in many areas such as remote sensing, construction filed, medical imaging. The present paper proposes an innovative technique that classifies stone texture into four categories i.e. Brick, Marble, Granite and Mosaic based on the Surface Patterns (SP). Surface Pattern of the stone image is represented using Decreased Dimension and Reduced Gray level Range Matrix (DDRGRM) model. The DDRGRM model reduces the dimension of the image from 5×5 into 2×2 and also reduces the gray level range by preserving the significant feature information. The proposed technique focuses on the Surface Pattern (SP) which appears on DDRGRM image i.e. the patterns formed by Bezier curve (BC), U, V and T patterns. Hence, this model is termed as Surface Patterns on DDRGRM (SP-DDRGRM). The SPs on DDRGRM model of the stone texture are measured on a 5×5 sub image, because the surface patterns can be better viewed and they are difficult to fit in to 3×3 window. Based on the surface patterns count, the present paper develops a user defined algorithm for efficient classification that classifies stone image into 4 groups i.e. bricks, marble, granite and mosaic. The experimental analysis gives a clear idea about the features extracted in stone images by using SP-DDRGRM model which is suitable for both categories of classification algorithms i.e. standard algorithms like k-NNC, ID3 and SVM etc., and user defined algorithms. The experimental results indicate that proposed technique suits well for both standard and user-defined algorithms.
Keywords: Fuzzy logic, Co-occurrence Matrix, Dimension Reduced, Stone texture, Classification, Surface pattern.
1.INTRODUCTION
Texture analysis is one of the most important techniques when image consists of repetition or quasi repetition of some fundamental image elements [1]. A texture image is primarily a function of the following variables: the texture surface, its albedo, the illumination. For achieving the better performance, different types of features are extracted to characterize the texture images. Majorly texture analysis and classification are achieved either using statistical or structural methods. Due to textures capability to distinguish regions with similar colors and shapes, texture is considered as an important determinant in identifying region class in region-based image retrieval (RBIR). Even texture features are very useful in RBIR, it is difficult to model them. Ideally, a texture feature of an object should be consistent with human perceptual intuitions of the object, like directional/chaotic and smooth/rough [2, 3]. In structural approach, texture is expected to consist of repetition of some primitive patterns. In texture classification and characterization, these statistical and structural methods have been adapted by different authors and achieved a certain degree of success [4]. The study of patterns on textures is considered to be one of the important steps in characterization of texture and their recognition. That is the reason why the present paper evaluates the frequency occurrences of various surface patterns and how they vary on stone image.
So many approaches are available in the literature for texture classification. The first and top most approach is
Local Binary Pattern (LBP) approach [5, 6]. But LBP approach has some disadvantages like if the central pixel value changes by 1, the LBP value drastically changes. Other approaches include wavelet transform [7, 8]. Texture images are also described and classified by using various wavelet transforms techniques: one based on statistical parameters [9] and another one based on primitive patterns [10]. Texture classification can be done by statistical learning from morphological image processing [11]. Recently various pattern based approaches like long linear patterns [12, 13], pre-processed images [14], edge direction movements [15], Complex Patterns avoidance [16], and texture description on Marbles [17] have been implemented and classified the textures into different groups.
Recently, Juan Wang et al [18] proposed a method for texture classification Using Scattering Statistical and Co-occurrence Features. Wang used an approach for texture features extraction. This approach used scattering transform for scattering statistical features and scattering co-occurrence features extraction which are derived from sub-bands of the scattering decomposition and these features are used for classification. The proposed approach got reasonable percentage rate of classification but the time complexity is somewhat high.
classifies the texture image into two groups only and each group consists of 4 different types of texture images.
Vijay Kumar et al [20] proposed a method to classify the stone textures into four categories based on occurrence of T-patterns count which are overlapped 5 bit T-patterns on each 5×5 sub-image. The classification rate of this approach is about 96.16%.
The main objective of our proposed technique is to extract features on stone textures. This technique is well suited for both standard classification algorithms and user defined algorithms. Majority of the existing approaches in which, extracted features are suited for either standard classification algorithms or user defined algorithm but not for both. Generally, the standard classification system for classifying the stone textures takes time for extraction of the features from stone image and also time for classifying them. The main objective of the proposed method is to fit for both the approaches i.e. for user defined algorithm and also for standard classification algorithms. If correct features are extracted then it is fit for both standard classification and also for user defined algorithm. So, the present paper concentrates on this point and develops a method called Surface Patterns on DDRGRM (SP-DDRGRM) for classifying the stone textures into four groups.
All the methods described in the literature, the features are extracted on entire image which leads to lot of complexity in evaluating feature parameters. The DDRGRM method reduces the image dimensionality from NXM to (2N/5×2M/5) and applies fuzzy concept for reducing the gray level range without any loss of significant texture feature information. Further the proposed method reduces the dimensionality of the image using wavelet concept on stone texture image and derives DDRGRM matrix and find the surface features on it. This enables an effective and efficient approach towards stone texture classification. The rest of the paper is organized as follows. In section 2, the proposed method is explained and results and user defined algorithm are explained in section 3. Finally in section 4 conclusions are given.
2. PROPOSED METHOD FOR STONE TEXTURE CLASSIFICATION BASED ON SURFACE PATTERNS ON DDRGRM MODEL
The present paper assumed that stone image as a texture. After understanding various texture properties and definitions, the present research used textural surface properties in classification of stone images. Various approaches are available which investigate the textural and spatial structural characteristics of image data, including measures of Fourier analysis, texture, fractal dimension. Still the study of patterns is treated to be a significant area of research in characterization of textures and classifying the same. That’s why the present paper investigates how the histograms of various surface patterns can vary on DDRGRM model of the stone image.
The proposed method attempted for stone texture classification based on reduction in the overall dimensionality and range of gray level using SP. In addressing the same and towards developing a user defined classification approach the present method reduced a 5×5 neighborhood into a 2×2 and also the overall gray level range is reduced from 0-255 to 0-4 using fuzzy approach
and measured the frequency of occurrences of SP’s on all fuzzy grey levels.
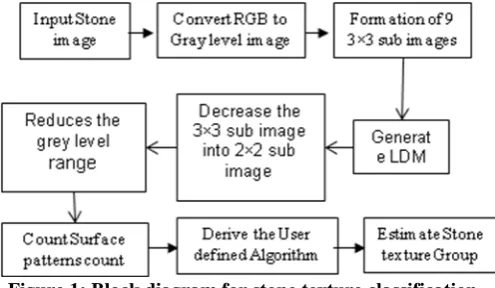
[image:2.595.316.564.295.439.2]The proposed method i.e. SP- DDRGRM model mainly consists of 7 steps. In step 1, convert the RGB stone texture image into Grey level image using HSV color model method. Formation of nine overlapped sub 3×3 sub images from a 5×5 sub image will be performed in step 2. In step 3, Derivation of “Local Difference Matrix (LDM)” on the nine overlapped 3×3 sub images and generate reduced matrix. Further reduce the 3×3 sub image into 2×2 sub image without losing the texture image information in step 4. In step 5, Reduces the grey level range in each 2×2 sub image using fuzzy concept and generate the Fuzzy reduced co-occurrence matrix. In step 6, identify the surface patterns i.e. Bezier curve (BC), U, V and T patterns classification. In step 7, based on the trends of the surface patterns the proposed method derives a user defined algorithm for classification of stone texture into four categories i.e. bricks, marble, granite and mosaic. The block diagram of the SP-DDRGRM model is shown in Figure 1.
Figure 1: Block diagram for stone texture classification system.
Wherever Times is specified, Times Roman or Times New Roman may be used. If neither is available on your word processor, please use the font closest in appearance to Times. Avoid using bit-mapped fonts if possible. True-Type 1 or Open Type fonts are preferred. Please embed symbol fonts, as well, for math, etc.
2.1 RGB to HSV color model conversion:
In processing color image, various color models are in use. So as to extract gray level features, SP-DDRGRM model utilized the HSV colour model. In RGB model, each pixel in the image is represented by three components i.e., red, green and blue. HSV color space is formed by hue (H), saturation (S) and value (V). In HSV model H is a color attribute which represents the dominant color, S represents relative purity or the degree to which a pure color is diluted by white light and V denotes brightness perception of a specific color. HSV color space is a non-linear transform from RGB color space which accurately describes perceptual color relationship. In this method, color variation can be individually discriminated. The transformation equations for RGB to HSV color model conversion is given below.
V=max(R,G,B) (1)
Where the color component Hue (H) range is [0, 255], the saturation (S) range is [0, 1] and the range of Value (V) is [0, 255]. In this present study, the color component Hue (H) is considered in classification of stone images. The resultant image generated using the HSV colour model and original images are shown in Figure 2.
[image:3.595.353.522.295.372.2]
(a) (b)
Figure 2: Marble stone image
(a) Color image (b) Resultant Gray level image
2.2 Formation of 9 overlapped sub 3×3 sub images from a 5×5 sub image:
The sub image 5×5 consists of 25 pixels and they are denoted by elements: G= {G1,…., G13, ...G25}, where Gi is the intensity of the pixel and G13 is the central pixel as shown in Figure 3. The Figure 4 represents the formation of nine overlapped 3×3 sub windows represented as {w1, w2, w3,……., w9} from the Figure 3.
G1 G2 G3 G4 G5
G6 G7 G8 G9 G10
G11 G12 G13 G14 G15
G16 G17 G18 G19 G20
G21 G22 G23 G24 G25
Figure 3: Representation of a 5×5 sub image
G1 G2 G3 G2 G3 G4 G3 G4 G5 G6 G7 G8 G7 G8 G9 G8 G9 G10 G11 G12 G13 G12 G13 G14 G13 G14 G15
w1 w2 w3
G6 G7 G8 G7 G8 G9 G8 G9 G10 G11 G12 G13 G12 G13 G14 G13 G14 G15 G16 G17 G18 G17 G18 G19 G18 G19 G20
w4 w5 w6
G11 G12 G13 G12 G13 G14 G13 G14 G15 G16 G17 G18 G17 G18 G19 G18 G19 G20 G21 G22 G23 G22 G23 G24 G23 G24 G25
w7
w8
[image:3.595.89.230.454.560.2]
w9
Figure 4: Representation of overlapped 3×3 neighborhoods {w1, w2, … , w9} from Figure 3
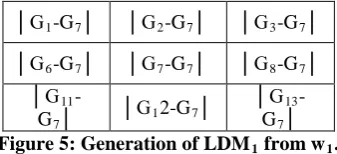
2.3 Derivation of LDM on each 3×3 overlapped window of 5×5 sub image:
The LDM gives an efficient representation of texture images. In this step, LDM is computed for all nine 3×3 overlapped windows {w1, w2, w3,…, w9} of each 5×5 sub image. LDM is the absolute difference between the gray value of the each neighboring pixel and of the central pixel. The LDM mechanism is described by the Equation 6 and the resultant is shown in figure 5. This forms nine new 3×3 LDMs and represented as {LDM1, LDM2, LDM3 , . . LDM9}.
LDMi = abs (Pi - Pc Where p
) for i = 1,2,...9 (6)
c and pi are the central pixel and neighboring pixel values of the overlapped 3×3 neighborhood in {w1,w2,…w9}. The Equation 6 demonstrates that the resultant value of each LDM in which the centre pixel value is always zero.
│G1-G7│ │G2-G7│ │G3-G7│
│G6-G7│ │G7-G7│ │G8-G7│
│G11
-G7│ │G1
2-G7│ │G13 -G7│ Figure 5: Generation of LDM1 from w1.
2.4 Generation of Decrease Dimension Matrix (DDM) of 5×5 into 3×3 window:
In this each value of DDM is evaluated from each of the nine LDM’s generated in the previous step in two stages: generation of Mean LDM in the first step and then generate DDM. In stage one, find the mean of the 9 windows which are generated in previous step by using the equation 7. The generated values forms a matrix is called Mean LDM (MLDM). The MLDM is a 3×3 window with nine elements (MLDP1 to MLDP9). The MLDM retains the properties of local neighborhood including edge information.
MLDPi = mean of (LDMi
Further, generate the DDM by calculating the local difference between the neighboring pixel values and central pixel value of the MLDP matrix and is represented by equation 8. The Equation 8 demonstrates that central pixel value of the 3×3 DDM is always zero.
) for i = 1,2,…9 (7)
DDPi = abs (MLDPi – MLDPc ) for MLDPi = 1,2,…9 (8)
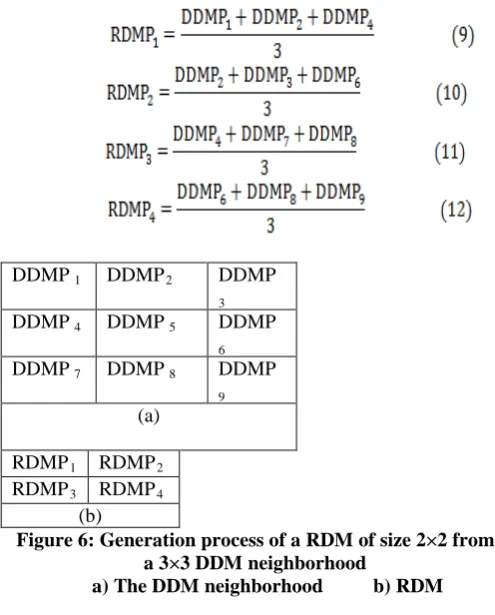
2.5 Generation of Reduced Dimension Matrix (RDM) 2×2 window from DDM:
DDMP 1 DDMP2 DDMP
3 DDMP 4 DDMP 5 DDMP
6 DDMP 7 DDMP 8 DDMP
9 (a)
RDMP1 RDMP2 RDMP3 RDMP4
(b)
Figure 6: Generation process of a RDM of size 2×2 from a 3×3 DDM neighborhood
a) The DDM neighborhood b) RDM
2.6 Reduction of gray level range in RDM using fuzzy logic:
[image:4.595.30.278.51.359.2]In real world applications like texture characterization, Fuzzy logic has major advantages so as to deal accurately with the regions of natural images even in the presence of noise. In the process of caption and digitization fuzzy logic is introduced on DDM. The proposed fuzzy approach converts the DDM gray levels into 5 different levels ranging from 0 to 4. The resultant matrix is called Decrease Dimension Reducing Gray level Range Matrix (DDRGRM). The proposed DDRGRM model is derived by comparing the each pixel of the 2×2 DDM with the average pixel values of the DDM. The DDRGRM representation is shown in figure 7. The following equations 13 and 14 are used in determining the elements of DDRGRM model.
Figure 7: Fuzzy representation of DDRGRM model of the image
0 if RDMPi < V0 and RDMPi 1 if RDMP
< x
i < V0 and RDMPi DDRGRMP
≥ x
i= 2 if RDMPi = V0 for 3 if RDMPi > V0 and RDMPi
4 if RDMP
> y i=1,2,3,4
i > V0 a and RDMPi ≤ y --(13)
Where x, y are the user-specified values.
--(14)
For example, in the process of evaluating DDRGRM model on a sub RDM image of 2×2 is as shown in figure 8 where x and y values are chosen as V0/2 and 3V0/2 respectively.
28 39 1 2
61 9 4 0
[image:4.595.320.560.463.671.2](a) (b)
Figure 8: the process of evaluating DDRGRM model from RDM (a) RDM (b) DDRGRM model.
2.7 Evaluation of the frequency occurrences of Surface Patterns on DDRGRM in stone images:
[image:4.595.38.209.548.619.2]The proposed SP-DDRGRM considered an exhaustive number of Bezier curves as they represent good pattern changes of stone textures as they are irregular textures. The present study considered Bezier curves with twelve different control points on each of the 5×5 sub image of the reduced image. The Bezier curves w.r.to control points are shown in Figure 9. Further the present paper considers three alphabet patterns i.e. U, V and T which have resulted in good classification results especially in texture classification [21]. The considered SPs i.e. Bezier curve patterns and alphabet patterns on a 5×5 mask are shown in Figure 9 and 10 respectively.
SPs are evaluated on each of the fuzzy values. That is the frequency occurrences of Bezier curves with different fuzzy level values i.e. 0, 1, 2, 3 and 4 are evaluated and denoted as B0, B1, B2, B3 and B4 respectively. In the same way U, V, T patterns are evaluated with all 5 fuzzy gray level values. To have a precise and accurate stone texture classification, the present study considered sum of the frequencies of occurrences of all SP’s on Bezier curve, U, V, and T Patterns.
1 0 0 0 1 1 0 0 0 1 1 1 1 1 1
1 0 0 0 1 1 0 0 0 1 0 0 1 0 0
1 0 0 0 1 1 0 0 0 1 0 0 1 0 0
1 0 0 0 1 0 1 0 1 0 0 0 1 0 0
1 1 1 1 1 0 0 1 0 0 0 0 1 0 0
Figure 10: SP on a 5×5 sub image with 00
(a) U-Pattern, (b) V-Pattern, (c) T- Pattern. orientations with fuzzy value 1.
3. RESULTS AND DISCUSSIONS
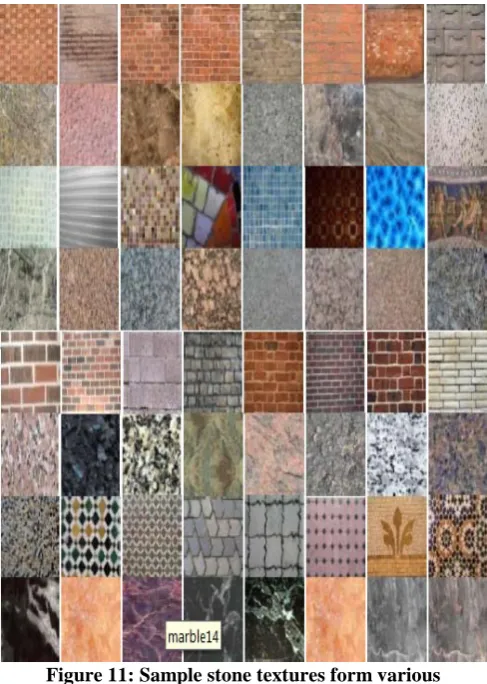
[image:5.595.320.561.111.321.2]The present paper established a database of 2522 sample stone texture images, consisting of 612 stone images collected from Mayang database, 678 stone images collected from VisTex database, 832 images collected from Paul Bourke database and 400 stone texture images collected from Google. Some of the sample images are shown in Figure 11 from each stone texture group. From the database, 40 percentage of the each data set group is used for training and reaming 60 percentage images are used for testing purpose i.e. 1008 images are used for training purpose and 1514 images are used for testing purpose. The proposed SP-DDRGRM classified the stone images into 4 pre-defined groups: Marble, Granite, Bricks and Mosaic. The surface pattern features i.e. Bezier curves with twelve different control points, U, V and T patterns on each 5×5 sub image are identified on DDRGRM model of stone images and the corresponding results are stored in the feature vector. Feature set represent the surface pattern features of DDRGRM model on the training images of four groups i.e. Marble, Granite, Bricks and Mosaic. Some of the feature set of sample images of four groups are shown in Tables 1, 2, 3, and 4 respectively. Based on these feature set values, the present paper derives a user defined algorithm to classify the stone texture into 4 groups i.e. marble, brick, granite and mosaic.
Figure 11: Sample stone textures form various databases.
Table 1: Frequency occurrences of Surface patterns using SP-DDRGRM model on Brick images
Table 2: Frequency occurrences of Surface patterns using SP-DDRGRM model on Marble images
[image:5.595.36.280.420.762.2]Table 4: Frequency occurrences of Surface patterns using SP-DDRGRM model on Mosaic
From the tables 1 to 4, it can be observed that only fuzzy values of B2, U2, V2, and T2 patterns only formed in stone textures because of all the gray level values in each 5X5 neighborhood nearly equal to central pixel. So, for classification purpose the present SP-DDRGRM approach considered only fuzzy gray level 2 w.r.to Bezier curve and U, V and T Patterns in feature vector, and derived a stone texture classification approach to classify stone texture into four groups which is presented in Algorithm1.
Algorithm 1: Stone texture classification based on sum of frequency occurrences of only fuzzy gray level 2 w.r.to Bezier curve and U,V and T Patterns on SP-DDRGRM model.
BEGIN
Let the sum of frequencies of Bezier curve patterns with 12 control points on fuzzy value 2 is denoted as BSP2 and the sum of frequencies of U,V and T patterns count on fuzzy value 2 is denoted as UVTSP2
If (BSP2 > 1545 && UVTSP2 < 758)
Print (Stone image is Treated as Mosaic Class) Else if (BSP2 > 1545 && UVTSP2 >= 758)
Print (Stone image is Treated as Marble class) Else if (BSP2 <= 1545 && UVTSP2 <= 75)
Print (Stone image is Treated as Bricks class) Else if (BSP2 <= 1545 && UVTSP2 > 75)
Print (Stone image is Treated as Granite class) Else
Print (Unknown class) End.
3.1 Result Analysis: To evaluate the performance and significance of the proposed SP-DDRGRM model, the present study evaluates the classification accuracies using standard classification algorithms and also user defined algorithm. In this paper, for testing the efficiency of the proposed method the classification of stone texture is implemented k-Nearest Neighbor Classifier (KNNC), ID3 algorithm and Support Vector Machines algorithm. All the experiments are carried out on a PC machine with i5 (5th generation) processor 2.4 GHz CPU and 4 GB RAM
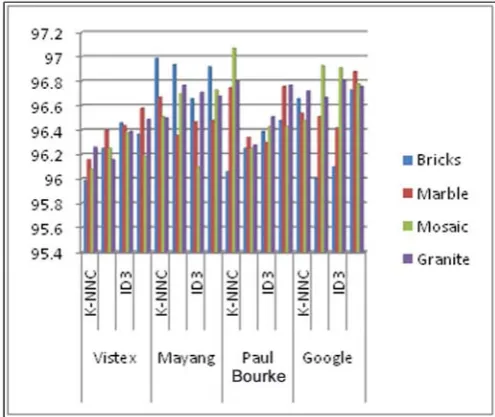
memory under MATLAB 10.1a platform. The classification results of each of the standard approaches along with user defined approach on each of the databases and texture types are show in Figure 5 and the same was represented
graphically in Figure 12.
Table 5: Classification results of the Standard Classification and user defined algorithms on feature set. Database Algorithm Bricks Marble Mosaic Granite
Vistex K-NNC 95.99 96.16 96.08 96.26
SVM 96.25 96.4 96.25 96.16
ID3 96.46 96.44 96.38 96.39
User Defined Algorithm
96.37 96.58 96.19 96.49
Mayang K-NNC 96.99 96.67 96.51 96.5
SVM 96.94 96.36 96.7 96.77
ID3 96.66 96.47 96.1 96.71
User Defined Algorithm
96.92 96.48 96.73 96.68
Paul Bourke
K-NNC 96.06 96.75 97.07 96.8
SVM 96.25 96.34 96.25 96.28
ID3 96.39 96.3 96.43 96.51
User Defined Algorithm
96.48 96.76 96.43 96.77
Google K-NNC 96.66 96.54 96.48 96.72
SVM 96.01 96.51 96.93 96.67
ID3 96.1 96.42 96.91 96.81
User Defined Algorithm
96.73 96.88 96.78 96.76
[image:6.595.310.569.145.451.2]From Table 5, it is evident that, all the classification algorithms used in this study gave good classification results on the derived feature set. So, the present study is well suitable for feature extraction and classification using both standard classification and user defined approaches
Figure 12: Classification graph of the proposed and standard classification approaches
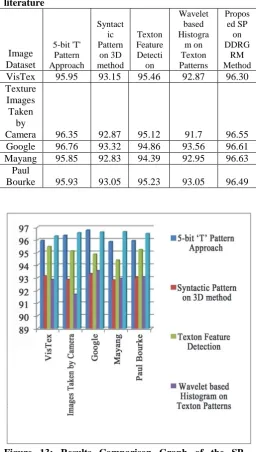
3.2 Comparison with other Methods:
[image:6.595.316.564.501.709.2]image approach [20], Wavelet based Histogram method(WHTP) [22], Texton feature evolution method [23] and Syntactic Pattern on 3D method [24]. In each of these approaches, stone textures are classified into four categories. Further on the feature set generated using SP on DDRGRM different standard classification approaches like k-NN, ID3 and SVM are applied. From the results it is clearly obvious that, the proposed method show signs of a high classification rate than the existing methods. The percentage mean classification rate for the proposed method and other existing methods are represented in Table 6. The graphical representation of the percentage mean classification rate for the proposed method and other existing methods are shown in Figure 13.
Table 6: % Mean classification rates for proposed SP-DDRGRM model and other existing methods in the literature
Image Dataset
5-bit 'T' Pattern Approach
Syntact ic Pattern
on 3D method
Texton Feature Detecti
on
Wavelet based Histogra
m on Texton Patterns
Propos ed SP on DDRG
RM Method
VisTex 95.95 93.15 95.46 92.87 96.30
Texture Images Taken
by
Camera 96.35 92.87 95.12 91.7 96.55
Google 96.76 93.32 94.86 93.56 96.61
Mayang 95.85 92.83 94.39 92.95 96.63
Paul
[image:7.595.32.289.253.706.2]Bourke 95.93 93.05 95.23 93.05 96.49
Figure 13: Results Comparison Graph of the SP-DDRGRM approach with other Existing Methods
4. CONCLUSION
The present paper provided a new direction for Stone texture classification based on frequency occurrences of Surface Patterns on DDRGRM (SP-DDRGRM). The proposed method reduced the overall complexity of characterization and classification as size of the stone texture image is reduced from N×M to 2N/5 ×2M/5 and also reduced the gray level range from 0-255 to 0-4. The Topological Texture Features are evaluated on each of the fuzzy level and it is found that only SP’s are formed on fuzzy value 2. The SPs used in the present approach are: Bezier curve features, U, V and T patterns. The proposed study used twelve different control points of Bezier curves which are estimated on each 5×5 sub image over reduced image. The novelty of the proposed approach is the feature extraction process which is suitable for both user defined algorithm and also for standard classification algorithms like SVM, k-NN classifier and ID3. The proposed approach SP-DDRGRM has achieved an average classification accuracy of 96.51%.
REFERENCES
[1] Raghu. P.P and Yegnanarayana, B., “Segmentation of gabor-filtered textures using deterministic relaxation,” IEEE Transactions on Image Processing, vol. 5, no. 12, pp. 1625– 1636, 1996.
[2] Chang T and Kuo. C. C. J., “Texture analysis and classification with tree-structured wavelet transform,” IEEE Trans. Image Processing, Vol 2, no.4, pp. 429-442, 1993. [3] Chen. J. L. and Kundu, “Unsupervised texture segmentation
using multi-channel decomposition and hidden Markov models,” IEEE Transactions on Image. Processing, vol 4, no. 5, pp. 603-620, 1995.
[4] R. W. Conners, “Toward a set of statistical features which measure visually perceivable qualities of texture,” in Proc. Pattern Recognition Image Processing Conf., pp. 382-390, 1979.
[5] Bovik, A. C., Clark, M. and Geisler, W. S. “Multichannel texture analysis using localized spatial filters”, IEEE Trans. Patt. Anal. Mach. Intell., 12, 1, pp. 55-73, 1990.
[6] R.M. Haralick, K. Shanmugam, I. Dinstein, “Texture features for image classification”, IEEE Transactions on System Man Cybernat, Vol. 8, No. 6, 1973, pp. 610-621. [7] Vijaya Kumar, V., Raju, U.S.N. , Chandra Sekaran , K. and
Krishna, V. V. “ A New Method of Texture Classification using various Wavelet Transforms based on Primitive Patterns”, ICGST International Journal on Graphics, Vision and Image Processing, GVIP, Vol.8, Issue 2, pp. 21-27, 2008.
[8] Gullapalli Bhargav, G Ramanjaneya Raju, Pullela S V V S R Kumar, “Stone Texture Classification and Discrimination By Edge Direction Movement”, International Journal of Research in Engineering and Technology (IJRET): eISSN: 2319-1163, pISSN: 2321-7308, Vol. 04, no. 12 , pp. 38-42, Dec 2015.
[9] A. Suresh, et al., “An Innovative Technique of Marble Texture Description Based on Grain Components,” International Journal of Computer Science and Network Security, vol/issue: 8(2), pp. 122-126, 2008.
[10] V. V. Kumar, et al., “A measure of patterns trends on various types of preprocessed images,” IJCSNS, vol/issue: 7(8), pp. 253-257, 2007.
[12] Pullela S V V S R Kumar, Konda Naga Venkateswara Rao, Akella S Narasimha Raju, D.J. Nagendra Kumar, “Leaf classification based on Shape and Edge feature with k-NN Classifier”, IEEE - 2nd International Conference on Contemporary Computing and Information(IC3I) at Amity University, Noida during 14-17 Dec 2016.
[13] V. V. Krishna, et al., “Classification of textures based on distance function of linear patterns using mathematical morphology,” Proceedings of ICEM, conducted by JNT University, India, 2005.
[14] V. V. Kumar, et al., “An Innovative Technique of Texture Classification and Comparison Based on Long Linear Patterns,” Journal of Computer Science, vol 3, no.8, pp. 633-638, 2007.
[15] V. Vijaya Kumar, et al., “Classification of Textures by Avoiding Complex Patterns, Science publications,” Journal of Computer Science, 2008.
[16] U. S. N. Raju, et al., “Texture Description using Different Wavelet Transforms Based on Statistical Parameters,” proceedings of the 2nd WSEAS International Symposium on Wavelets Theory & Applications in Applied Mathematics, Signal Processing & Modern Science, Istanbul, Turkey, pp. 174-178, 2008.
[17] Pullela S V V S R Kumar, P Raviraja Reddy Mallidi, Vasamsetti. Ch. Sekhararao, Ayanavalli Ramadevi, Ch. N.Durga Swathi, “Texture Primitive Unit Extraction using Different Wavelet Transforms for Texture Classification”, IEEE - 2nd International Conference on Applied and Theoretical Computing and Communication Technology, SJBIT, Karnataka, during 21-23 July 2016
[18]
Classification Using Scattering Statistical and Cooccurrence Features”, Mathematical Problems in Engineering Volume 2016 (2016), Article ID 3946312, 6 pages.
[19] Gullapalli Bhargav, G Ramanjaneya Raju, Pullela S V V S R Kumar, “Stone Texture Classification and Discrimination By Edge Direction Movement”, International Journal of Research in Engineering and Technology (IJRET): eISSN: 2319-1163, pISSN: 2321-7308, Vol. 04, no. 12 , pp. 38-42, Dec 2015.
[20] Palnati Vijay Kumar, Pullela S V V S R Kumar, Nakkella Madhuri, M Uma Devi, “Stone Image Classification Based on Overlapped 5-bit T-Patterns Occurrence on 5-by-5 Sub Images”International Journal of Electrical and Computer Engineering (IJECE),Vol. 6, No. 3, June 2016, pp. 1152 ~ 1160.
[21] Francesco Bianconi a, Elena González, and Antonio Fernández b “Dominant local binary patterns for texture classification: Labelled or unlabelled?”, Pattern Recognition Letters 65 (2015) 8–14,
[22] Jangala Sasi Kiran, U Ravi Babu and Dr. V V Kumar “Wavelet based Histogram method for classification of textures”, IJECT, Volume: 4, issue: 3, pages: 149-164, Year:2013.
[23] Ravi Babu U , Vijaya Kumar, Sujatha B, “Texture Classification Based on Texton Features”, I.J. Image, Graphics and Signal Processing, Vol. 4 issue: 8, pages: 36-42, 2012.