Volume 8, No. 3, March – April 2017
International Journal of Advanced Research in Computer Science RESEARCH PAPER
Available Online at www.ijarcs.info
Feature Selection in Data Mining using Permutation Combination
Fifie Francis
PG Scholar
Department of Computer Science Christ University
Bangalore, India
Saleema J S
Associate Professor Department of Computer Science
Christ University Bangalore, India
Abstract: The identification of useful patterns from a medical dataset benefits early diagnosis. Classification techniques in data mining are famous for medical data prediction. Decision Tree (J48) and Navie Bayes are the most popular and frequently used algorithms in the field of prediction analysis. The efficiency of such prediction algorithms can be improved with better pre-processing approaches. This paper aims at finding optimum features using permutation combination of input data attributes for improving the classifier accuracy. The Pima Indian Diabetes Dataset from UCI repository is used for experimentation. The performance of J48 and Navie Bayes has been tested for different combination of features.
Keywords: Diabetes; J48; Navie Bayes; Permutation
I. INTRODUCTION
Data mining is the way toward breaking down information from alternate points of view and condensing it into valuable data. Data mining permits clients to examine data from a wide range of measurements or edges, arrange it, and encapsulates the connections distinguished [1]. CRISP- DM stands for cross-industry process for data mining. The CRISP-DM technique gives an organized way to deal with a data mining project. It is a strong and well-demonstrated technique. This model is an idealized sequence of events, and the events are: [2] Business Understanding, Data understanding, Data preparation, Modeling, Evaluation and Deployment
Diabetes, often referred by doctors as diabetes mellitus, portrays a gathering of metabolic infections in which the individual has high blood glucose, either in light of the fact that insulin generation is deficient, or in light of the fact that the body's cells do not react rightfully to insulin, or both [3].
II. LITERATURESURVEY
J48 outfits Quinlan's C4.5 algorithm for creating a pruned or unpruned C4.5 decision tree. C4.5 is an augmentation of Quinlan's prior ID3 algorithm. J48 constructs decision trees from a set of labeled training data utilizing the idea of information entropy. J48 looks at the standardized information gain that results from choosing an attribute for splitting the data. . To make the decision, the attribute with the highest information gain is used. Then the algorithm recurs on the smaller subsets. The splitting strategy stops if all instances that occurrences in a subset have a place with the same class. At that point a leaf node is made in the decision tree advising to pick that class. [4]
The Naive Bayes algorithm depends on conditional probabilities. It uses Bayes Theorem, an equation that computes a likelihood by checking the recurrence of values and blends of values in the historical data. Bayes' Theorem finds the likelihood of an occasion happening given the likelihood of another occasion that has as of now happened. [5]
Mukesh Kumari et al., [6] proposed a paper titled “Prediction of Diabetes Using Bayesian Network”. In this
dataset utilized is gathered from a hospital, which gathers the data of persons with and without diabetes. The tool utilized for the investigation and examination is Weka. Classification algorithm is applied on the dataset of persons gathered from hospital, and results have been acquired. To distinguish whether a given individual in dataset will be diabetic, non-diabetic or pre-non-diabetic the author analyzed the attribute values. Attributes like qfast gtt, casual gtt, and diastolic blood pressure values exceeding a specific value had contributed to distinguish whether a man is diabetic, non-diabetic or pre-diabetic. The author concluded that The Classification with Bayesian system demonstrates the best exactness of 99.51.
Gaganjot Kaur et al., [7] proposed a paper titled “Improved J48 Classification Algorithm for the Prediction of Diabetes”. This research work manages efficient data mining procedure for predicting the diabetes from medical records of patients. Diabetes is an extremely regular infection nowadays in all populaces and in all age bunches. Diabetes adds to coronary illness, expands the dangers of creating kidney diseases, nerve damage, vein damage and visual impairment. The Pima Indians Diabetes Data Set is utilized for this paper; which gathers the data of patients with and without having diabetes. The modified J48 classifier is utilized to build the exactness rate of the data mining method. The data mining tool WEKA has been utilized as an API of MATLAB for producing the J-48 classifiers. Test results demonstrated a significant change over the current J-48 calculation. It has been demonstrated that the proposed calculation can accomplish precision up to 99.87 %.
PLS-10 fold Cross Validation error rate, the error rate focuses True Positive, True Negative, False Positive and False Negative and Accuracy. The result shows CS-CRT algorithm is the best.
[image:2.595.36.271.113.302.2]III. METHODOLGY
Figure 1: Methodology
The Pima Indian Diabetes Dataset is used for this experiment on which different data mining preprocessing techniques are applied. Preprocessing techniques transforms raw data into useful and understandable format which helps to obtain more accurate result while executing algorithms. The features are extracted from the preprocessed data using permutation technique and the classifier techniques are executed for different combination of features. The results obtained for each combinations are evaluated.
IV. EXPERIMENTALSETUP
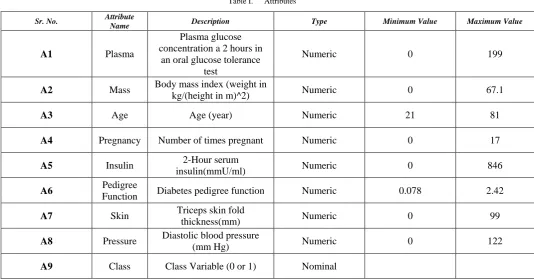
A dataset is a pool of data. Most regularly a dataset corresponds to the contents of a single database table, where each and every column of the table speaks to a specific variable, and every tuple in the table relates to a given individual from the dataset being referred to. The Pima Indian Diabetic dataset that is taken for the research work contains 768 records and 9 attributes for the purpose of analyzing the performance of two algorithms Decision Tree (J48) and Navie Bayes. All instances in the dataset have 8 input attributes and 1 output attribute. The table I below shows the attribute of this dataset. [6, 9]
Table I. Attributes
Sr. No. Attribute
Name Description Type Minimum Value Maximum Value
A1 Plasma
Plasma glucose concentration a 2 hours in
an oral glucose tolerance test
Numeric 0 199
A2 Mass Body mass index (weight in
kg/(height in m)^2) Numeric 0 67.1
A3 Age Age (year) Numeric 21 81
A4 Pregnancy Number of times pregnant Numeric 0 17
A5 Insulin 2-Hour serum
insulin(mmU/ml) Numeric 0 846
A6 Pedigree
Function Diabetes pedigree function Numeric 0.078 2.42
A7 Skin Triceps skin fold
thickness(mm) Numeric 0 99
A8 Pressure Diastolic blood pressure
(mm Hg) Numeric 0 122
A9 Class Class Variable (0 or 1) Nominal
The numbering scheme A1 till A9 defined in table 1 is later referred in table 3. Weka is a mainstream suite of machine learning software written in Java, created at the University of Waikato, New Zealand. The Weka work surface contains collection of visualization tools and algorithms for data analysis and predictive modeling. It is composed in Java and runs on any platform. The algorithms can either be connected straightforwardly to a dataset or called from your own Java code. [6]
V. RESULTANDDISCUSSION
[image:2.595.35.570.341.620.2]Figure 2: Gain Ratio Chart
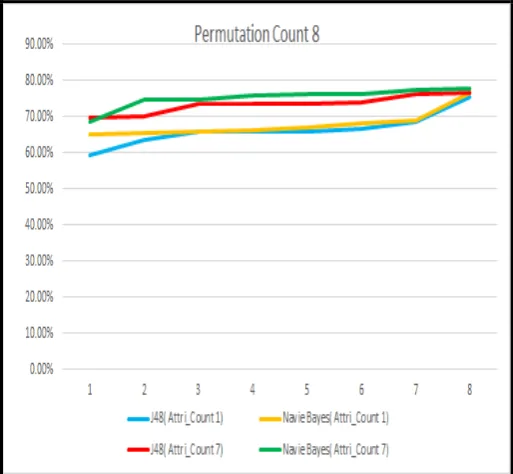
Based on the gain ratio values obtained different permutation combinations are formed ranging from one attribute till eight attributes along with class labels, and performed both J48 and Navie Bayes algorithm. The graphs below depict the efficiency of algorithms for different permutation combinations.
[image:3.595.307.565.56.251.2]Figure 3: J48 and Navie Bayes Performance for attribute count 1 and 7 (table 2) with permutation combination 8
[image:3.595.306.569.295.483.2]Figure 4: J48 and Navie Bayes Performance for attribute count 2 and 6 (table 2) with permutation combination 28
Figure 5: J48 and Navie Bayes Performance for attribute count 3 and 5 (table 2) with permutation combination 56
[image:3.595.36.293.364.601.2] [image:3.595.305.573.531.719.2]The table II below shows the maximum, minimum and average accuracy obtained for models built using J48 and
Navie Bayes while including all attributes and different
permutation combinations as discussed above.
Table II. Accuacy
Count J48 Navie Bayes
Attribute Count Permutation Count Min Accuracy Average
Accuracy
Max Accuracy Min Accuracy Average Accuracy Max
Accuracy
1 8 59.28% 67.43% 75.57% 65.15% 71.01% 76.87%
2 28 58.96% 68.08% 77.20% 65.80% 73.29% 80.78%
3 56 58.96% 68.40% 77.85% 66.45% 73.29% 80.13%
4 70 59.93% 68.57% 77.20% 66.45% 73.45% 80.46%
5 56 61.24% 69.38% 77.52% 67.10% 73.45% 79.80%
6 28 64.17% 70.36% 76.55% 67.75% 73.62% 79.48%
7 8 69.71% 73.13% 76.55% 68.73% 73.29% 77.85%
8 1 73.62% 73.62% 73.62% 75.90% 75.90% 75.90%
Following table III list the attributes which obtained maximum accuracy for different permutation combination
where the attributes are named like A1 till A8 are the numbering scheme used in table I.
Table III. Attribute Combinations With Maximum Accuracy
Attributes Count J48 Navie Bayes
Attribute List Maximum Accuracy Attribute List Maximum Accuracy
1 A1 75.57% A1 76.87%
2 A1 A4 77.20% A1 A2 80.78%
3 A1 A4 A8 77.85% A1 A2 A5,
A1 A2 A7, A1 A2 A8
80.13%
4 A1 A4 A5 A8,
A1 A4 A6 A8
77.20% A1 A2 A3 A5 80.46%
5 A1 A2 A4 A6 A7 77.52% A1 A2 A3 A5 A7,
A1 A2 A3 A5 A8
79.80%
6 A1 A2 A3 A4 A5 A8,
A1 A2 A3 A4 A7 A8, A1 A4 A5 A6 A7 A8
76.55% A1 A2 A5 A6 A7 A8 79.48%
7 A1 A2 A3 A4 A5 A7 A8 76.55% A1 A2 A3 A5 A6 A7 A8 77.85%
8 A1 A2 A3 A4 A5 A6 A7 A8 73.62% A1 A2 A3 A4 A5 A6 A7 A8 75.90%
After analyzing the accuracy from the above tables more accuracy for J48 was given in the permutation combination of 3 attributes along with class label and the accuracy was 77.85% the 3 attributes were
• Plasma glucose concentration a 2 hours in an oral glucose tolerance test
• Number of times pregnant • Diastolic blood pressure
The more accuracy for Navie Bayes was 80.78 % given by a permutation combination of 2 attributes along with class label the attributes are:
• Plasma glucose concentration a 2 hours in an oral glucose tolerance test
• Body mass index
VI. CONCLUSION
The identification of useful patterns from a medical dataset contribute more in the felid of medical diagnosis. This study aims at analyzing the better outcome for both J48 and Navie Bayes in various permutation combinations of attributes which are ranked using Gain Ratio Attribute Evaluator and Ranker algorithm. The highest efficiency obtained for J48 was 77.85% and the ROC curve obtained is
Figure 7: ROC curve for J48
[image:4.595.211.553.281.567.2]Whereas Navie Bayes was 80.78% and its ROC curve was
[image:4.595.315.560.623.743.2]VII. REFERENCES
[1]. "Data mining: What is data mining?,". [Online]. Available:
http://www.anderson.ucla.edu/faculty/jason.frand/teacher /technologies/palace/datamining.htm. Accessed: Oct. 25, 2016.
[2]. [Online]. Available: http://2)http://www.sv-europe.com/crisp-dm-methodology/. Accessed: Oct. 25, 2016.
[3]. M. N. Today, "Diabetes: Symptoms, causes and treatments," 2004. [Online]. Available: http://www.medicalnewstoday.com/info/diabetes.
Accessed: Oct. 25, 2016.
[4]. [Online]. Available:
http://www.opentox.org/dev/documentation/components/ j48. Accessed: Oct. 25, 2016.
[5]. "Naive Bayes," [Online]. Available: https://docs.oracle.com/cd/B28359_01/datamine.111/b28 129/algo_nb.htm#i1005770. Accessed: Oct. 25, 2016.
[6]. K. Mukesh, Dr. V.Rajan, A.Anshul “Prediction of Diabetes Using Bayesian Network” International Journal of Computer Science and Information Technologies, Vol. 5 (4), 2014.
[7]. K. Gaganjot, C. Amit “Improved J48 Classification Algorithm for the Prediction of Diabetes” International Journal of Computer Applications, Volume 98 – No.22, July 2014.
[8]. V.Karthikeyani, I. B.Parvin, K.Tajudin, I. B. Shahina “Comparative of Data Mining Classification Algorithm (CDMCA) in Diabetes Disease Prediction” International Journal of Computer Applications Volume 60– No.12, December 2012.