Volume 7, No. 1, January-February 2016
International Journal of Advanced Research in Computer Science
RESEARCH PAPER
Available Online at www.ijarcs.info
The Significance of Parameters’ Optimization in Fair Benchmarking of Software
Defects’ Prediction Performances
Hussam Ghunaim & Julius Dichter Computer Science and Engineering Department
University of Bridgeport, Bridgeport CT, USA
Abstract: Software engineering research in general and software defects’ prediction research in particular are facing serious challenges to their reliability and validity. The major reason is that many of the published research outcomes contradict each other. This phenomenon is mainly caused by the lack of research standards as it exists in many well-established scientific and engineering disciplines. The scope of this paper is to focus on fair benchmarking of the defects’ prediction models. By experimenting three prediction algorithms, we found that the quality of the resultant predictions would significantly fluctuate as parameters’ values changed. Therefore, any published research results not based on optimized prediction algorithms methods can cause inaccurate and misleading benchmarking and recommendations. Thus, we propose optimizing parameters as an essential research standard to conduct reliable and valid benchmarking. We believe if this standard were approved by interested software quality practitioners and research communities, it will present a vital role in soothing the severity of this phenomenon. The three prediction algorithms we used in our analysis were Support Vector Machine SVM, Multilayer Perceptron MLP, and Naïve Bayesian NB. We used KNIME as a data mining platform to design and run all optimization loops on open source Eclipse 2.0 data set.
Keywords: Parameters’ optimization, defects prediction, data mining, benchmarking, performance quality, SVM, MLP, NB, KNIME, Eclipse, machine learning
I. INTRODUCTION
Segaran [1] has defined optimization as a technique to test all possible solutions of a typical problem. In software defects’ prediction context, optimization means searching within all possible values of a certain prediction models’ parameters. The outcomes of optimization process are the optimized parameters that achieve an optimized predefined objective function. The objective function can be set to be as accuracy, true positives, false positives, etc. where positives in this context means an object1
It has become common in software engineering research that when a researcher publish some results, we can find many other published works that contradict the findings and ending up with completely different conclusions. Consequently, a great confusion does exist within academia research communities on one hand, and with software development practitioners on the other hand. This problem is critical because the main objective of conducting research is to enhance the current techniques and methods used by practitioners that are supposed to yield to a better software quality. However, in real life, practitioners do not usually search academic literature for better solutions to their problems [
being defective.
2]. Alternatively, the trending phenomenon today is that practitioners tend to discuss their work difficulties over expert blogs, knowledge databases, and many other modern communication platforms. Software defects’ prediction is one of the software engineering fields that suffer greatly from this phenomenon.
1 We used the term object to generalize the granularity level that might be
implemented using defects’ prediction models (i.e. either package, file/class or module level.)
This kind of conflicts has led to serious challenges to software engineering reliability and validity in general and software defects prediction in particular. For a long time, research communities have been trying to figure out the reasons behind such phenomenon. One factor stands out of the crowed is missing the agreed on standards to conduct high quality research, while many other scientific and engineering disciplines have developed a well-established standards.
Shaw [3] has debated this problem by stating: “Physics, biology, and medicine have well-refined public explanations of their research processes. Even in simplified form, these provide guidance about what counts as ‘good research’ both inside and outside the field. Software engineering has not yet explicitly identified and explained either our research processes or the ways we recognize excellent work.”
Further, she added: “Many sciences have good explanations of their research strategies . . . Acceptance of their results relies on the process of obtaining the results as well as analysis of the results themselves . . . Software engineering does not have this sort of well-understood guidance. Software engineering researchers rarely write explicitly about their paradigms of research and their standards for judging quality of results.”
Additionally, Pfleeger [4] has stated that “practitioners, who are the audience for our evidence, must be able to understand our theories and findings in the context of their work and values.” This claim has also been supported as well by Kocaguneli and his colleagues [5].
The aim of this paper is to show the significant effect of optimizing the parameters of defects’ prediction models on the performance of these models and hence on researchers’ conclusions. Consequently, we strongly believe that adopting parameters optimization as a software engineering standard would increase the liability and validly of research outcomes.
Optimization can be performed by implementing many methods, such as Random Searching, Hill Climbing, Simulated Annealing, etc. Discussing these techniques is out of this paper scope. For simplicity, we used Random Searching technique as the scope of this paper is to focus on the effects of parameters optimization rather than the efficiency of the selected optimization technique itself.
The rest of the paper is organized as follows. Section II discusses related work. Section III discusses the data set used along with all preprocessing techniques implemented. Section IV discusses the experiments design and implementation using KNIME as data mining platform. Section V discusses the findings of this paper.
II. RELATED WORK
Many approaches have been proposed in an attempt to lessen the reliability and validity problems of the software engineering. Evidence-Based Software Engineering (EBSE) approach stands out of the crowed. The power of this approach lies on providing empirical proves of results and hence allow practitioners and all other interested stakeholders to make informed decisions regarding adopting the most suitable solution to their problems in hand. Kitchenham et al. [6] have concluded in their paper that EBSE has the potential to bridge the gap of software engineering research quality.
Straus et al. [7] have summarized in their work in medicine field the following essential requirements for what they deemed as acceptable research standards.
• Best evidence must be sought after and presented to answer research questions.
• Evidence must always be critically assessed for reliability and validity. In other words, researchers must show how close their results to the truth.
• Evidence must be applicable in the context of the research domain in such a way that is useful to all involved stakeholders. In our case, software defects prediction models.
• Evidence must show the size of impact, which means the size of the effect.
There are some inspiring contributions that can help in developing applicable standards to software engineering field. The Australian National Health and Medical Research Council [8] have published guidelines to evaluate the quality
of evidences before including them in research, summarized in fig 1. Additionally, White L.J. [9] has emphasized the significance of this requirement by stating that “most [of research papers] reviewers will no longer simply accept the results of empirical study or full experiment, but insist upon some sort of statistical analysis to demonstrate statistical significance of the results.”
Research activities are a continuous endeavor. Therefore, research communities should always search for better standards to conduct research rather than simply adopting what have become common (or default) practices. Myrtveit et al. [10] have asserted the significance of evaluating our confidence degree in reported evidence. Consequently, the proposed parameter optimization by this paper can be seen as a single step in the journey of a thousand miles of standardizing software engineering research.
Some other researchers have implemented optimization with wide range of scopes. For instance, Tosun et al. [11] have applied an optimization method on Naïve Bayes NB prediction algorithm. Their objective function was the decision threshold. They reported a significant false positive rate decrease, on average from 34% to 23%. Can et al. [12] have applied Particle Swarm Optimization PSO technique to optimize the Support Vector Machine SVM kernel function parameters. Their results show a significant improvement in SVM prediction performance when apply the optimized parameters rather than the default values. A similar findings were reported by Wahono et al. [13] by applying meta-heuristics optimization method.
Arcuri et al. [14] conducted a large scale experiments on the effects of parameters tuning on algorithms performance. They concluded that such tuning process usually causing a large variance in algorithms performance. However, they also added, although using default values for setting up the algorithms parameters is commonly acceptable, the performance is always worst compared to the optimized parameters performance. These results were supported by Sayyad et al. [15] by their replicated study. Province [16]
• The strength of the evidence. This has three
elements: Level, Quality, and Statistical Precision. Level relates to the choice of study design and is used as an indicator to which bias has been eliminated by design. Quality refers to the methods used by the investigators to minimize bias within the study design. Statistical Precision refers to the P value or the confidence interval.
• Size of effect. The distance of the estimated treatment
effect from the null value and the inclusion of clinically important effects in the confidence interval.
• Relevance of evidence. The usefulness of the
evidence in clinical practice, particularly the appropriateness of the outcome measures used.
has experimented the effects of parameters optimization on four machine learning algorithms, Bernouli Naive Bayes, Random Forest, Logistic Regression, and Multinomial Bayes. He found that all algorithms have achieved an enhancement in their performance except Multinomial Bayes
III. DATA SET
Before selecting and using a data set in scientific or engineering research, it must meets the required standardized constraints [17, 18], such as: “(1) developed by a group, and not by an individual; (2) be as large as industry size projects, and not a toy problem; (3) developed by professionals, and not by students; and (4) developed in an industry/government organization setting, and not in a laboratory.” [19]
Therefore, we chose Eclipse software. First it meets all required standards mentioned above. Second, it is popular open source software. Thus, the base source code is available in the public domain. However, Eclipse is large software; consequently, we had to focus on a subset of the base code to run experiments on. In our research we chose Eclipse 2.0.
Prediction models can be run over a variety of granularity levels, such as, packages, files or modules levels. As granularity is not an affecting factor in our research, we simply chose to run all designed experiments at packages level. Eclipse 2.0 has 377 packages.
It is very common in software engineering that data sets are unsuitable for immediate use. That is, data sets must pass through preprocessing procedures before it is possible to use them. Two preprocessing procedures have been conducted on Eclipse 2.0 data set, normalization and balancing. Both operations are important. Normalization is needed to avoid dominance of some large metrics’ values. Balancing is needed to avoid the dominance of non-defective cases over defective cases. Such imbalance usually causes skew in data sets. [20, 21] Nevertheless, this is a common phenomenon in software defects’ data sets.
To solve the balancing problem we can use either over-sampling or under-over-sampling techniques. However these techniques usually result in over-fitting or under-fitting problems in the processed data set. In this paper we chose to implement SMOTE (Synthetic Minority Oversampling Technique) [22-24]. This technique is desirable because it considers all k-nearest neighbors when processing each minority case. By doing this, over-sampling the minority is highly unlikely to cause over-fitting in the processed data set, as it the case in other techniques [20].
IV. EXPERIMENTATION
We have used KNIME2
2 http://www.knime.org
as a data mining platform to design and run all optimization loops. The experimented prediction algorithms were Support Vector Machine SVM, Multilayer Perceptron MLP, and Naïve Bayesian NB. Each of these
algorithms has its own set of parameters that can be optimized.
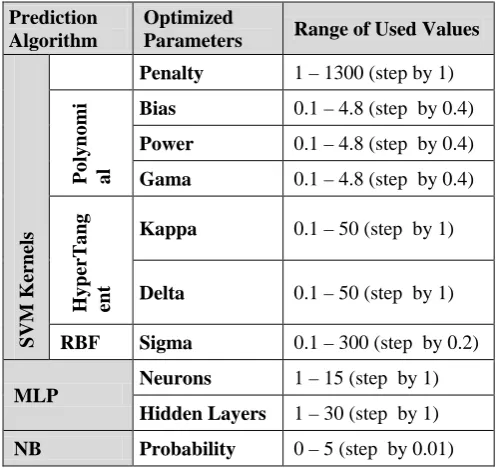
Optimization loops simply rerun each algorithm for a range of its parameters’ values chosen from a predefined search space, table (I). Note that SVM was implemented using three different kernels.
Optimization can implement wide range of searching methods, such as, Random-Search and Grid-Search. Random search was used and preferred over Grid-Search. Bergstra et al. [25] have shown that random search would result in identifying better optimized parameters than grid-search. This choice makes sense since the scope of the research to show the effect of parameters optimization on prediction algorithms performance rather than determining either global maxima or global minima within the performance space.
To measure the performance quality of prediction models, we chose Accuracy and F1-Score [26, 27].
(1)
Where,
(2)
(3)
(4) These two measurements are based on the confusion matrix that is constructed for each algorithm, table (II). The first column shows the actual (real) positive AP cases (defective objects) and the second column shows the actual (real) negative AN cases (non-defective objects). Similarly, the first row shows the predicted positives PP and the second row shows the predicted negatives PN. The bottom right cell shows the total number of cases experimented where it
Table (I): Values ranges used in parameters’ optimization loops.
Prediction Algorithm
Optimized
Parameters Range of Used Values
SV M K er ne ls
Penalty 1 – 1300 (step by 1)
P ol y n om i al
Bias 0.1 – 4.8 (step by 0.4)
Power 0.1 – 4.8 (step by 0.4)
Gama 0.1 – 4.8 (step by 0.4)
H y p erT a n g en t
Kappa 0.1 – 50 (step by 1)
Delta 0.1 – 50 (step by 1)
RBF Sigma 0.1 – 300 (step by 0.2)
MLP Neurons 1 – 15 (step by 1)
Hidden Layers 1 – 30 (step by 1)
[image:3.595.313.562.171.406.2]should be always count to 1 (100%). Fig (2) depicts the meaning of the confusion matrix contingencies: tp (true positive), fp (false positive), fn (false negative) and tn (true negative).
Table (II): Confusion matrix
tp fp PP
fn tn PN
AP AN 1
The reason of selecting these two measures in particular is that F1-Score considers both precision and recall in its calculations. Thus, it can be interpreted as a weighted average of both precision and recall. Therefore, it has the capability to measure the effectiveness of system outcomes. This explains the widespread usage of this measure in many fields such as, Artificial Intelligence and Machine Learning. On the other hand, accuracy considers both negative and positive cases alike and hence provides a balanced quality evaluation measure. [28]
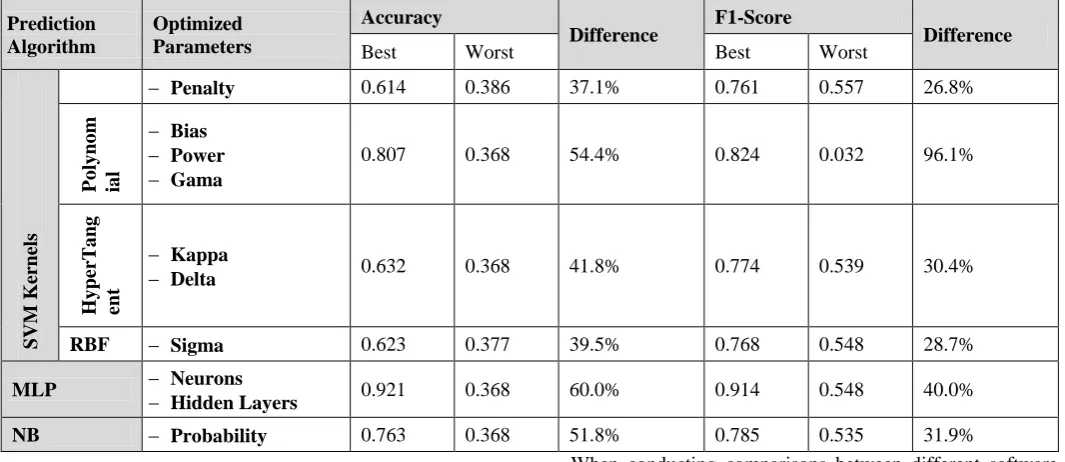
Table (III): The best and worst performance values for SVM, MLP, and NB algorithms.
Prediction Algorithm
Optimized Parameters
Accuracy
Difference F1-Score Difference
Best Worst Best Worst
SV
M
K
er
ne
ls
− Penalty 0.614 0.386 37.1% 0.761 0.557 26.8%
P
ol
y
n
om
ia
l
− Bias
− Power
− Gama
0.807 0.368 54.4% 0.824 0.032 96.1%
H
y
p
erT
a
n
g
en
t
− Kappa
− Delta 0.632 0.368 41.8% 0.774 0.539 30.4%
RBF − Sigma 0.623 0.377 39.5% 0.768 0.548 28.7%
MLP −− Neurons
Hidden Layers 0.921 0.368 60.0% 0.914 0.548 40.0%
NB − Probability 0.763 0.368 51.8% 0.785 0.535 31.9%
V. RESULTS DISCUSSIONS
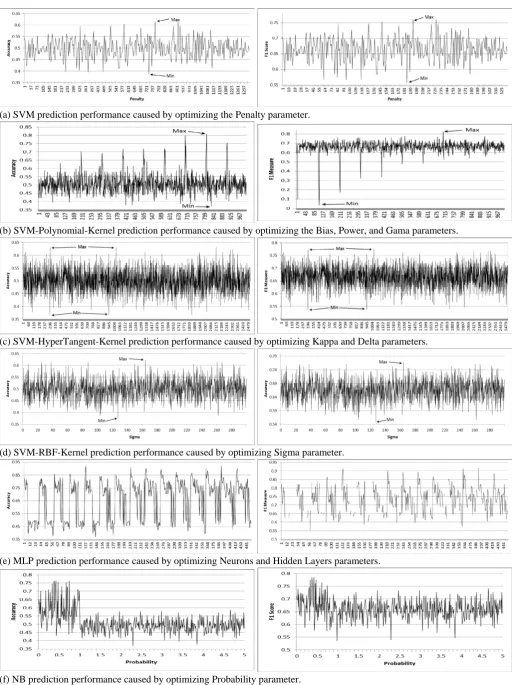
All experiments showed that all prediction algorithms’ performances fluctuated significantly due to the change of their parameters values. Table (III) summarizes the best and worst values for accuracy and F1-Score measures achieved by the SVM, MLP and NB algorithms. All results were normalized for easy comparison. Where 1 represents the best performance and 0 represents the worst performance. A Difference Percentage was calculated to show the fluctuation range from worst to best performances for each algorithm. To further scrutinize the results, fig (3)3
3When more than one parameter were optimized, serial numbers were used
to label the horizontal axis, as it was not possible to write all optimized parameters labels on the horizontal axis.
depicts the behavior of the three defects prediction algorithms’ performances due to the change of their parameters values.
When conducting comparisons between different software defects’ prediction models, a researcher might conclude that implementing SVM with polynomial kernel performs best compared to other prediction algorithms. This belief can be supported by fig (3, b) by reporting best SVM prediction performance and reporting the other algorithms’ worst performances. This kind of selective approach will lead to the possibility for another researcher to conclude the opposite by reporting different performance statistics.
Statistically speaking, both researchers will have a strong ground to build and defend their conclusions. However, from a software practitioner point of view, this kind of research will be useless as it will not help at all to make an informed decision to choose which the best tool to solve practical problems is. Therefore, this paper proposes the implementation of parameters’ optimization in research as a research standard to have more reliable and valid software engineering research outcomes.
[image:4.595.322.548.59.149.2] [image:4.595.32.287.120.238.2] [image:4.595.30.563.325.556.2](a) SVM prediction performance caused by optimizing the Penalty parameter.
(b) SVM-Polynomial-Kernel prediction performance caused by optimizing the Bias, Power, and Gama parameters.
(c) SVM-HyperTangent-Kernel prediction performance caused by optimizing Kappa and Delta parameters.
(d) SVM-RBF-Kernel prediction performance caused by optimizing Sigma parameter.
(e) MLP prediction performance caused by optimizing Neurons and Hidden Layers parameters.
(f) NB prediction performance caused by optimizing Probability parameter.
[image:5.595.41.554.46.731.2]That is, it becomes essential before publishing conclusions based on the performance of whatever software defects’ prediction models, a researcher must show that he/she has performed an optimization process to ensure that the reported performance is optimized for each examined prediction models, especially new and novel models.
This approach proposed by this paper is opposed to the common practice by researchers, which is simply applying the default values of defect prediction models parameters. In many cases, using default values will not suit all data sets and results in poor performance [14, 29]. Thus, unfair benchmarking would be resulted.
VI. CONCLUSIONS
In this paper we showed the significance of optimizing software defects prediction models parameters. This significance has two folds. First, it optimizes the performance of prediction models. In contrast with the common practice that simply implements the default values of a prediction algorithm’s parameter(s). Using default values might work in some scenarios, however, it will not report the best performance of the selected prediction algorithm. Second, conducts fair benchmarking between different prediction models in a useful way for a practitioner who tries to make an informed decision on which prediction model suits best a particular problem in hand.
Parameter(s) optimization is presented by this paper as a proposed powerful standard to increase the liability and validity of the software engineering research in general and software defects prediction models in particular. As it has become common in software engineering research to find conflicted published results and conclusions, optimizing prediction models parameters would present a vital role in soothing the severity of this phenomenon.
VII. REFERENCES
[1] Segaran, T., Programming collective intelligence: Building smart web 2.0 applications. 2007: " O'Reilly Media, Inc.".
[2] Beecham, S., P. O'Leary, S. Baker, I. Richardson, and J. Noll, Making software engineering research relevant. IEEE Computer Society, 2014. 47(4): p. 80-83.
[3] Shaw, M., What makes good research in software engineering? International Journal on Software Tools for Technology Transfer, 2002. 4(1): p. 1-7.
[4] Pfleeger, S.L., Albert einstein and empirical software engineering. Computer, 1999. 32(10): p. 32-38.
[5] Kocaguneli, E., T. Zimmermann, C. Bird, N. Nagappan, and T. Menzies. Distributed development considered harmful? in Software Engineering (ICSE), 2013 35th International Conference on. 2013.
[6] Kitchenham, B.A., T. Dyba, and M. Jorgensen. Evidence-based software engineering. in Software Engineering, 2004. ICSE 2004. Proceedings. 26th International Conference on. 2004.
[7] Straus, S.E., W.S. Richardson, P. Glasziou, and R.B. Haynes, Evidence-based medicine: How to practice and teach ebm. 2005.
[8] Council, A.N.H.A.M.R., How to use the evidence: Assessment and application of scientific evidence.
Series on preparing clinical practice guidelines. 2000, Canberra, Australia: NHMRC: Canberra.
[9] White, L.J., The importance of empirical work for software engineering papers. Software Testing, Verification and Reliability, 2002. 12(4): p. 195–196. [10] Myrtveit, I., E. Stensrud, and M. Shepperd,
Reliability and validity in comparative studies of software prediction models. Software Engineering, IEEE Transactions on, 2005. 31(5): p. 380-391.
[11] Tosun, A. and A. Bener. Reducing false alarms in software defect prediction by decision threshold optimization. in Proceedings of the 2009 3rd International Symposium on Empirical Software Engineering and Measurement. 2009. IEEE Computer Society.
[12] Can, H., X. Jianchun, Z. Ruide, L. Juelong, Y. Qiliang, and X. Liqiang. A new model for software defect prediction using particle swarm optimization and support vector machine. in Control and Decision Conference (CCDC), 2013 25th Chinese. 2013. IEEE. [13] Wahono, R.S., N. Suryana, and S. Ahmad,
Metaheuristic optimization based feature selection for software defect prediction. Journal of Software, 2014. 9(5): p. 1324-1333.
[14] Arcuri, A. and G. Fraser, Parameter tuning or default values? An empirical investigation in search-based software engineering. Empirical Software Engineering, 2013. 18(3): p. 594-623.
[15] Sayyad, A.S., K. Goseva-Popstojanova, T. Menzies, and H. Ammar. On parameter tuning in search based software engineering: A replicated empirical study. in Replication in Empirical Software Engineering Research (RESER), 2013 3rd International Workshop on. 2013. IEEE.
[16] Province, B.N., The effects of parameter tuning on machine learning performance in a software defect prediction context. 2015, WEST VIRGINIA UNIVERSITY.
[17] Wohlin, C., P. Runeson, M. Höst, M.C. Ohlsson, B. Regnell, and A. Wesslén, Experimentation in software engineering. 2012: Springer Science & Business Media. [18] Votta, L.G., A. Porter, and D. Perry. Experimental
software engineering: A report on the state of the art. in ICSE. 1995.
[19] Gao, K., T.M. Khoshgoftaar, H. Wang, and N. Seliya, Choosing software metrics for defect prediction: An investigation on feature selection techniques. Software: Practice and Experience, 2011. 41(5): p. 579-606.
[20] Chawla, N.V., Data mining for imbalanced datasets: An overview, in Data mining and knowledge discovery handbook. 2005, Springer. p. 853-867.
[21] Riquelme, J., R. Ruiz, D. Rodríguez, and J. Moreno, Finding defective modules from highly unbalanced datasets. Actas de los Talleres de las Jornadas de Ingeniería del Software y Bases de Datos, 2008. 2(1): p. 67-74.
[23] Witten, I.H. and E. Frank, Data mining: Practical machine learning tools and techniques. 2005: Morgan Kaufmann.
[24] Chawla, N.V., K.W. Bowyer, L.O. Hall, and W.P. Kegelmeyer, Smote: Synthetic minority over-sampling technique. Journal of artificial intelligence research, 2002: p. 321-357.
[25] Bergstra, J. and Y. Bengio, Random search for hyper-parameter optimization. The Journal of Machine Learning Research, 2012. 13(1): p. 281-305.
[26] Powers, D.M., Evaluation: From precision, recall and f-measure to roc, informedness, markedness and correlation. 2011.
[27] Fenton, N. and B. Kitchenham, Validating software measures. Software Testing, Verification and Reliability, 1991. 1(2): p. 27-42.
[28] Kitchenham, B.A., L.M. Pickard, S.G. MacDonell, and M.J. Shepperd. What accuracy statistics really measure [software estimation]. in Software, IEE Proceedings-. 2001. IET.